. 2015 Jan;81(2):522-32.
doi: 10.1128/AEM.03191-14. Epub 2014 Oct 31.

Phyllosphere bacterial community of floating macrophytes in paddy soil environments as revealed by illumina high-throughput sequencing

Affiliations

Phyllosphere bacterial community of floating macrophytes in paddy soil environments as revealed by illumina high-throughput sequencing

Wan-Ying Xie et al. Appl Environ Microbiol. 2015 Jan.

Abstract

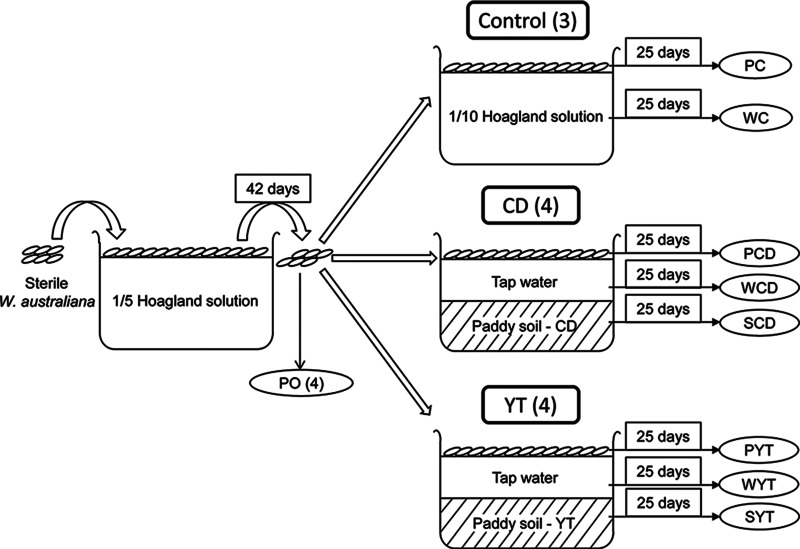
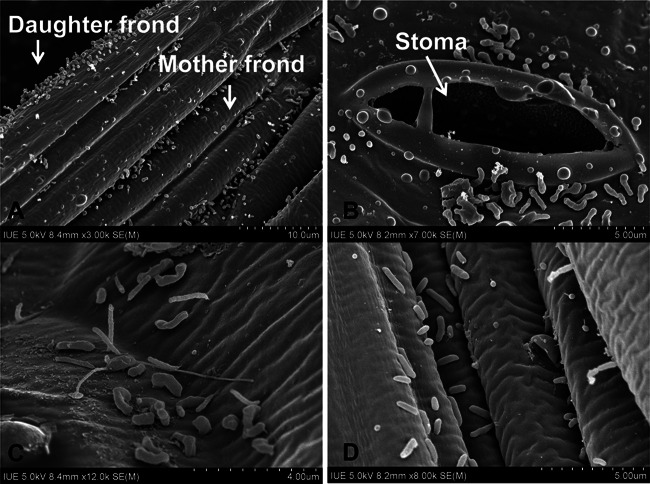
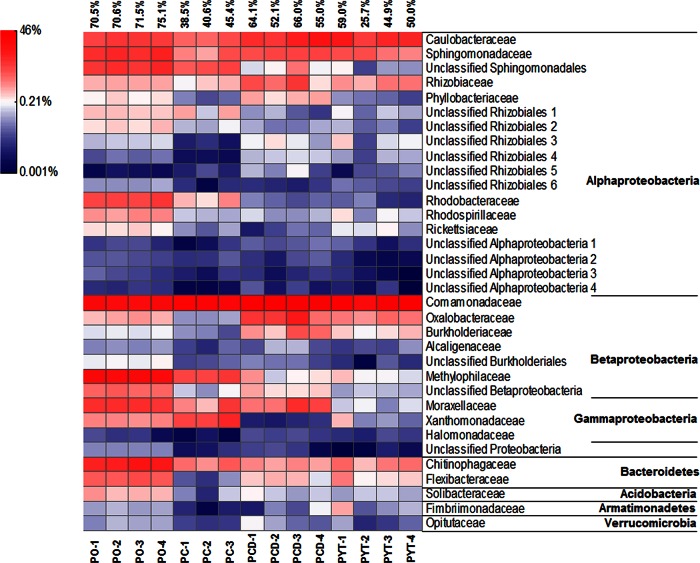
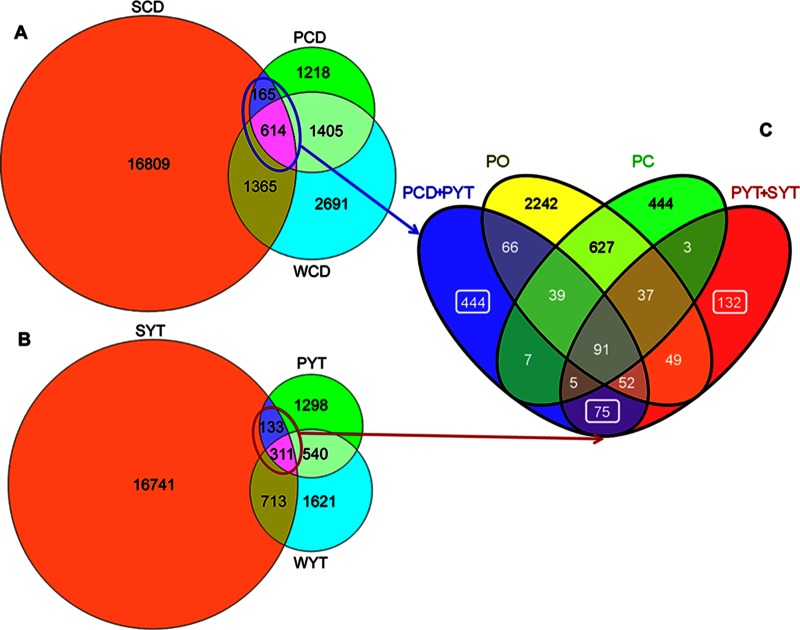
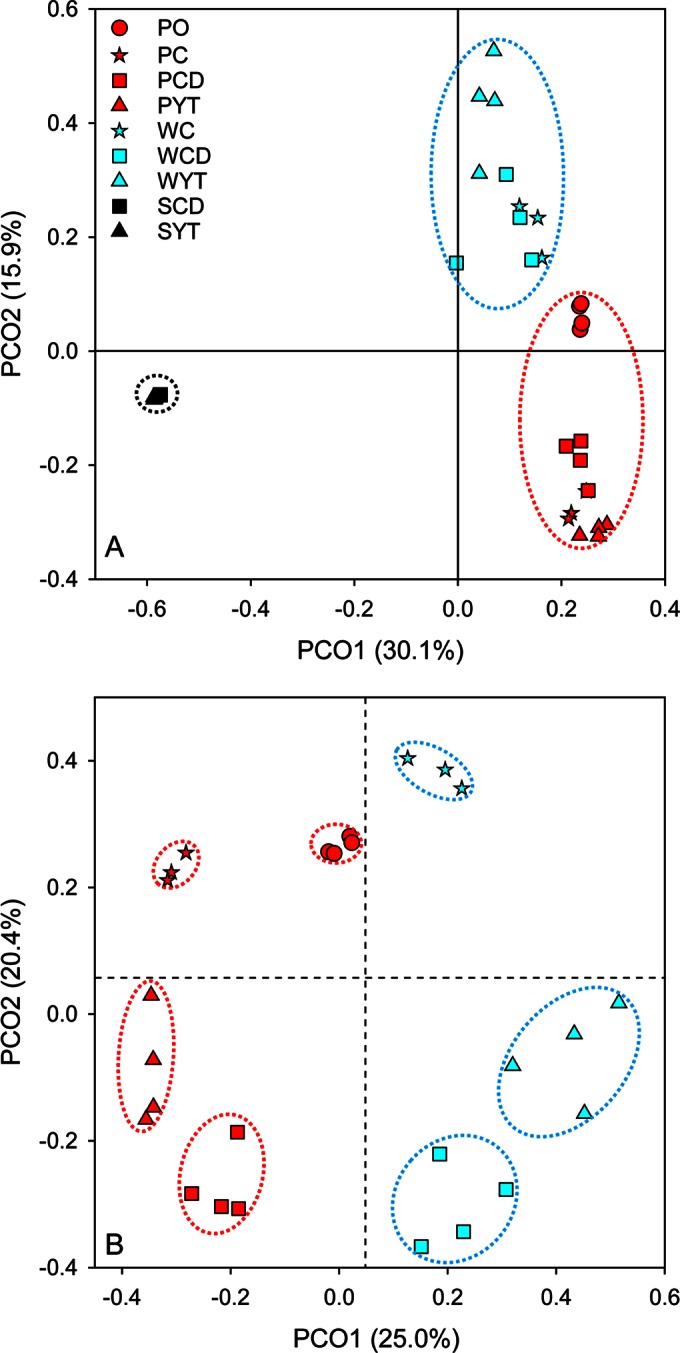
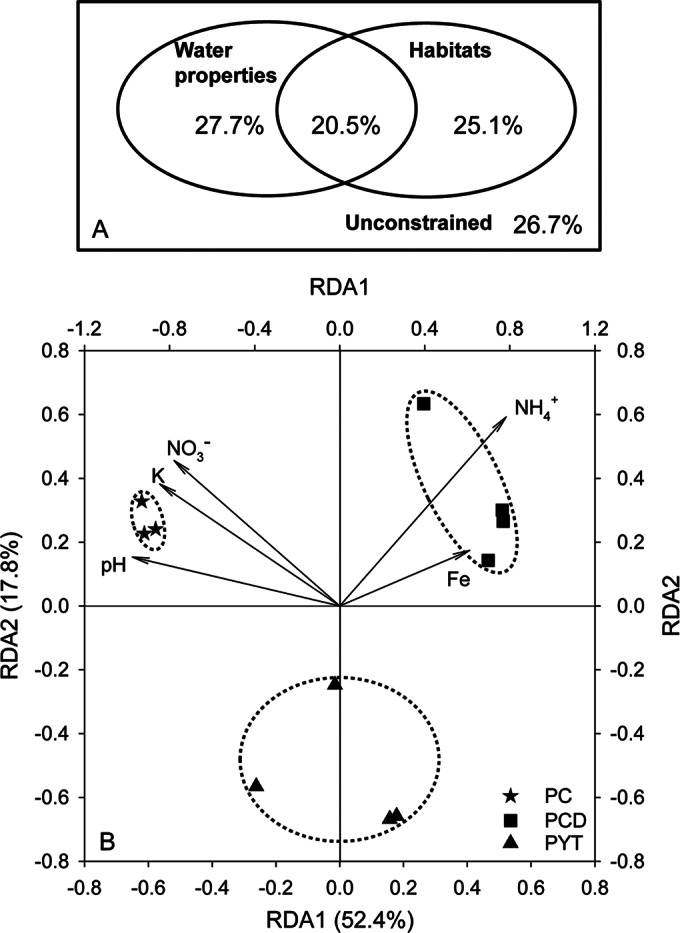
The phyllosphere of floating macrophytes in paddy soil ecosystems, a unique habitat, may support large microbial communities but remains largely unknown. We took Wolffia australiana as a representative floating plant and investigated its phyllosphere bacterial community and the underlying driving forces of community modulation in paddy soil ecosystems using Illumina HiSeq 2000 platform-based 16S rRNA gene sequence analysis. The results showed that the phyllosphere of W. australiana harbored considerably rich communities of bacteria, with Proteobacteria and Bacteroidetes as the predominant phyla. The core microbiome in the phyllosphere contained genera such as Acidovorax, Asticcacaulis, Methylibium, and Methylophilus. Complexity of the phyllosphere bacterial communities in terms of class number and α-diversity was reduced compared to those in corresponding water and soil. Furthermore, the bacterial communities exhibited structures significantly different from those in water and soil. These findings and the following redundancy analysis (RDA) suggest that species sorting played an important role in the recruitment of bacterial species in the phyllosphere. The compositional structures of the phyllosphere bacterial communities were modulated predominantly by water physicochemical properties, while the initial soil bacterial communities had limited impact. Taken together, the findings from this study reveal the diversity and uniqueness of the phyllosphere bacterial communities associated with the floating macrophytes in paddy soil environments.


Figures

FIG 1
FIG 1
Procedure for plant incubation and sampling. Numbers in parentheses indicate the replicate numbers for each treatment. Soil preincubation is not included in this figure. CD, paddy soil sampled from Changde, China; YT, paddy soil sampled from Yingtan, China; PO, phyllosphere bacterial community of the original W. australiana ready for the transplantation; P, phyllosphere; W, water; S, soil; C, control.
FIG 2
FIG 2
Representative SEM images of bacteria in the phyllosphere of W. australiana. (A) Bacteria on the reproductive pocket in the phyllosphere of W. australiana ready for transplantation. (B) Bacteria around a stoma in the phyllosphere of W. australiana ready for the transplantation. (C) CD treatment. (D) YT treatment. The pictures were taken by scanning electron microscopy with a tension of 5 kV.
FIG 3
FIG 3
Taxonomic distributions of bacterial phyla (A) and classes (B) in the phyllosphere, water, and soil bacterial communities. Each bar represents the average value of three or four replicates in each sample group. Phyla in panel B are distinguished by colors as shown in panel A. Numbers on the right are the counts for the total phyla or classes and the respective standard deviation (SD) in parentheses observed in each sample group. Letters represented results from one-way ANOVA of the phylum or class richness. The same letter indicates no significant difference. P, phyllosphere; W, water; S, soil; O, original duckweed ready for transplantation; C, control.
FIG 4
FIG 4
Taxonomic distributions of the most abundant (frequency, >1%) bacterial orders (A) and families (B) in the phyllosphere and the corresponding relative frequencies in water and soil bacterial communities. Other orders/families include all the classified orders/families with relative frequencies of less than 1% in all the phyllosphere samples. Each bar represents the average value of three or four replicates in each sample group. P, phyllosphere; W, water; S, soil; O, original duckweed ready for the transplantation; C, control.
FIG 5
FIG 5
Heat map showing the core bacterial microbiome in the phyllosphere and the relative frequencies for each family. Data above the figure are the total relative frequencies of the chosen taxa in the corresponding phyllosphere communities.
FIG 6
FIG 6
Venn diagram showing the number of shared and unique OTUs in different sample groups. (A) Shared and unique OTUs in the samples of phyllosphere, water, and soil in the CD treatment. (B) Shared and unique OTUs in the samples of phyllosphere, water, and soil in the YT treatment. (C) OTUs shared by phyllosphere and soil (PCD + SCD and PYT + SYT) compared with the original (PO) and control (PC) phyllosphere communities. The numbers marked by squares are OTUs shared exclusively by phyllosphere and soils. All the observed OTUs were used in the analysis. Circles in panels A and B are proportional to the OTU numbers detected in each sample group.
FIG 7
FIG 7
Structures of bacterial communities. (A) Principal-coordinate analysis (PCoA) of pairwise Bray-Curtis dissimilarity between all samples. (B) PCoA of pairwise Bray-Curtis dissimilarity excluding the soil samples. The Bray-Curtis dissimilarity was calculated using R (version 2.14.0) with the labdsv package (version 1.6-1).
FIG 8
FIG 8
Contributions of environmental factors to the bacterial structuring. (A) Variation partitioning analysis of bacterial diversity among phyllosphere and water samples explained by water properties and habitat types. Water properties at the harvest are shown in Table 2. Habitat types of phyllosphere and water are designated “1” and “2,” respectively. The presence of soil (PC and WC, without soil, are designated “0”; PCD, WCD, PTY, and WYT, with soil from Changde and Yingtan, are assigned “1”) was also included in the environmental factors but with no explanation value observed. (B) Redundancy analysis (RDA) of the relationship between the OTU compositions in the phyllosphere samples and the water properties. The analysis included only PC, PCD, and PYT because the water properties for PO were not available. The length of each arrow indicates the contribution of the parameter to the structural variation.

References

    1. Lindow SE, Brandl MT. 2003. Microbiology of the phyllosphere. Appl Environ Microbiol 69:1875–1883. doi:10.1128/AEM.69.4.1875-1883.2003. - DOI - PMC - PubMed
    1. Bulgarelli D, Schlaeppi K, Spaepen S, van Themaat EVL, Schulze-Lefert P. 2013. Structure and functions of the bacterial microbiota of plants. Annu Rev Plant Biol 64:807–838. doi:10.1146/annurev-arplant-050312-120106. - DOI - PubMed
    1. Delmotte N, Knief C, Chaffron S, Innerebner G, Roschitzki B, Schlapbach R, von Mering C, Vorholt JA. 2009. Community proteogenomics reveals insights into the physiology of phyllosphere bacteria. Proc Natl Acad Sci U S A 106:16428–16433. doi:10.1073/pnas.0905240106. - DOI - PMC - PubMed
    1. Vorholt JA. 2012. Microbial life in the phyllosphere. Nat Rev Microbiol 10:828–840. doi:10.1038/nrmicro2910. - DOI - PubMed
    1. Yang CH, Crowley DE, Borneman J, Keen NT. 2001. Microbial phyllosphere populations are more complex than previously realized. Proc Natl Acad Sci U S A 98:3889–3894. doi:10.1073/pnas.051633898. - DOI - PMC - PubMed

Publication types

Associated data

LinkOut - more resources