. 2014 Dec 1;193(11):5613-25.
doi: 10.4049/jimmunol.1401161. Epub 2014 Oct 31.

Compartmentalization of simian immunodeficiency virus replication within secondary lymphoid tissues of rhesus macaques is linked to disease stage and inversely related to localization of virus-specific CTL

Affiliations

Compartmentalization of simian immunodeficiency virus replication within secondary lymphoid tissues of rhesus macaques is linked to disease stage and inversely related to localization of virus-specific CTL

Elizabeth Connick et al. J Immunol. .

Abstract

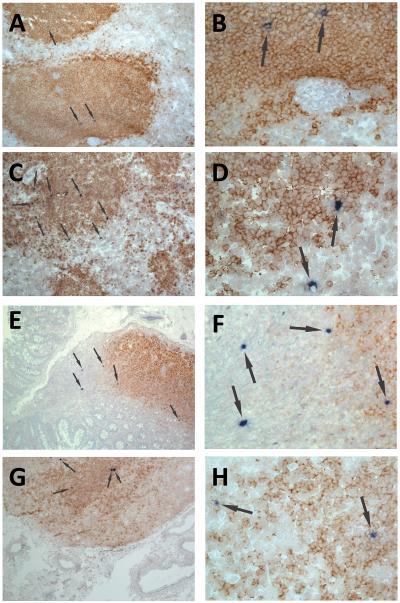
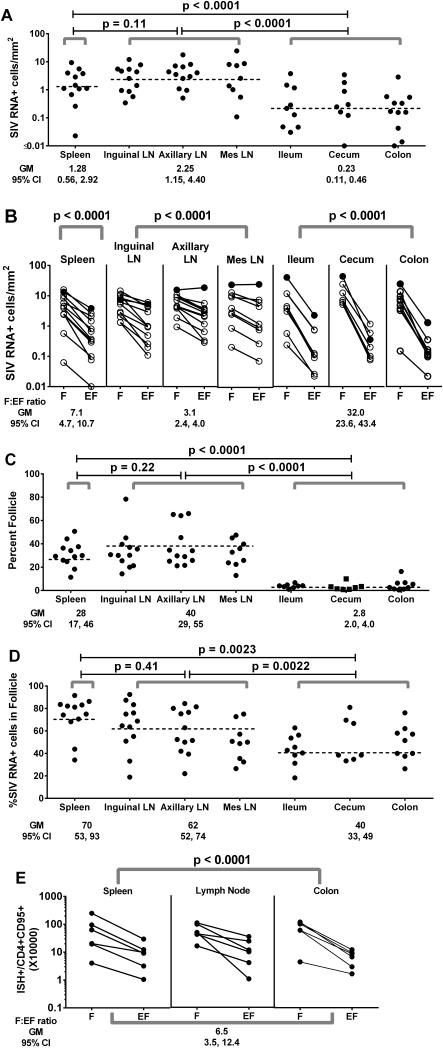
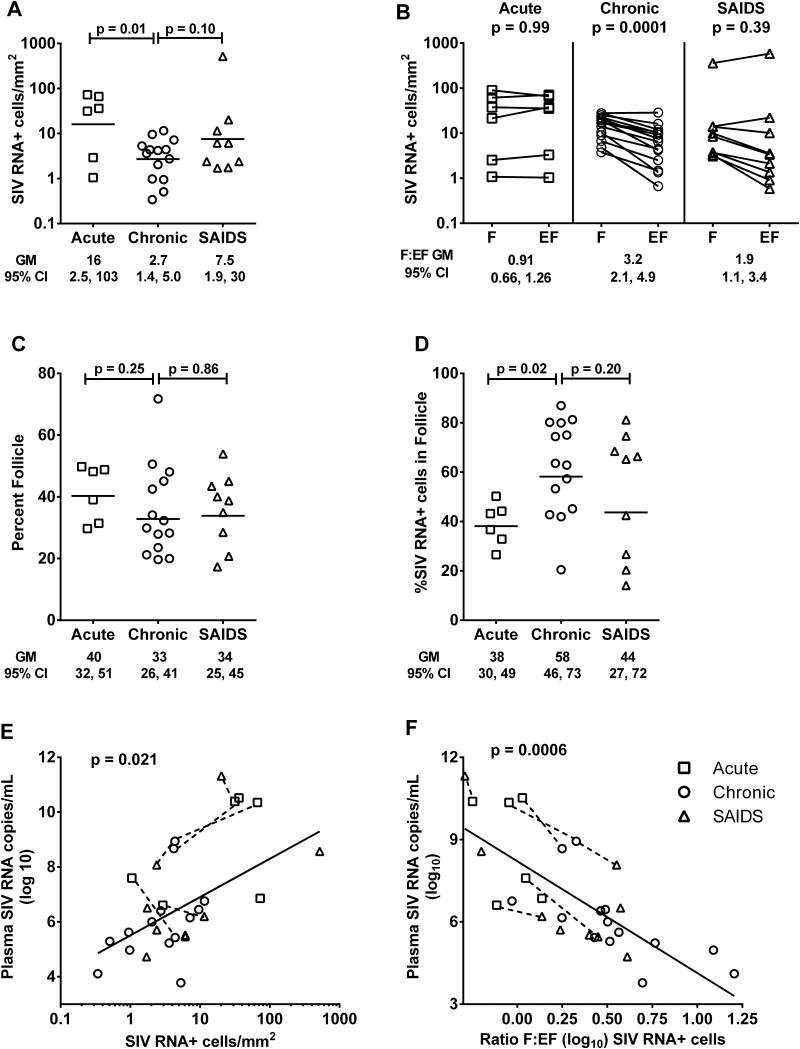
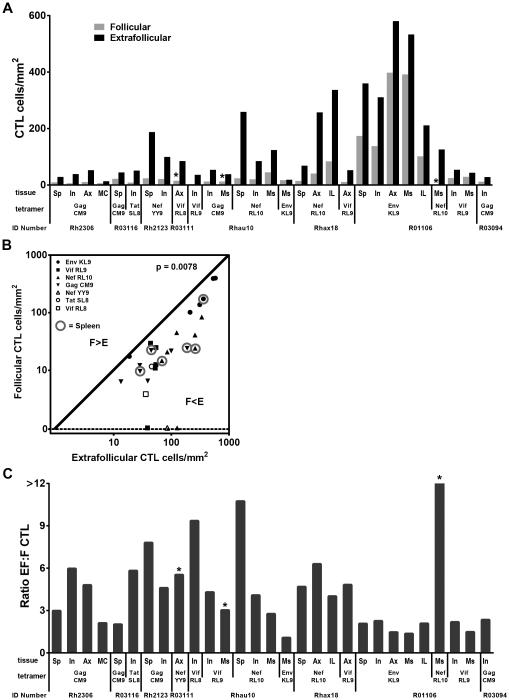
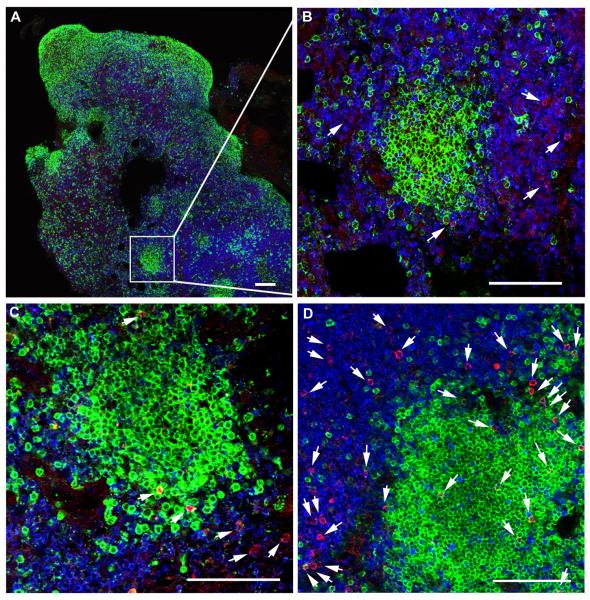
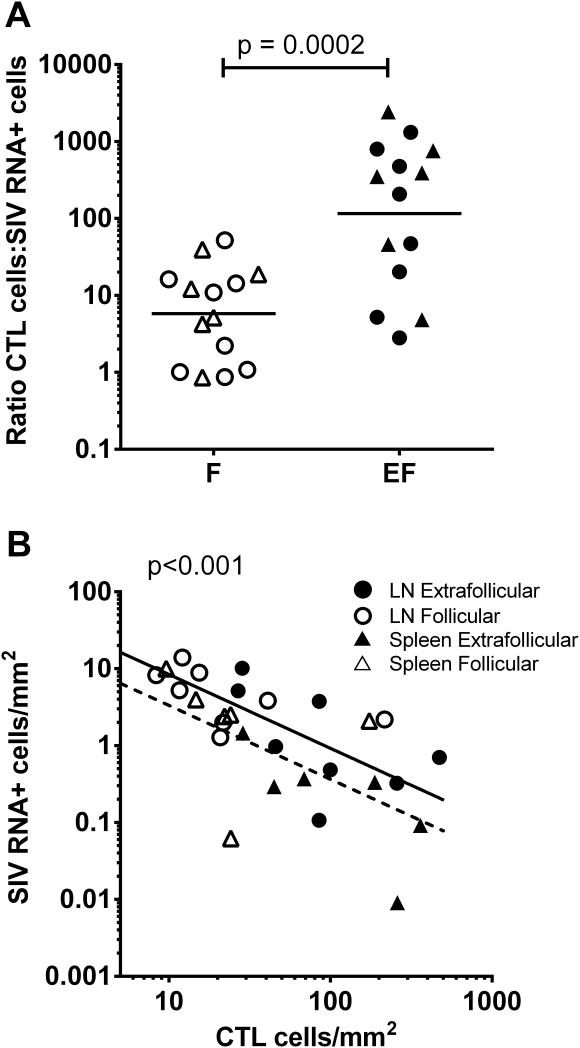
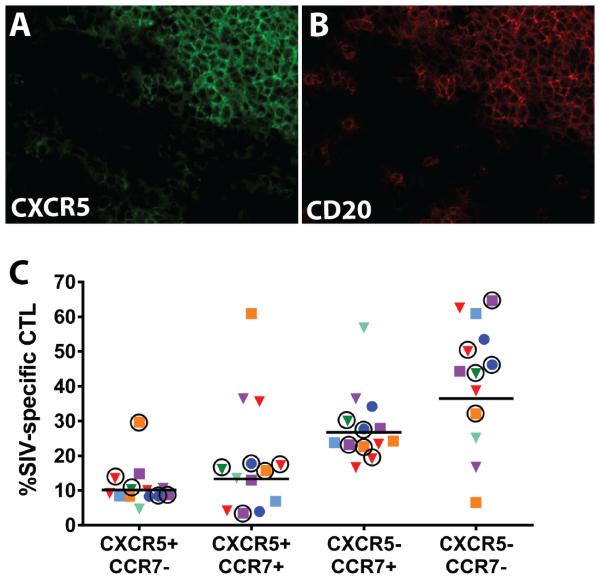
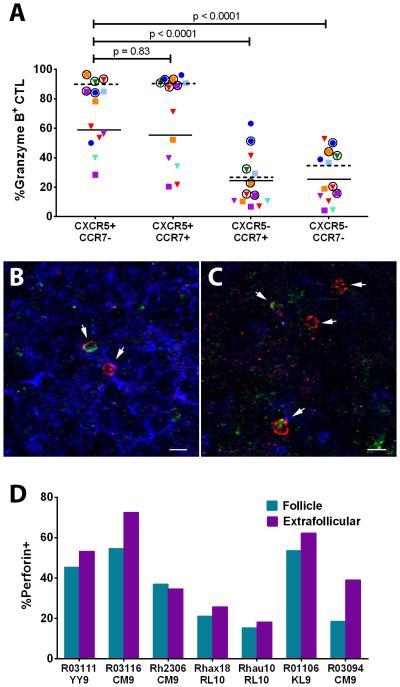
We previously demonstrated that HIV replication is concentrated in lymph node B cell follicles during chronic infection and that HIV-specific CTL fail to accumulate in large numbers at those sites. It is unknown whether these observations can be generalized to other secondary lymphoid tissues or whether virus compartmentalization occurs in the absence of CTL. We evaluated these questions in SIVmac239-infected rhesus macaques by quantifying SIV RNA(+) cells and SIV-specific CTL in situ in spleen, lymph nodes, and intestinal tissues obtained at several stages of infection. During chronic asymptomatic infection prior to simian AIDS, SIV-producing cells were more concentrated in follicular (F) compared with extrafollicular (EF) regions of secondary lymphoid tissues. At day 14 of infection, when CTL have minimal impact on virus replication, there was no compartmentalization of SIV-producing cells. Virus compartmentalization was diminished in animals with simian AIDS, which often have low-frequency CTL responses. SIV-specific CTL were consistently more concentrated within EF regions of lymph node and spleen in chronically infected animals regardless of epitope specificity. Frequencies of SIV-specific CTL within F and EF compartments predicted SIV RNA(+) cells within these compartments in a mixed model. Few SIV-specific CTL expressed the F homing molecule CXCR5 in the absence of the EF retention molecule CCR7, possibly accounting for the paucity of F CTL. These findings bolster the hypothesis that B cell follicles are immune privileged sites and suggest that strategies to augment CTL in B cell follicles could lead to improved viral control and possibly a functional cure for HIV infection.


Figures

Figure 1
Figure 1. Localization of SIV RNA+ cells in secondary lymphoid tissues of chronically infected rhesus macaques
Representative images of in situ hybridization for SIV RNA to identify virus-producing cells (blue/black cells indicated by arrows) and CD20 staining (brown) to morphologically identify B cell follicles in spleen (A, B), axillary lymph node (C, D), ileum (E, F) and colon (G, H). Images B, D, F and H are high magnification (original magnification 252X) images from the fields shown in A, C, E and F (original magnification 63X), respectively.
Figure 2
Figure 2. Distribution of SIV RNA+ cells in secondary lymphoid tissue compartments of chronically SIV-infected rhesus macaques
(A) Frequencies of total SIV RNA+ cells differed among secondary lymphoid tissues (p<0.0001). (B) Frequencies of SIV RNA+ cells in B-cell follicles (indicated by F) and extrafollicular regions (indicated as EF) differed among lymphoid tissues (p<0.0001). (C) Percentages of secondary lymphoid tissues constituted by B cell follicles differed among lymphoid tissues (p<0.0001). (D) Percentages of SIV RNA+ cells located in B cell follicles differed among lymphoid tissues (p=0.0005). (E) Frequencies of SIV RNA+ cells in B-cell follicles were significantly higher than those in extrafollicular regions (P<0.0001), after adjusting for frequencies of CD95+CD4+ cells in each compartment (Supplemental Figure 1C). There were no differences in the F:EF ratio among tissues (p=0.67) nor were there differences in levels of SIV-producing cells in these compartments among tissues (p>0.51) after adjusting for CD95+CD4+ cells. Data were analyzed using a model that controlled for multiple observations within the same animal for each type of lymphoid tissue, indicated by gray brackets. Dotted horizontal lines indicate the geometric mean (GM) within the model for each type of tissue, which is also shown in the data below each graph. LN indicates lymph node. Mes indicates mesenteric.
Figure 3
Figure 3. Distribution and frequency of SIV RNA+ cells in lymph nodes of rhesus macaques during acute infection (day 14), chronic asymptomatic infection, and simian AIDS (SAIDS)
(A) Frequencies of SIV RNA+ cells in lymph nodes. (B) Frequencies of SIV RNA+ cells in B cell follicles (F) compared to extrafollicular regions (EF) of lymph nodes. (C) Percentage of tissue that consisted of follicle did not differ among animals by disease stage. (D) Percentages of SIV RNA+ cells within B cell follicles. (E) Frequencies of SIV RNA+ cells within lymph nodes predicted plasma viral load. For every 1 log10 increase in SIV RNA+ cells, there was a 1.40 log10 (95% CI, 0.35, 2.45) increase in plasma viral load. (F) The F:EF ratio of SIV RNA+ cells in lymph nodes predicted plasma viral load. On average, viral load decreased by 4.0 log10 (95% CI, −5.33, −2.67) copies/mL for each 1 log10 increase in F:EF. This relationship did not significantly differ by disease stage (p=0.30). Furthermore, when the analysis was restricted to animals with chronic, asymptomatic infection, results were still statistically significant (p=0.0078), with viral load decreases by 3.04 log10 (95%CI −5.12, −0.96) copies/mL for each 1 log10 increase in F:EF. Dotted lines link data points from animals that were sampled in more than one disease stage. Horizontal lines indicate geometric mean (GM) values.
Figure 4
Figure 4. Quantification of SIV-specific CTL in compartments of lymph node (LN) and spleen (Sp) from chronically infected rhesus macaques
(A) Frequencies of SIV-specific CTL in follicular and extrafollicular compartments according to animal and CTL epitope. Frequencies of virus-specific CTL were significantly higher (p=0.0078) in extrafollicular regions compared to follicular regions in both lymph node (medians, 54 cells/mm2 versus 17 cells/mm2, respectively) and spleen (medians, 128 cells/mm2 versus 23 cells/mm2, respectively), using an exact binomial test in which results for each animal were collapsed. (B) Relationship between frequencies of extrafollicular and follicular SIV-specific CTL. Samples from spleen are indicated with a circle, whereas all others are from lymph node. Extrafollicular SIV-specific CTL was a significant predictor of follicular CTL (p=0.0024). For every 1 log10 increase in extrafollicular SIV-specific CTL, there was on average a 0.72 log10 (95% CI, 0.30, 1.14) increase in follicular CTL. (C) Ratio of extrafollicular (EF) to follicular (F) SIV-specific CTL. *indicates animals who had no SIV-specific CTL detected in folliclesIn these cases, a value of 1 cell per total tissue area evaluated was assigned. For animal R01106, the EF:F Nef RL10-specific CTL ratio was 54. Abbreviations: Sp=spleen; In=inguinal lymph node; Ax=axillary lymph node; Il=iliac lymph node; MC=mesocolonic lymph node; Ms=mesenteric lymph node.
Figure 5
Figure 5. Localization of SIV-specific CTL in secondary lymphoid tissues of rhesus macaques during chronic infection
Representative lymph node tissue sections stained with MHC class I tetramers (red) to label SIV-specific CTL, CD3 antibodies (blue) to label T cells, and CD20 antibodies (green) to label B cells and delineate B cell follicles. (A) Shows a montage of multiple confocal projected z-scans from an inguinal lymph node from animal Rhau10 stained with Mamu-B*008:01/Vif RL8 tetramers. (B-D) are confocal z-scans showing the range of localization patterns of SIV-specific CTL within follicles typically seen in spleen and lymph nodes from animals in the study. (B) Enlargement from A demonstrating a B cell follicle devoid of CTL. (C) Tissue section from the same lymph node shown in A and B now stained with Mamu-B*008:01/Vif RL9 tetramers demonstrating an example of CTL located on the follicle edge. (D) A mesocolonic lymph node section from animal R03116 stained with Mamu-A*001:01/Gag CM9 tetramers exemplifying CTL distributed throughout a follicle. Tetramer+ cells within the sections were identified in montages of high-resolution serial z-scans, and are indicated by arrows in B-D. Within individual z-scans, tops and bottoms of cells were distinguished from non-specific background staining by stepping up and down through the adjacent z-scans. Red staining in the images without arrows was determined to be background staining by this technique. Confocal images were collected with a 20X objective and each scale bar indicates 100 μm.
Figure 6
Figure 6. In vivo relationships between SIV-specific CTL and SIV RNA+ cells within compartments of lymph node (LN) and spleen from chronically infected rhesus macaques
(A) Effector to target cell ratios of SIV-specific CTL to SIV RNA+ cells were significantly higher in extrafollicular (EF) compared to follicular compartments (F) for both lymph node (n=8) and spleen (n=6). (B) Frequencies of SIV-specific CTL within F and EF predicted frequencies of SIV RNA+ cells within those compartments in a mixed model analysis that controlled for tissue type. For every 1 log10 increase in SIV-specific CTL, there was on average a −0.96 change in log10 SIV RNA+ cells (95% CI, −1.31,−0.61). Results for spleen are summarized by the dotted line and for lymph node by the solid line. If data were available for more than one CTL epitope in an animal, only the most abundant SIV-specific CTL response was evaluated. If data were available for multiple lymph nodes in an animal, results were averaged.
Figure 7
Figure 7. CXCR5 expression within lymph node and spleen of chronically SIV_infected rhesus macaques and on SIV-specific CTL
(A,B) Representative images of a double-stained spleen section from animal Rh2123 demonstrating that most CXCR5+ cells shown in green (A) are localized within B cell follicles defined by CD20 staining and shown in red (B). (C) Percentages of subsets of SIV-specific cells defined by CXCR5 and CCR7 expression from lymph nodes and spleens of SIV-infected rhesus macaques as determined by flow cytometry (see gating strategy in Supplemental Figure 3). Each animal is indicated by a different color. Triangles indicate CTL directed against SIV Gag CM9, circles indicate CTL directed against Nef YY9, and squares indicate CTL directed against Nef RL10. Spleen tissues are indicated by a circle around the symbol and symbols without a circle around them indicate lymph node cells. Results for spleen and lymph node were not statistically different (p=0.30). Horizontal lines indicate the geometric mean.
Figure 8
Figure 8. CTL effector protein expression within follicular and extrafollicular SIV-specific CTL in spleen and lymph nodes of rhesus macaques
(A) Granzyme B expression within follicular (CXCR5+CCR7-) and extrafollicular (CXCR5- and/or CCR7+) subsets of SIV-specific CTL as determined by tetramer staining and flow cytometry (see gating strategy in Supplemental Figure 3). Each animal is indicated by a different color. Triangles indicate CTL directed against SIV Gag CM9, circles indicate CTL directed against Nef YY9, and squares indicate CTL directed against Nef RL10. Spleen tissues are indicated by a circle around the symbol and symbols without a circle around them indicate lymph node cells. Granzyme B expression was significantly higher in spleen (horizontal dotted lines indicates mean values) compared to lymph node (horizontal solid lines indicate mean values) (p<0.0001). (B, C) Representative images of in situ perforin staining within SIV-specific CTL located in follicular (B) and extrafollicular (C) regions of a lymph node from animal Rh2306 stained with Mamu-A*001:01/Gag CM9 tetramers (red), anti-perforin antibodies (green), and anti-IgM (blue) to define B-cell follicles morphologically. Confocal z-scans were collected with a 20X objective. Scale bar in B is 50 μm and in C is10 μm. (D) Percentages of perforin+ tetramer-binding cells within and outside of lymph node follicles determined by in situ staining. Using a generalized linear model for a negative binomial distribution that accounted for within subjects correlation and adjusted for loge (area), the percentage of perforin+ cells within the tetramer-binding population was approximately 15.9% (95% CI, 8.6%, 22.6%) lower in follicles compared to extrafollicular regions (p<0.001).

Similar articles

Cited by

References

    1. Connick E, Mattila T, Folkvord JM, Schlichtemeier R, Meditz AL, Ray MG, McCarter MD, Mawhinney S, Hage A, White C, Skinner PJ. CTL fail to accumulate at sites of HIV-1 replication in lymphoid tissue. J Immunol. 2007;178:6975–6983. - PubMed
    1. Folkvord JM, Armon C, Connick E. Lymphoid follicles are sites of heightened human immunodeficiency virus type 1 (HIV-1) replication and reduced antiretroviral effector mechanisms. AIDS Res Hum Retroviruses. 2005;21:363–370. - PubMed
    1. Hufert FT, van Lunzen J, Janossy G, Bertram S, Schmitz J, Haller O, Racz P, von Laer D. Germinal centre CD4+ T cells are an important site of HIV replication in vivo. Aids. 1997;11:849–857. - PubMed
    1. Tenner-Racz K, Stellbrink HJ, van Lunzen J, Schneider C, Jacobs JP, Raschdorff B, Grosschupff G, Steinman RM, Racz P. The unenlarged lymph nodes of HIV-1-infected, asymptomatic patients with high CD4 T cell counts are sites for virus replication and CD4 T cell proliferation. The impact of highly active antiretroviral therapy. J Exp Med. 1998;187:949–959. - PMC - PubMed
    1. Biberfeld P, Chayt KJ, Marselle LM, Biberfeld G, Gallo RC, Harper ME. HTLV-III expression in infected lymph nodes and relevance to pathogenesis of lymphadenopathy. Am J Pathol. 1986;125:436–442. - PMC - PubMed

Publication types

LinkOut - more resources