. 2014 Dec 1;193(11):5515-24.
doi: 10.4049/jimmunol.1401798. Epub 2014 Oct 31.

DBC1 is a suppressor of B cell activation by negatively regulating alternative NF-κB transcriptional activity

Affiliations

DBC1 is a suppressor of B cell activation by negatively regulating alternative NF-κB transcriptional activity

Sinyi Kong et al. J Immunol. .

Abstract

CD40 and BAFFR signaling play important roles in B cell proliferation and Ig production. In this study, we found that B cells from mice with deletion of Dbc1 gene (Dbc1(-/-)) show elevated proliferation, and IgG1 and IgA production upon in vitro CD40 and BAFF, but not BCR and LPS stimulation, indicating that DBC1 inhibits CD40/BAFF-mediated B cell activation in a cell-intrinsic manner. Microarray analysis and chromatin immunoprecipitation experiments reveal that DBC1 inhibits B cell function by selectively suppressing the transcriptional activity of alternative NF-κB members RelB and p52 upon CD40 stimulation. As a result, when immunized with nitrophenylated-keyhole limpet hemocyanin, Dbc1(-/-) mice produce significantly increased levels of germinal center B cells, plasma cells, and Ag-specific Ig. Finally, loss of DBC1 in mice leads to higher susceptibility to experimental autoimmune myasthenia gravis. Our study identifies DBC1 as a novel regulator of B cell activation by suppressing the alternative NF-κB pathway.


Conflict of interest statement

Disclosure of Conflicts of Interest. The authors declare no competing financial interests.

Figures

Figure 1
Figure 1. Dbc1−/− B cells have increased cell division and immunoglobulin production
(A) Splenic B cells were isolated from WT and Dbc1−/− mice, and cultured with: α-BCR, α-CD40 plus IL4, LPS, and LPS plus BAFF. Proliferation was measured after 5 days by CFSE dilution. (B) Proliferation measured by reduction in Mean Fluorescence Intensity (MFI) when cultured with indicated stimuli in (A). (C) Cell cycle progression of WT and KO B cells upon CD40 stimulation measured by 5′-ethynul-2′-deoxyuridine (EdU) and 7-AAD. Percentage of cells at S and G2/M- phase are shown at top left and bottom right. (D) Percentages of G0/G1, S, and G2/M- phase cells quantified from experiment in (C). (E) IgM, IgG1 and IgA levels in culture supernatant from (A) were measured by ELISA. Error bars represent SEM. A-D, N=7 independent experiments. E, N=5, *p<0.05, **p<0.01 ***p<0.001.
Figure 2
Figure 2. DBC1 regulates B cell proliferation and immunoglobulin production in a B cell-intrinsic manner
Bone marrow from congenic B6.SJL mice (CD45.1) and Dbc1−/− mice (CD45.2) were adoptively transferred into recipient B6.SJL mice. Reconstituted splenocytes were isolated 6–7 weeks after transfer, and analyzed for lymphocyte and B220+ cell percentages in (A). (B) Percentages of B220+IgM+ mature B cells from gated CD45.1 (WT) and CD45.2 (KO) populations. (C) Isolated CD45.1 (WT) and CD45.2 (KO) B cells were co-cultured with the indicated stimuli. Proliferation, IgG1 and IgA expression of WT and KO B cells were measured by CFSE and FACS. (D) Mean percentages of CD45.1 (WT)and CD45.2 (KO) cells based on total splenocytes (top) and B220+ gated cells (bottom). (E) Mean percentages of B220+IgM+ cells based on gated CD45.1 (WT)and CD45.2 (KO) cells. (F) Proliferation as measured by reduction in MFI from (C). (G) Percentages of IgG1 – expressing cells from WT and KO populations as measured in (C). (H) Percentages of IgA-expressing cells from WT and KO populations as measured in (C). Error bars represent SEM. N=5. * P<0.05, **P<0.01, ***P<0.001.
Figure 3
Figure 3. Microarray analysis of the gene expression profiles in Dbc1−/− B cells
Genes differentially upregulated (left) or downregulated (right) by > 4 fold in Dbc1−/− B cells upon CD40 stimulation were subjected to functional annotation analysis (A) Gene categories with highest enrichment from upregulated (top) or downregulated genes (bottom) are listed. (B) Gene categories that are enriched in upregulated (top) and downregulated (bottom) genes upon BCR stimulation. (C) Heat map of relevant differentially expressed genes upon BCR and CD40 stimulation. (D) Response Elements were identified for genes differentially regulated > 4 fold, and tallied (left: upregulated; right: downregulated). (E) Real-Time PCR (qPCR) was performed for 3 relevant proliferative genes CCNB1, CDC20 and Birc5. Error bars represent SEM. N=6 from 3 independent experiments. *P<0.05, **P<0.01.
Figure 4
Figure 4. DBC1 selectively suppresses alternative NF-κB pathway in B cells
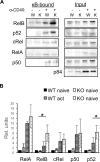
(A) Primary B cells were cultured with α-CD40 and IL-4 overnight. Cell lysates from naïve and activated WT and Dbc1−/− B cells were then incubated with biotinylated- DNA probe containing the κb-consensus sequence, and avidin-conjugated agarose beads. DNA-bound NF-κB members in naïve and CD40-activated WT and Dbc1−/− B cells were then pelleted, and detected by Western Blot. 10% of the nuclear extract not used in the binding assay was used as loading control. (B) Densitometry analysis of (A) for DNA-bound NF-κB members, normalized to naïve WT. Error bars represent SEM. N=5 independent experiments. *=P<0.05.
Figure 5
Figure 5. DBC1 suppresses RelB binding at target gene promoters
(A) WT and Dbc1−/− (KO) B cells were activated with α-CD40 for the indicated times, and RelB DNA-binding was assayed by ChIP. The promoter regions of Birc5, CCNB1, and CDC20 were quantified by qPCR. cIAP2 promoter region serves as positive control. Normal rabbit IgG was used as a negative control. (B) WT and KO B cells were activated as in (A), and ChIP was performed using α-RelA antibody. Error bars represent SEM. N=5 independent experiments. *=P<0.05.
Figure 6
Figure 6. Dbc1−/− mice have aberrant immunoglobulin production
(A) WT and KO littermates were immunized with NP-KLH emulsified in Complete Freund’s Adjuvant. NP-specific serum immunoglobulins were measured on day 14 by ELISA. (B–F) WT and Dbc1−/− littermates were immunized with NP-KLH in the absence of adjuvant. (B) NP-specific immunoglobulin of the indicated isotypes measured by ELISA. (C) Lymphocytes were gated on B220+ cells, and further analyzed for NP-binding IgG1+ (top) and IgA+ (bottom) cells by flow cytometry. (D) Average number of NP-binding IgG1+ and NP-binding IgA+ B cells as measured in (C). (E) Splenic plasma cells (CD138+B220lo) and germinal center B cells (B220+PNA+) in immunized WT and KO mice. (F) Mean percentages splenic plasma cells and germinal center B cells quantified from (E). Error bars represent SEM. N=6 mice from 2 independent experiments, * P<0.05, **P<0.01, ***P<0.005.
Figure 7
Figure 7. Dbc1−/− mice have increased clinical score and production of cross-reactive immunoglobulin in Experimental Autoimmune Myasthenia Gravis
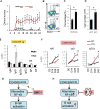
WT and Dbc1−/− littermates were immunized with 100μg tAChR and muscle weakness was evaluated as described in the Methods section. (A) Mice were evaluated for muscle strength every 3 days as described in the Methods section, and mean clinical score of each group reported. (B) Splenocytes were isolated on day 42 and analyzed for plasma cells. (C) Percentage and (D) numbers of plasma cells from (B). (E) Antigen-specific response of WT and KO detected by measuring antibodies against tAChR. (F) Cross-reactive immunoglobulin against murine AChR (mAChR) measured by ELISA. Error bars represent SEM. N=5, *=P<0.05, **=P<0.01. (G) DBC1 suppresses alternative NF-κB transcriptional activity, negatively regulating B cell activation and immunoglobulin production. (H) When DBC1 is absent in B cells, loss of alternative NF-κB suppression results in increased B cell activation, leading to increased B cell proliferation, and increased immunoglobulin levels in mice. Error bars represent SEM. N=6 from 2 independent experiments.

References

    1. Mackay F, Schneider P, Rennert P, Browning J. BAFF AND APRIL: a tutorial on B cell survival. Annu Rev Immunol. 2003;21:231–264. - PubMed
    1. Crowley JE, Scholz JL, Quinn WJ, 3rd, Stadanlick JE, Treml JF, Treml LS, Hao Y, Goenka R, O’Neill PJ, Matthews AH, Parsons RF, Cancro MP. Homeostatic control of B lymphocyte subsets. Immunol Res. 2008;42:75–83. - PMC - PubMed
    1. Elgueta R, Benson MJ, de Vries VC, Wasiuk A, Guo Y, Noelle RJ. Molecular mechanism and function of CD40/CD40L engagement in the immune system. Immunol Rev. 2009;229:152–172. - PMC - PubMed
    1. Hostager BS, Bishop GA. CD40-Mediated Activation of the NF-kappaB2 Pathway. Frontiers in immunology. 2013;4:376. - PMC - PubMed
    1. Bishop GA, Hostager BS. Signaling by CD40 and its mimics in B cell activation. Immunol Res. 2001;24:97–109. - PubMed

Publication types

MeSH terms

Associated data