

Ischemic stroke activates hematopoietic bone marrow stem cells
- PMID: 25362208
- PMCID: PMC4312511
- DOI: 10.1161/CIRCRESAHA.116.305207
Ischemic stroke activates hematopoietic bone marrow stem cells
Abstract
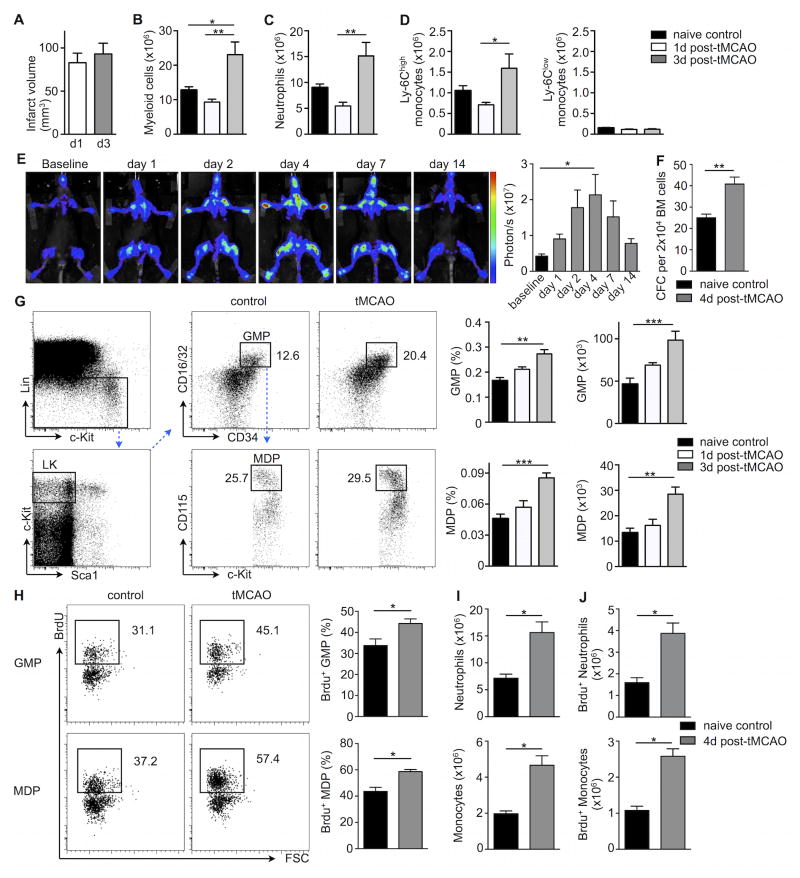
Rationale: The mechanisms leading to an expanded neutrophil and monocyte supply after stroke are incompletely understood.
Objective: To test the hypothesis that transient middle cerebral artery occlusion (tMCAO) in mice leads to activation of hematopoietic bone marrow stem cells.
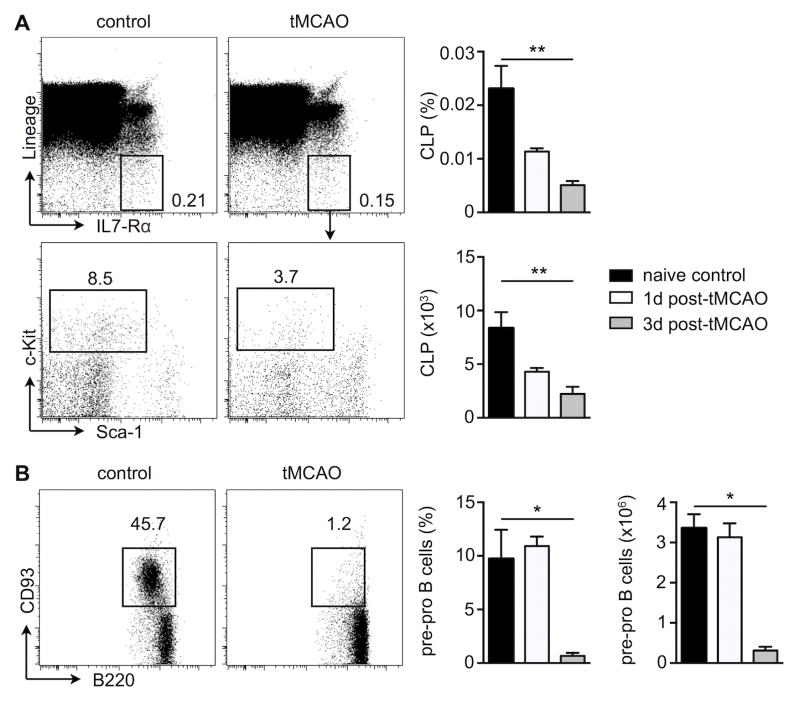
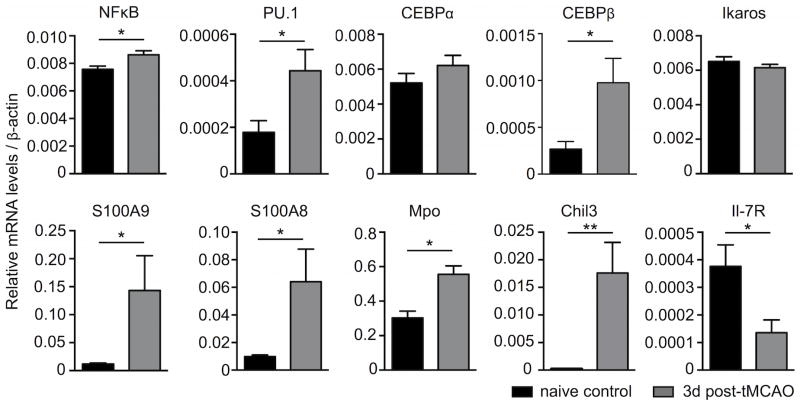
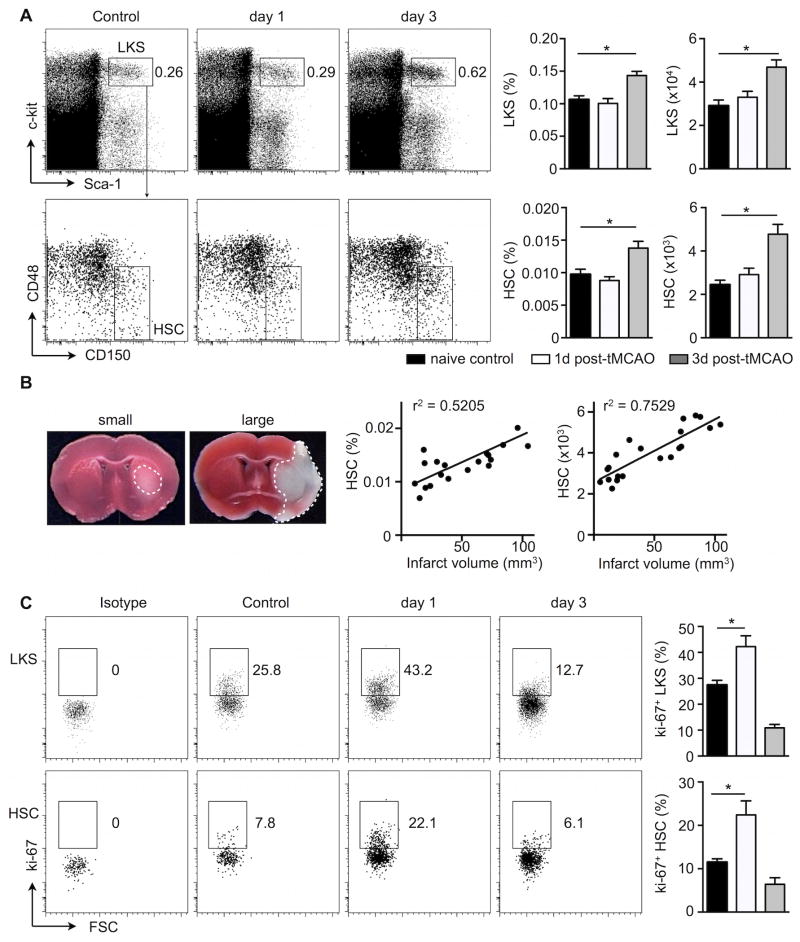
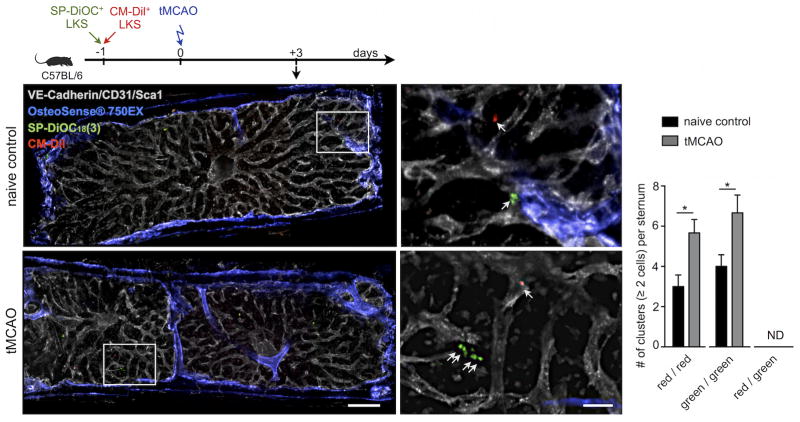
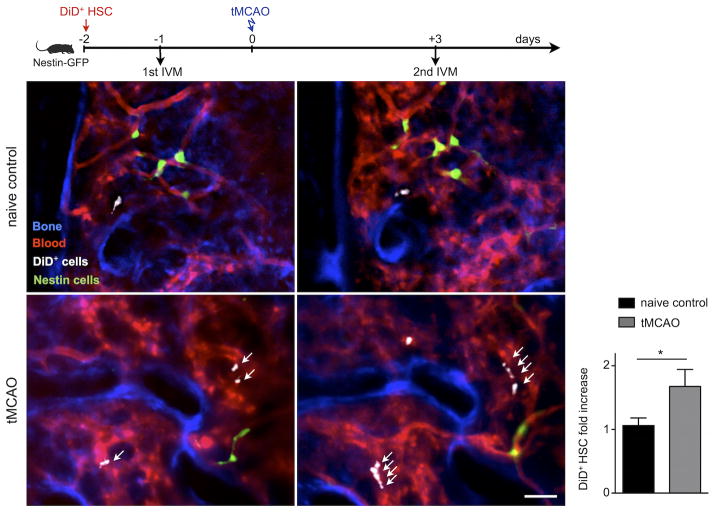
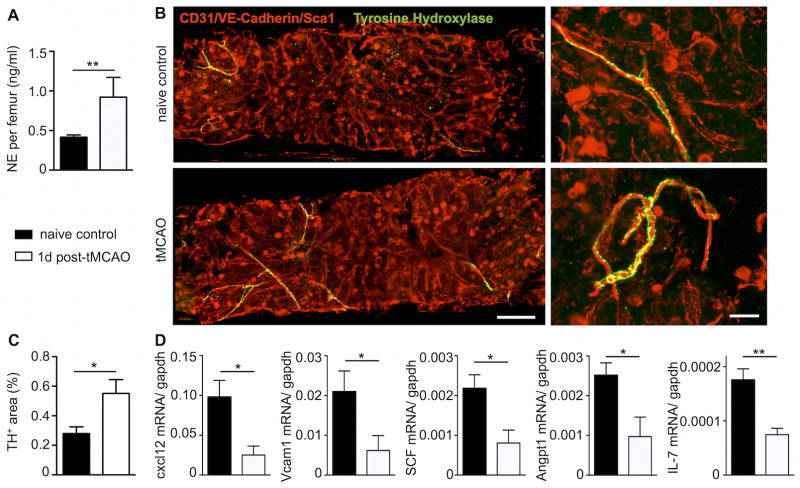
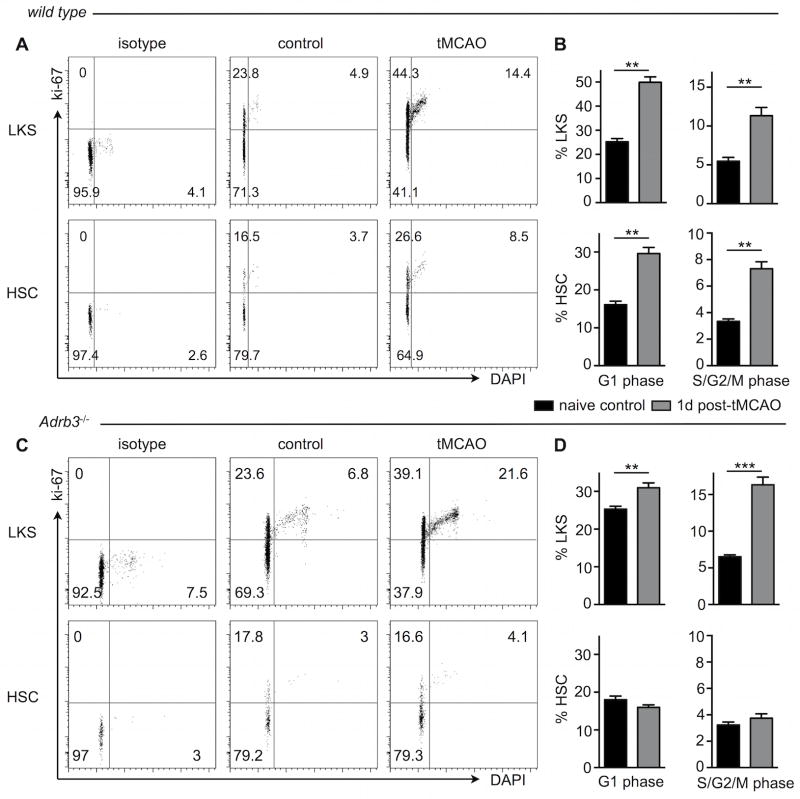
Methods and results: Serial in vivo bioluminescence reporter gene imaging in mice with tMCAO revealed that bone marrow cell cycling peaked 4 days after stroke (P<0.05 versus pre tMCAO). Flow cytometry and cell cycle analysis showed activation of the entire hematopoietic tree, including myeloid progenitors. The cycling fraction of the most upstream hematopoietic stem cells increased from 3.34%±0.19% to 7.32%±0.52% after tMCAO (P<0.05). In vivo microscopy corroborated proliferation of adoptively transferred hematopoietic progenitors in the bone marrow of mice with stroke. The hematopoietic system's myeloid bias was reflected by increased expression of myeloid transcription factors, including PU.1 (P<0.05), and by a decline in lymphocyte precursors. In mice after tMCAO, tyrosine hydroxylase levels in sympathetic fibers and bone marrow noradrenaline levels rose (P<0.05, respectively), associated with a decrease of hematopoietic niche factors that promote stem cell quiescence. In mice with genetic deficiency of the β3 adrenergic receptor, hematopoietic stem cells did not enter the cell cycle in increased numbers after tMCAO (naive control, 3.23±0.22; tMCAO, 3.74±0.33, P=0.51).
Conclusions: Ischemic stroke activates hematopoietic stem cells via increased sympathetic tone, leading to a myeloid bias of hematopoiesis and higher bone marrow output of inflammatory Ly6C(high) monocytes and neutrophils.
Keywords: bone marrow; hematopoietic stem cells; monocyte; stroke.
© 2014 American Heart Association, Inc.
Figures
Comment in
-
Waking up the stem cell niche: how hematopoietic stem cells generate inflammatory monocytes after stroke.Circ Res. 2015 Jan 30;116(3):389-92. doi: 10.1161/CIRCRESAHA.114.305678. Circ Res. 2015. PMID: 25634966 Free PMC article. No abstract available.
Similar articles
-
Waking up the stem cell niche: how hematopoietic stem cells generate inflammatory monocytes after stroke.Circ Res. 2015 Jan 30;116(3):389-92. doi: 10.1161/CIRCRESAHA.114.305678. Circ Res. 2015. PMID: 25634966 Free PMC article. No abstract available.
-
Adrenergic nerve degeneration in bone marrow drives aging of the hematopoietic stem cell niche.Nat Med. 2018 Jun;24(6):782-791. doi: 10.1038/s41591-018-0030-x. Epub 2018 May 7. Nat Med. 2018. PMID: 29736022 Free PMC article.
-
Stem cell niche-specific Ebf3 maintains the bone marrow cavity.Genes Dev. 2018 Mar 1;32(5-6):359-372. doi: 10.1101/gad.311068.117. Epub 2018 Mar 21. Genes Dev. 2018. PMID: 29563184 Free PMC article.
-
Adrenergic Modulation of Hematopoiesis.J Neuroimmune Pharmacol. 2020 Mar;15(1):82-92. doi: 10.1007/s11481-019-09840-7. Epub 2019 Feb 14. J Neuroimmune Pharmacol. 2020. PMID: 30762159 Review.
-
Heterogeneity of the bone marrow niche.Curr Opin Hematol. 2016 Jul;23(4):331-8. doi: 10.1097/MOH.0000000000000265. Curr Opin Hematol. 2016. PMID: 27177311 Free PMC article. Review.
Cited by
-
Metabolism in Hematopoiesis and Its Malignancy.Adv Exp Med Biol. 2023;1442:45-64. doi: 10.1007/978-981-99-7471-9_4. Adv Exp Med Biol. 2023. PMID: 38228958
-
Inflammatory Cell Recruitment in Cardiovascular Disease.Front Cell Dev Biol. 2021 Feb 18;9:635527. doi: 10.3389/fcell.2021.635527. eCollection 2021. Front Cell Dev Biol. 2021. PMID: 33681219 Free PMC article. Review.
-
Editor's Highlight: Role of Spleen-Derived Macrophages in Ozone-Induced Lung Inflammation and Injury.Toxicol Sci. 2017 Jan;155(1):182-195. doi: 10.1093/toxsci/kfw192. Epub 2016 Oct 5. Toxicol Sci. 2017. PMID: 27708193 Free PMC article.
-
Bone Tissue is an Integral Part of the Fascial System.Cureus. 2019 Jan 3;11(1):e3824. doi: 10.7759/cureus.3824. Cureus. 2019. PMID: 30868037 Free PMC article. Review.
-
Prolonged hematopoietic and myeloid cellular response in patients after an acute coronary syndrome measured with 18F-DPA-714 PET/CT.Eur J Nucl Med Mol Imaging. 2018 Oct;45(11):1956-1963. doi: 10.1007/s00259-018-4038-8. Epub 2018 May 4. Eur J Nucl Med Mol Imaging. 2018. PMID: 29728748 Free PMC article.
References
-
- Urra X, Villamor N, Amaro S, Gomez-Choco M, Obach V, Oleaga L, Planas AM, Chamorro A. Monocyte subtypes predict clinical course and prognosis in human stroke. J Cereb Blood Flow Metab. 2009;29:994–1002. - PubMed
-
- Nardi K, Milia P, Eusebi P, Paciaroni M, Caso V, Agnelli G. Admission leukocytosis in acute cerebral ischemia: influence on early outcome. J Stroke Cerebrovasc Dis. 2012;21:819–824. - PubMed
Publication types
MeSH terms
Substances
Grants and funding
LinkOut - more resources
Full Text Sources
Molecular Biology Databases
