. 2014 Nov 30;5(22):11653-68.
doi: 10.18632/oncotarget.2605.

Dysregulation of autophagy in human follicular lymphoma is independent of overexpression of BCL-2

Affiliations

Dysregulation of autophagy in human follicular lymphoma is independent of overexpression of BCL-2

Aine McCarthy et al. Oncotarget. .

Abstract

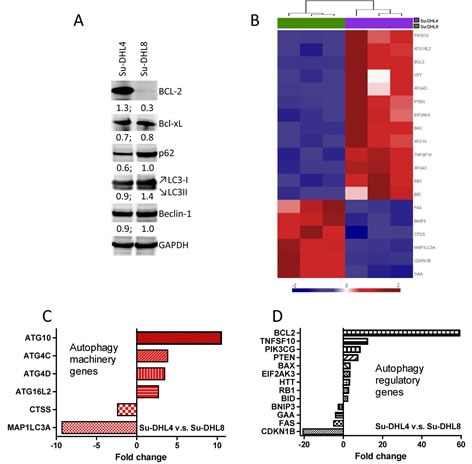
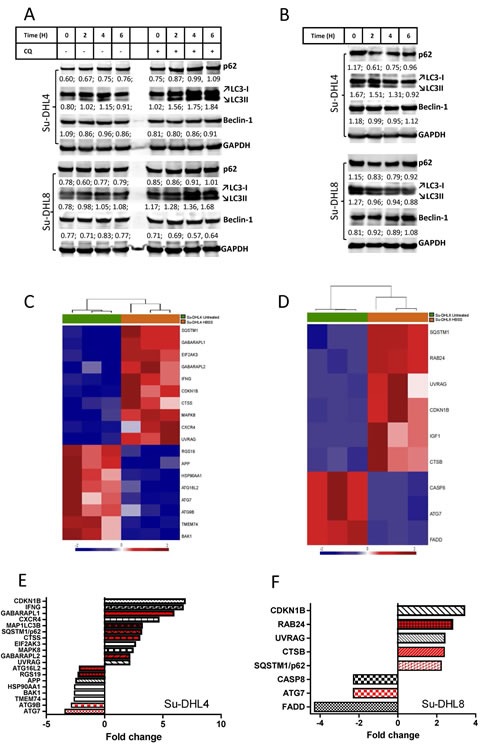
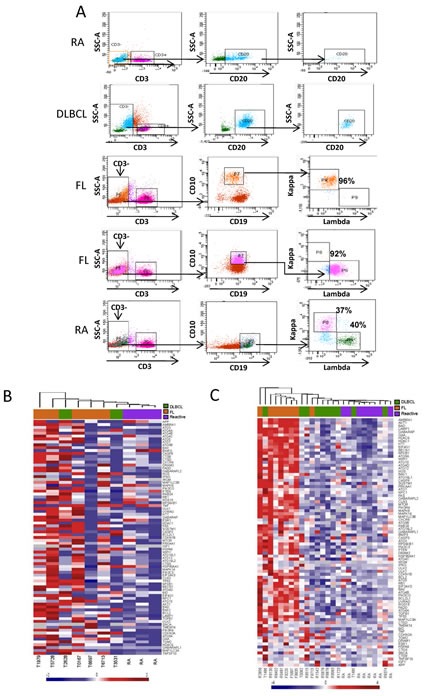
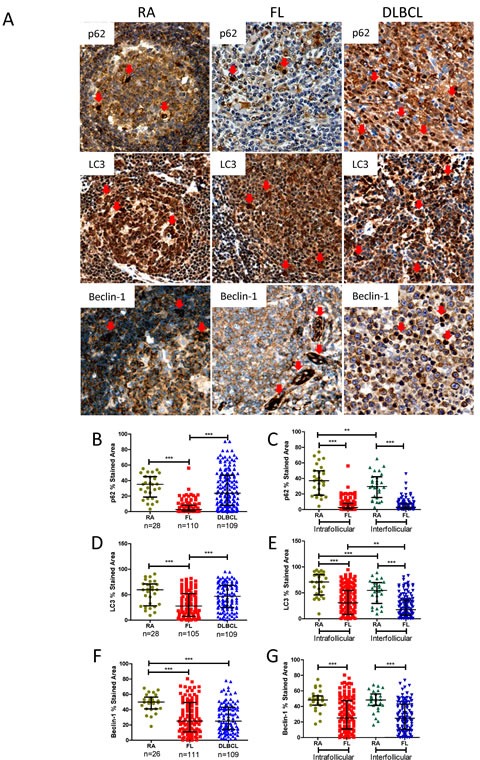
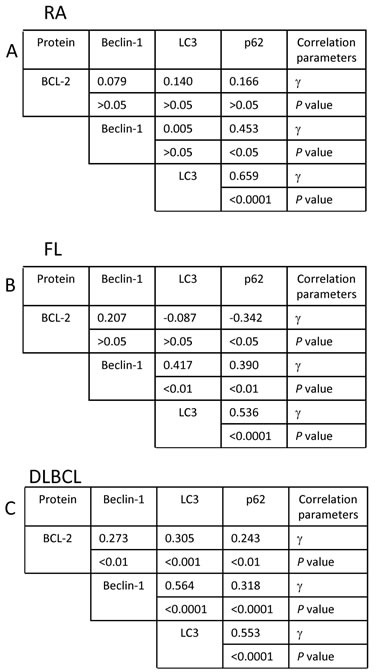
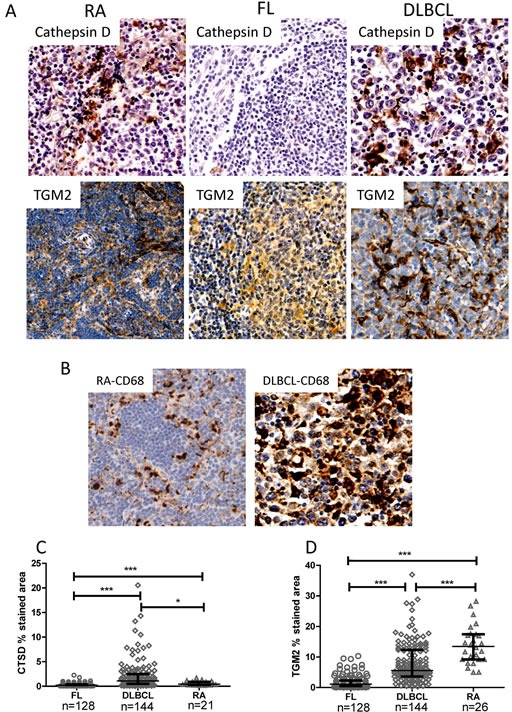
Overexpression of the anti-apoptotic protein BCL-2 is characteristic of human follicular lymphoma (FL) and some cases of diffuse large B cell lymphoma (DLBCL). We aimed to determine autophagy status in primary FL and DLBCL samples and the BCL-2+/BCL-2- lymphoma cell lines using both autophagy PCR array and tissue microarray (TMA). A greater number of autophagy machinery genes were up-regulated in the BCL-2+ Su-DHL4 cell line compared with BCL-2- Su-DHL8 cells, at both the basal level and in response to autophagic stress. The autophagy-related gene expression profiles were determined in purified and unpurified malignant human lymph node biopsies. Seven autophagy machinery genes were up-regulated in purified FL B-cells compared with reactive B-cells. Only 2 autophagy machinery genes were up-regulated in DLBCL B-cells. In unpurified tissue biopsies, 20 of 46 genes in FL and 2 of 5 genes in DLBCL with increased expression were autophagy machinery genes. Expression of autophagy substrates p62 and LC3 were determined by TMAs. FL samples showed significantly decreased levels of both p62 and LC3 compared with reactive and DLBCL, indicative of an increased autophagy activity in FL. In summary, these results demonstrate that FL showed increased basal autophagy activity, regardless of overexpression of BCL-2 in this disease.


Conflict of interest statement

Conflict of interest

The authors declare that they have no conflict of interest.

Figures

Figure 1
Figure 1. Determination of basal autophagy status in BCL-2 Su-DHL4 and BCL-2 Su-DHL8 cell lines
(A) Comparison of autophagy-related protein expression by Western blotting. 50 μg proteins were loaded onto each lane of a 12-well SDS-PAGE gel. Proteins were transferred to a PVDF membrane which was probed with primary antibody at 4°C overnight. Primary antibodies were used at a 1:2000 dilution for GAPDH and at 1:1000 for all other antibodies. Levels of protein expression were measured by densitometry. Numbers below panels of Western blots indicate the ratio of a specific protein to GAPDH. (B) Supervised hierarchical clustering of significantly differentially expressed autophagy machinery and autophagy regulation genes. Heat-map shows triplicate RQ values for Su-DHL4 and Su-DHL8 cell lines. Each column represents an mRNA/RQ value and each row a gene. Gene expression levels are represented as a gradient of blue to red color indicating low and high expression respectively. Side bars were removed for clarity. (C and D) RQ values of significantly increased or decreased autophagy machinery (C) and autophagy regulatory (D) genes differentially expressed in the Su-DHL4 cell line compared with the Su-DHL8 cell line, analyzed using student t-test (P<0.05) and represented as fold changes.
Figure 2
Figure 2. Inhibition or induction of the autophagic flux in Su-DHL4 and Su-DHL8 cell lines
(A) Blocking autophagic flux. Cells were incubated in normal culture medium in the presence or absence of 50 μM CQ. (B) Induction of autophagy by starvation. Cells were incubated in HBSS for up to 6 hours. Cells were collected at each indicated time point for protein extraction and Western blotting. Numbers below each band indicate ratios of specific proteins to GAPDH which were determined by densitometry. (C and D) Supervised hierarchical clustering of significantly differentially expressed autophagy related genes in Su-DHL4 (C) and Su-DHL8 (D) cells after incubation in HBSS for 6 hours. Heat-map shows triplicate RQ values for normal and HBSS cultured Su-DHL4 and Su-DHL8 cell lines. Each column represents an mRNA/RQ value and each row a gene. Gene expression levels are represented as a gradient of blue to red color indicating low and high expression respectively. (E and F) RQ values of autophagy related genes significantly differentially expressed in Su-DHL4 (E) and Su-DHL8 (F) cells after incubation in HBSS for 6 hours were analyzed by the paired student t-test (p<0.05) and represented as fold changes. Red bars indicate changes in autophagy machinery genes and black and white bars indicate changes in autophagy regulatory genes.
Figure 3
Figure 3. Determination of expression of autophagy related genes in purified and unpurified FL and DLBCL samples
(A) Flow sorting of B-cells. Immunophenotyping was used to isolate the B-cell population from human RA, FL and DLBCL single cell suspensions. B-cells were identified as CD3 CD20+ for RA and DLBCL samples and CD3/CD10+/CD19+ for FL samples. Purified FL B-cells were confirmed as being either κ or λ light chain restricted. (B and C) Unsupervised hierarchical clustering using autophagy-related genes expressed in purified B cells (B) and unpurified bulk biopsies (C). Five FL, 2 DLBCL and 3 RA purified samples (B) and 8 FL, 10 DLBCL and 8 RA tissue biopsies (C) were analyzed by qRT-PCR. Heat-map shows RQ values where each column represents a patient and each row a gene. Gene expression levels are represented as a gradient of blue to red color indicating low and high expression respectively; gray indicates missing data.
Figure 4
Figure 4. Comparison of p62, LC3 and Beclin-1 protein expression in FL and DLBCL with RA-LN
(A) Representative histochemical stained images of p62, LC3, and Beclin-1 in RA, FL and DLBCL. Proteins were stained with polyclonal anti-p62, polyclonal anti-LC3B antibody, or a mouse anti-Beclin-1 antibody respectively. Detailed information of antibodies and their dilution are listed in the Suppl Table 5. Red arrows indicate positive cells. (B-G) Statistical analysis p62 (B and C), LC3B (D and E) and Beclin-1 (F and G) expression. All data presented are medians with interquartile ranges. Sample numbers for RA and FL in C, E and G are as same as listed in B, D and F. Statistical difference between samples was analyzed by unpaired Mann-Whitney U test. *P<0.05, **P<0.01, and ***P<0.0001.
Figure 5
Figure 5. Multiple analysis of correlation between BCL-2, p62, LC3 and Beclin-1
(A) RA; (B) FL and (C) DLBCL. Correlation was analyzed by Pearson product-moment correlation coefficient test. ‘γ’ indicates correlation coefficient. Sample numbers, RA=30; FL=50 and DLBCL=109.
Figure 6
Figure 6. Immuno-histochemical staining of cathepsin D, TGM2 and CD68
(A) Representative images of cathepsin D and TGM2 expression in RA, FL and DLBCL. (B) Representative images of CD68 expression in RA and DLBCL. Antibody dilutions were 1:1000, 1:750, or 1:8000 for anti-cathepsin D, anti-TGM2, or anti-CD68 antibodies, respectively. Images were taken with a Leixa DM2500 microscope: original magnification X200. Cathepsin D, TGM2 and CD68 protein expression levels were defined as % stained viable tissue area. (C and D) Statistical analysis of protein levels of cathepsin D (B) and TGM2 (C) were calculated as the percent stained area of viable tissue. Data collected for RA and DLBCL were from whole cores and for FL were from the CD10+ intra-follicular area. Significantly increased or decreased expression between samples was analyzed by the Mann-Whitney U test. Numbers of samples used for analysis were indicated.

References

    1. Jia L, Dourmashkin RR, Allen PD, Gray AB, Newland AC, Kelsey SM. Inhibition of autophagy abrogates tumour necrosis factor alpha induced apoptosis in human T-lymphoblastic leukaemic cells. Br J Haematol. 1997;98(3):673–685. - PubMed
    1. Mizushima N, Levine B, Cuervo AM, Klionsky DJ. Autophagy fights disease through cellular self-digestion. Nature. 2008;451(7182):1069–1075. - PMC - PubMed
    1. White E. Deconvoluting the context-dependent role for autophagy in cancer. Nat Rev Cancer. 2012;12(6):401–410. - PMC - PubMed
    1. Rao S, Tortola L, Perlot T, Wirnsberger G, Novatchkova M, Nitsch R, Sykacek P, Frank L, Schramek D, Komnenovic V, Sigl V, Aumayr K, Schmauss G, Fellner N, Handschuh S, Glosmann M, et al. A dual role for autophagy in a murine model of lung cancer. Nat Commun. 2014;5:3056. - PubMed
    1. Wu WK, Coffelt SB, Cho CH, Wang XJ, Lee CW, Chan FK, Yu J, Sung JJ. The autophagic paradox in cancer therapy. Oncogene. 2012;31(8):939–953. - PubMed

Publication types

MeSH terms

LinkOut - more resources