. 2015 Jan;14(1):48-55.
doi: 10.1038/nmat4113. Epub 2014 Nov 2.

Metal-organic framework nanosheets in polymer composite materials for gas separation

Affiliations

Metal-organic framework nanosheets in polymer composite materials for gas separation

Tania Rodenas et al. Nat Mater. 2015 Jan.

Abstract

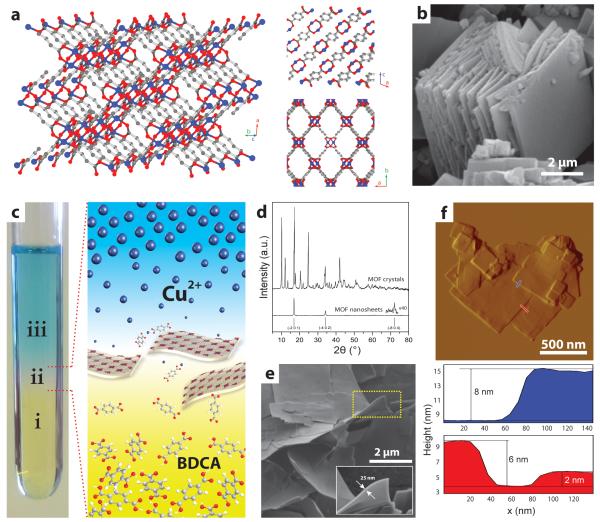
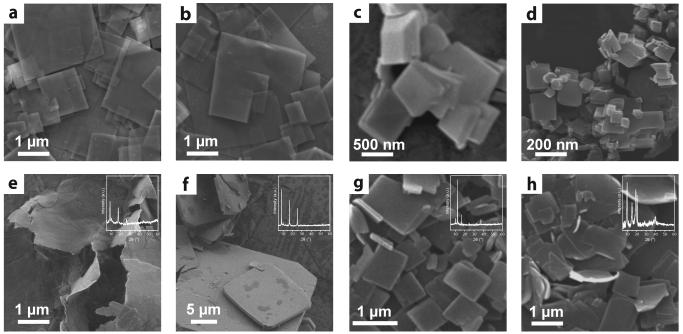
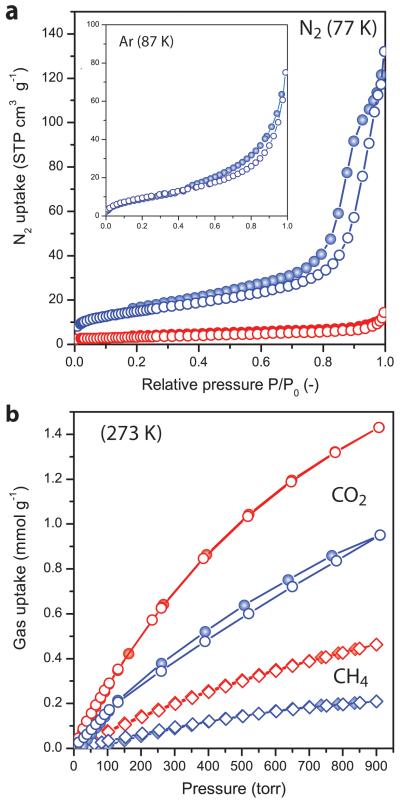
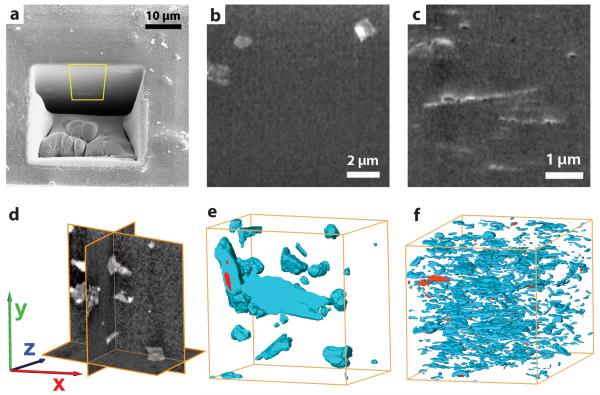
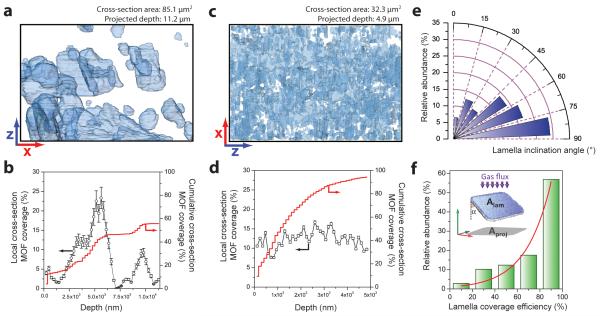
Composites incorporating two-dimensional nanostructures within polymeric matrices have potential as functional components for several technologies, including gas separation. Prospectively, employing metal-organic frameworks (MOFs) as versatile nanofillers would notably broaden the scope of functionalities. However, synthesizing MOFs in the form of freestanding nanosheets has proved challenging. We present a bottom-up synthesis strategy for dispersible copper 1,4-benzenedicarboxylate MOF lamellae of micrometre lateral dimensions and nanometre thickness. Incorporating MOF nanosheets into polymer matrices endows the resultant composites with outstanding CO2 separation performance from CO2/CH4 gas mixtures, together with an unusual and highly desired increase in the separation selectivity with pressure. As revealed by tomographic focused ion beam scanning electron microscopy, the unique separation behaviour stems from a superior occupation of the membrane cross-section by the MOF nanosheets as compared with isotropic crystals, which improves the efficiency of molecular discrimination and eliminates unselective permeation pathways. This approach opens the door to ultrathin MOF-polymer composites for various applications.


Figures

Figure 1
Figure 1. Synthesis and structure of metal-organic framework nanostructures
a, 3D crystalline structure of CuBDC MOF. Copper, oxygen and carbon atoms are shown in blue, red and grey respectively. The insets on the right hand side display views along the b (top) and c (bottom) crystallographic axis showing the stacking direction and the pore system, respectively. Hydrogen atoms and N,N,-dimethylformamide solvate molecules coordinated to Cu2+ ions have been omitted for clarity. b, Scanning electron micrograph of bulk-type CuBDC MOF crystals. c, Picture showing the spatial arrangement of different liquid layers during the synthesis of CuBDC MOF nanosheets. Layers labeled as i, ii, and iii correspond to a benzene 1,4-dicarboxylic acid (BDCA) solution, the solvent spacer layer and the solution of Cu2+ ions, respectively. To enhance visualization, 2-amino 1,4-benzenedicarboxylic acid, which shows a yellow color shade, has been employed as phase i to produce the illustrative picture presented. A close-up schematic representation of the concentration gradients established for Cu2+ and linker precursors at the spacer layer is also depicted. d, X-ray diffractograms (CuKα radiation) for bulk-type and nanosheet CuBDC metal-organic-framework. Panels e and f, show a scanning electron micrograph and an atomic-force micrograph (with corresponding height profiles), respectively, for CuBDC MOF nanosheets synthesized as illustrated in panel c.
Figure 2
Figure 2. Versatility and scope of the three-layer synthesis strategy to produce two-dimensional MOF nanocrystals
a-d, Scanning electron microscopy (SEM) images of CuBDC crystals synthesized via the three-layer approach at a, 298 K, b, 313 K, c, 323 K and d, 333 K. e-h, SEM micrographs of two-dimensional crystals obtained by extending the same synthesis strategy to other metal-organic-frameworks, i.e. e, cobalt 1,4-benzenedicarboxylate or CoBDC, f, zinc 1,4-benzenedicarboxylate or ZnBDC, g, copper 1,4-naphthalenedicarboxylate or Cu(1,4-NDC) and h, copper 2,6-naphthalenedicarboxylate or Cu(2,6-NDC). Insets in panels e-h display the corresponding X-ray diffractograms recorded for the 2D MOF crystals.
Figure 3
Figure 3. Sorption properties of CuBDC MOF crystals
a, N2 sorption isotherms at 77 K; b, CO2 (circles) and CH4 (diamonds) sorption isotherms at 273 K; for bulk-like (red) and nanosheet (blue) CuBDC crystals after washing and evacuation at 453 K. The inset to panel a shows the Ar sorption isotherm at 87 K for the nanosheet crystals. Open symbols correspond to adsorption branches while closed symbols correspond to desorption branches.
Figure 4
Figure 4. Tomographic FIB-SEM analysis of MOF-polymer composite membranes
a, Overview scanning electron micrograph of the trench carved with a focused-ion-beam (FIB) on the surface of an 8 wt.% MOF-polymer composite membrane. The yellow frame indicates a central region within the imaged cross-section, which was selected for further analysis. b,c, Representative SEM micrographs of cross-sections of composite membranes containing bulk-type (b) and nanosheet (c) CuBDC metal-organic-framework embedded in polyimide. MOF species appear as bright motifs on the dark grey polymer matrix. Cubic MOF crystals are perceived in panel b, while ultrathin MOF nanosheets are evident in panel c. d, Orthogonal cross-sections through the 3D reconstructed FIB-SEM tomogram of a MOF-polymer composite. e,f, Surface-rendered views of the segmented FIB-SEM tomograms for composite membranes containing bulk-type (e) and nanosheet (f) CuBDC metal-organic-framework embedded in polyimide. MOF particles are displayed in blue, while voids are represented in red. Given the different magnification required to image the features of interest for different composite membranes, the dimensions of the boxes shown in panels e and f along the x:y:z directions are 11.2:11.2:7.6 and 4.9:4.9:6.6 μm, respectively.
Figure 5
Figure 5. Image analysis of FIB-SEM tomograms for MOF-polymer composite membranes
Full projections along the y-direction of the reconstructed volumes (a,c) and evolution of the coverage of the membrane xz cross-section by MOF particles, (b,d) for composite membranes containing bulk-type (a,b) and nanosheet (c,d) CuBDC metal-organic-framework embedded in polyimide. In panels a and c, the MOF particles are depicted partially transparent to better perceive overlaps in the direction of the projection. Error bars in panels b and d correspond to the standard deviation (%). e, Angular histogram showing the orientation of MOF lamellae with respect to the gas flux direction (y axis) for a composite material containing MOF nanosheets embedded in polyimide. f, Histogram of the efficiency with which the individual MOF nanosheets cover the membrane cross-section, defined as the ratio between the area of the MOF lamellae (Alam) and that projected on the plane perpendicular to the gas flux (Aproj), as schematically depicted in the inset to the panel. In the same inset figure, α represents the angle of inclination of each MOF lamellae with respect to the y-axis. Green bars correspond to experimental data while the red line shows the exponential fit. See experimental methods in the Supplementary Information for more details on the tomogram image analysis procedures.
Figure 6
Figure 6. Application of the MOF-polymer composites in a gas separation process
Separation selectivity, defined as the ratio between the permeability of CO2 and CH4, as a function of the pressure difference over the membrane for the MOF-polymer composites when employed as membranes in the separation of CO2 from an equimolar CO2/CH4 mixture at 298 K. For comparison purposes, results for a neat polyimide membrane (PI) are also presented. The data correspond to steady operation conditions, after at least 8 hours on stream. CO2 permeabilities spanned in the range of 2.8-5.8 Barrer, while CH4 permeabilities were lower than 0.3 Barrer in all cases (see Supplementary Table S1). 1 Barrer = 10−10 cm3 (STP) cm−1 s−1 cmHg−1. Error bars correspond to the standard deviations, as determined from three independent tests with selected membranes. When not displayed, error bars are smaller than the symbols.

References

    1. Stankovich S, et al. Graphene-based composite materials. Nature. 2006;442:282–286. - PubMed
    1. Wang QH, Kalantar-Zadeh K, Kis A, Coleman JN, Strano MS. Electronics and optoelectronics of two-dimensional transition metal dichalcogenides. Nat Nanotechnol. 2012;7:699–712. - PubMed
    1. Choi S, et al. Layered silicates by swelling of AMH-3 and nanocomposite membranes. Angew. Chem. Int. Ed. Engl. 2008;47:552–555. - PubMed
    1. Varoon K, et al. Dispersible exfoliated zeolite nanosheets and their application as a selective membrane. Science. 2011;334:72–75. - PubMed
    1. Corma A, Fornes V, Pergher SB, Maesen Th. L. M., Buglass JG. Delaminated zeolite precursors as selective acidic catalysts. Nature. 1998;396:353–356.