. 2014 Dec;17(12):1776-83.
doi: 10.1038/nn.3855. Epub 2014 Nov 2.

Novel domain formation reveals proto-architecture in inferotemporal cortex

Affiliations

Novel domain formation reveals proto-architecture in inferotemporal cortex

Krishna Srihasam et al. Nat Neurosci. 2014 Dec.

Abstract

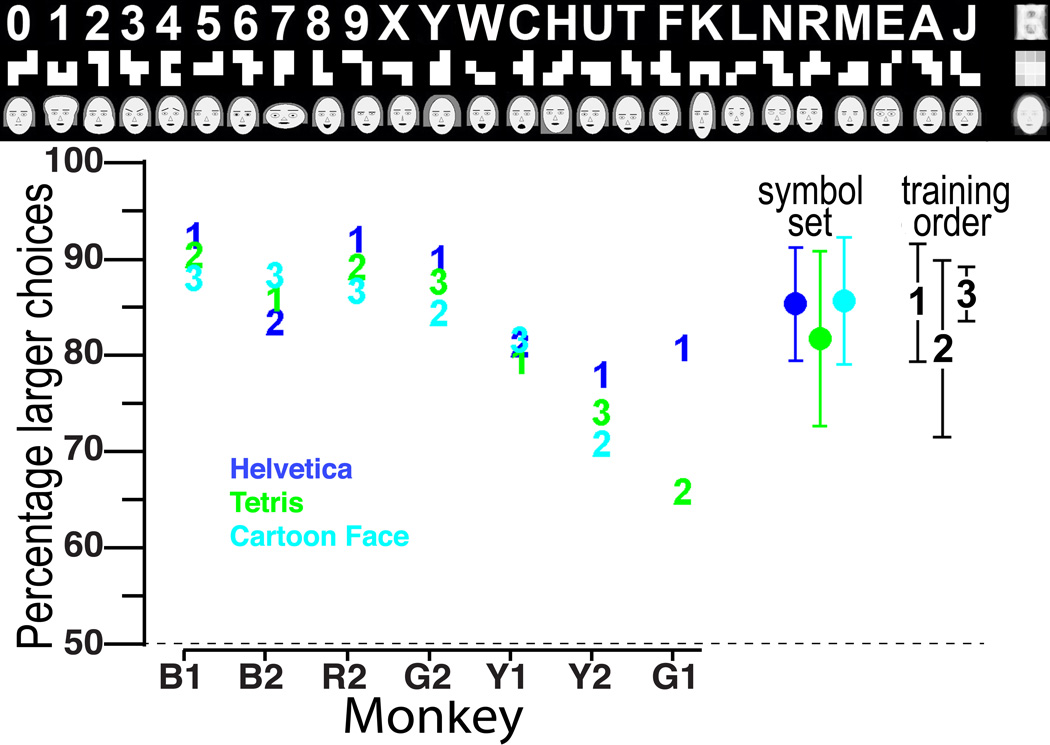
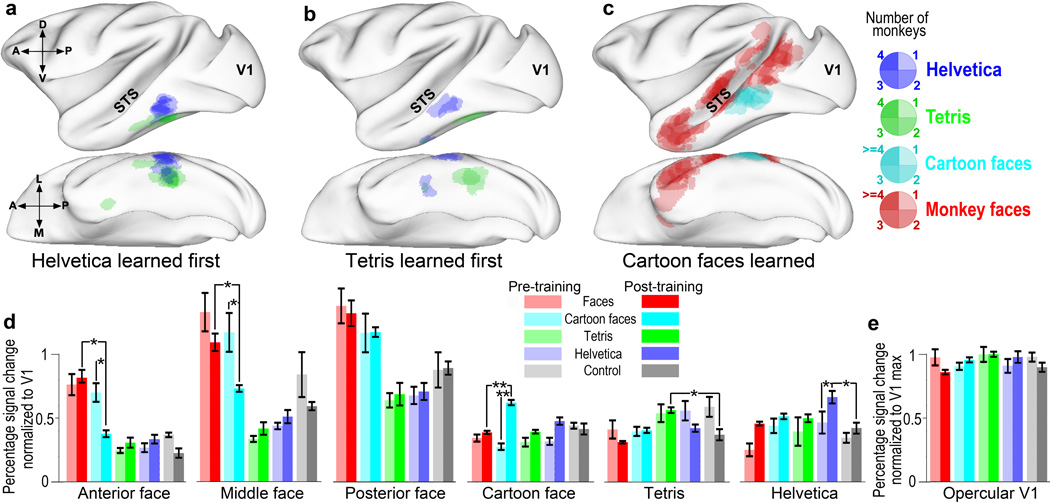
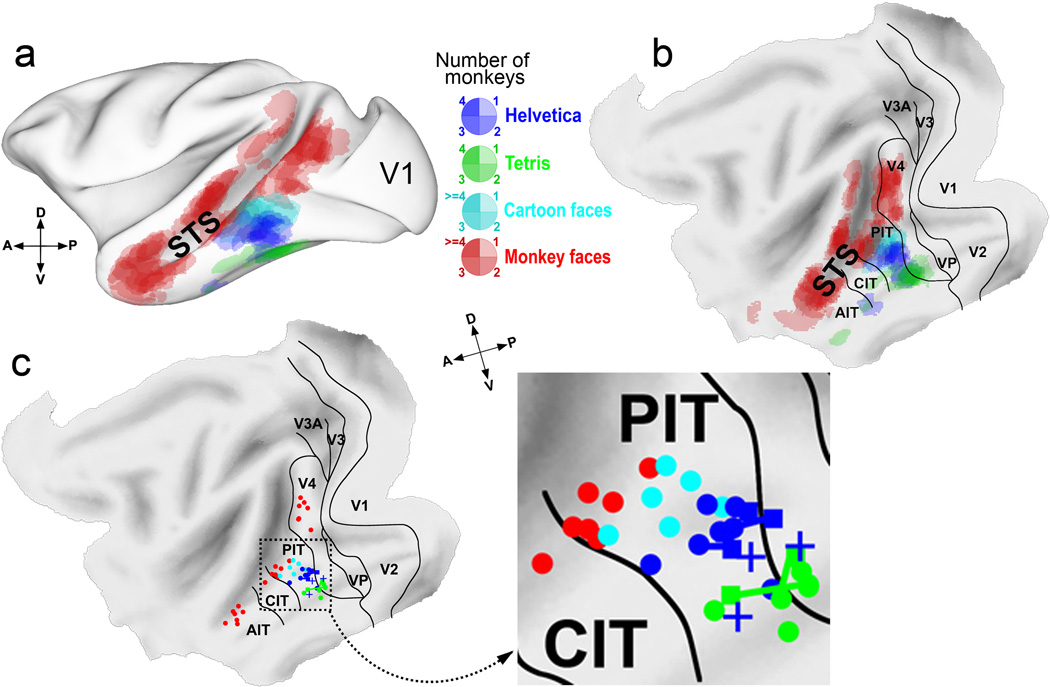
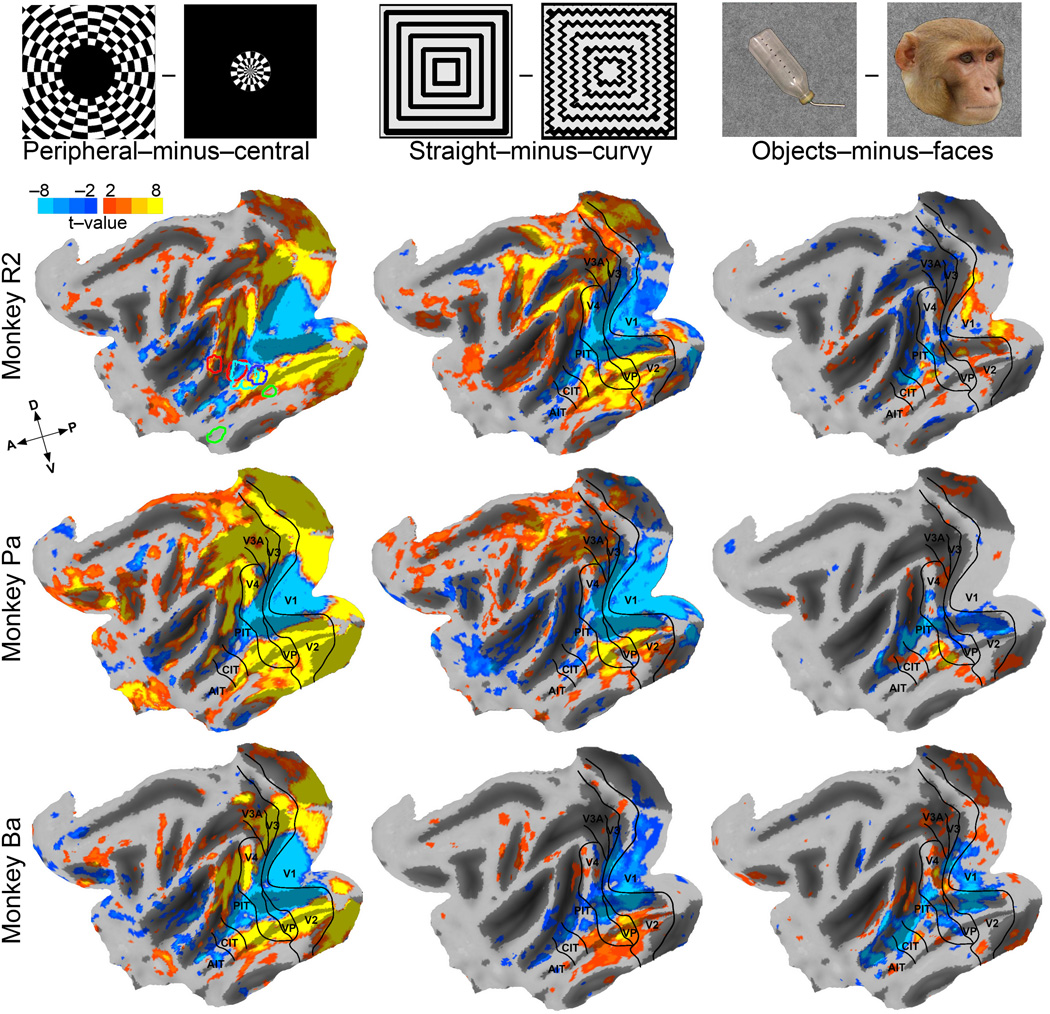
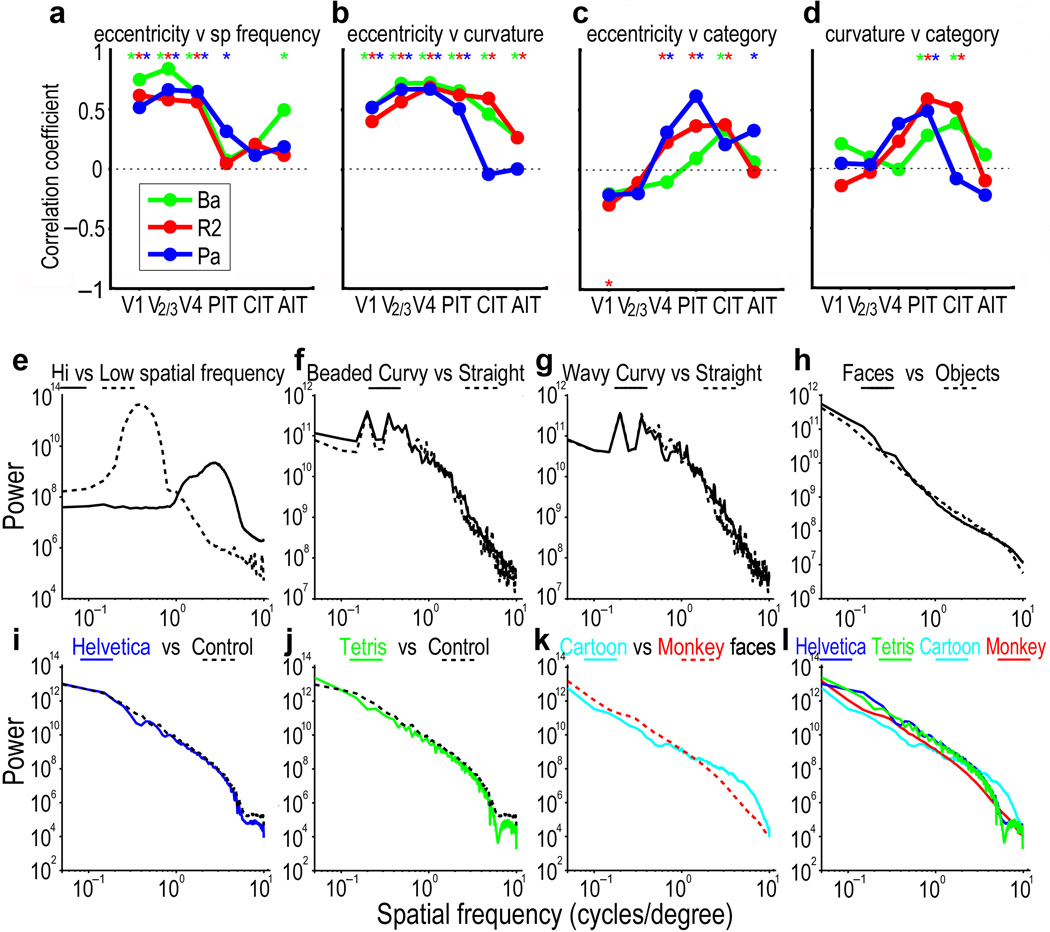
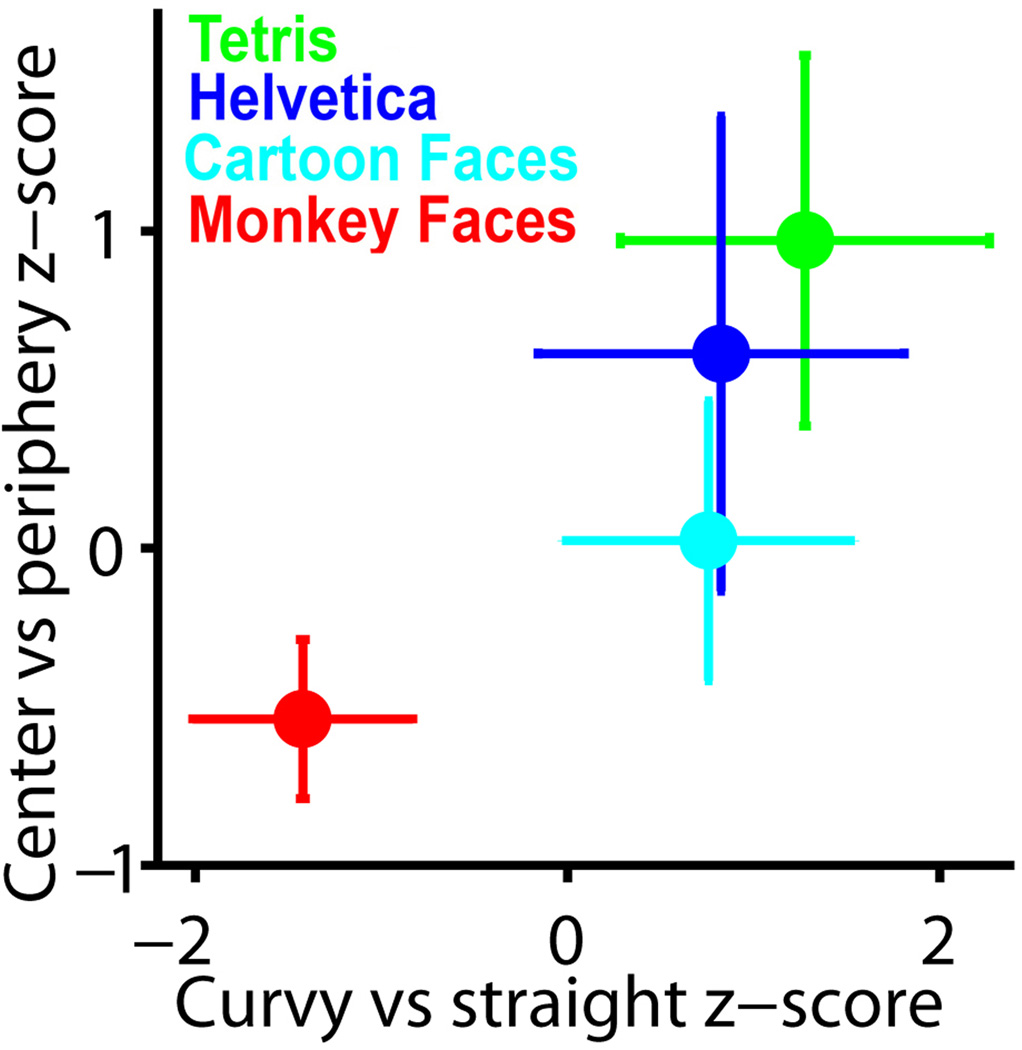
Primate inferotemporal cortex is subdivided into domains for biologically important categories, such as faces, bodies and scenes, as well as domains for culturally entrained categories, such as text or buildings. These domains are in stereotyped locations in most humans and monkeys. To ask what determines the locations of such domains, we intensively trained seven juvenile monkeys to recognize three distinct sets of shapes. After training, the monkeys developed regions that were selectively responsive to each trained set. The location of each specialization was similar across monkeys, despite differences in training order. This indicates that the location of training effects does not depend on function or expertise, but rather on some kind of proto-organization. We explore the possibility that this proto-organization is retinotopic or shape-based.


Figures

Fig. 1
Fig. 1
Symbol set learning: (top) The 3 different symbol sets: Helvetica, Tetris, and Cartoon face. Each symbol in each set represents, in order, 0 to 25 drops of liquid reward. At the far right of each symbol set is an image average of all the symbols in each set. (bottom) Percent larger choices averaged over 1 month of daily testing for each monkey (horizontal axis) for each symbol set (indicated by color); chance = 50%. Numerals 1–3 indicate the order in which the 3 symbol sets were learned by each monkey. To the right are shown the % larger choices±sem for each symbol set averaged over all monkeys who learned each set, and the average % larger choices±sem for the first, second, and third learned sets. We found a negative correlation between the size of each symbol set patch and each monkey’s performance on that symbol set, but this correlation was not significant [Pearson’s Linear correlation coefficient r= −0.3828; p = 0.1057]. We found no correlation between the average significance value of a particular patch and the monkey’s performance [Pearson’s Linear correlation coefficient r= 0.0196; p = 0.9366)].
Fig. 2
Fig. 2
Effects of training on functional organization of IT. (a–c) Each panel shows overlaid activations from each monkey (collapsed across hemispheres; see Methods) aligned onto a lateral and a ventral view of a standard macaque brain,; the major landmarks of the superior temporal sulcus (STS) and V1 are indicated. Each of the overlaid patches represents a region from a single monkey that was significantly more active to one set of images than to control blocks; the patches are transparent so the overlap among different monkeys can be seen, as indicated by the scale. Activations for individual monkeys are shown in Figs. S3–S10. (a) Overlaid significant activations after training to Helvetica (blue) and Tetris (green) from monkeys who learned Helvetica before Tetris (B1, R2, G2, & G1). (b) Overlaid activations after training to Helvetica (blue) and Tetris (green) from the monkeys who learned Tetris before Helvetica (B2 & Y1). (c) Overlaid activations to monkey faces > Tetris AND monkey faces>Helvetica (red) before Cartoon Face training and to Cartoon Faces>monkey faces (cyan) after Cartoon face training from all the monkeys who learned Cartoon Faces (B1, B2, R2, G2, Y1 & Y2). (d) Pre-training vs Post-training responsiveness. Average percent signal change for each image category before and after training was normalized to the response in V1 to that same image set from the same data. Monkey face responsiveness was calculated before and after Cartoon face training. Bars represent mean ± sem of values averaged over monkeys; single asterisks indicate means that differ at p<0.05; double asterisks indicate p<0.01. (e) Average percent signal change in opercular V1 to the same image sets, from the same scan sessions, normalized to the maximum V1 activation among image categories. A 2×2 ANOVA for trained set vs control × pre- vs. post-training was calculated for each trained-set ROI. Main effects of trained vs control were found in all the trained-symbol patches [Helvetica Patch [F(1,4) = 3.55, p <0.05; Tetris Patch [F(1,4) = 8.6, p<0.01, Cartoon Face patch: F(1,4)=2.17, p<0.05]. Main effects of training were also found in all the patches [Helvetica Patch [F(1,1) = 79.42, p<0.01; Tetris Patch [F(1,1) = 2.7, p <0.05, Cartoon Face patch: F(1,1)=19.29, p<0.01]. Critically, a robust interaction between trained vs control and pre- vs post-training was observed in all ROIs [Helvetica Patch [F(1,4) = 9.88, p<0.01; Tetris Patch [F(1,4) = 6.91, p <0.01, Cartoon Face patch: F(1,4)=5.07, p<0.01]. Hypothesis-driven tests indicated that the all of the training-induced patches were significantly more activated by their trained stimulus category compared to controls after training [Helvetica patch: t(12) = 2.188, p< 0.05; Tetris patch: t(12) = 2.74, p< 0.05; Cartoon Face Patch t(12)= −3.97 p<0.001], but none of the ROIs showed significant differences between their preferred stimulus category and controls prior to training (all, p > 0.05). The pattern of results in the Cartoon Face and Helvetica regions showed a larger response to the trained stimuli post- compared to pre-training [Cartoon Face Patch t(12)= −4.97 p<0.001; Helvetica Patch t(12)= −3.10 p<0.01], and no change in response to control stimuli. The Tetris patch developed a post-training selectivity to Tetris via reduced responsiveness to controls after training [t(12)= −2.60 p=0.02], but no significant change in responsiveness to Tetris. There was no significant difference between monkey faces and cartoon faces pre-training any of the face patches (Ps > 0.05), but post-training, there was a significantly smaller response to cartoon faces vs. monkey faces in the Anterior [t(12)=2.45 p<0.05] and Middle Faces Patches [t(12)=2.19, p < 0.05].
Fig. 3
Fig. 3
Overall organization of selective responsiveness to trained symbol sets and face patches in 7 monkeys. (a) Patches of significant activations for all 3 symbol sets and monkey faces (each contrasted with its control) from each of the 7 multiple-symbol-set trained monkeys projected onto a standard macaque brain shown in a semi-inflated lateral view. (b) Same data shown on a flattened standard map of macaque cortex with areal borders. (c) Centers of mass for different selective patches. Dots indicate the center of mass of each of the 3 major monkey faces>shapes patches and each of the trained-symbol selective patches, indicated by color, in the monkeys trained in this and our previous study. For monkeys who learned both Helvetica and Tetris, the squares indicate centers of the first-learned symbol set region immediately after learning that symbol set, and circles indicate centers of the same, first-trained, symbol set, but after learning the second symbol set; the two patches for the first-learned symbol set for each monkey are linked by a line of the same color. +’s indicate the centers of the Helvetica patches for the 3 monkeys from our previous study that were trained as juveniles on Helvetica only. By inspection, the centers of Helvetica patches in Helvetica-first trained monkeys shifted slightly dorsal (away from the Tetris location) after Tetris training, and the Tetris patch centers in the two Tetris-first trained monkeys moved slightly ventral (away from the Helvetica location) after Helvetica training. The indicated dorso-ventral and antero-posterior axes for the flat maps are meaningful only for the lateral surface of the brain.
Fig. 4
Fig. 4
Maps of Eccentricity bias, Curvature, and Category selectivity in 3 monkeys, as indicated. T-score maps were averaged over both hemispheres of each monkey for the 3 contrasts indicated and aligned onto a standard macaque brain, that was then computationally flattened. Light gray areas represent gyri and dark gray sulci. Representative images from the sets used to generate these contrast maps are shown at the top of each column; image sets are shown in Fig. S2. Visual areal borders are indicated. Outlines of R2’s Cartoon face (cyan), Helvetica (blue), Tetris (green), and middle face (red) patches are overlaid on his eccentricity map.
Fig. 5
Fig. 5
Relationship between eccentricity, spatial frequency, curvature and category. (a–d) Voxel-wise correlations between pairs of contrast maps for visual areas V1, V2&V3, V4, PIT, CIT, and AIT from 3 monkeys (Ba, R2, & Pa); the correlations are calculated between the contrast maps in Fig. 4, with the addition of a map for low-spatial frequency minus high-spatial frequency patterns for the same 3 monkeys (stimuli shown in Fig. S2; maps for spatial frequency in Fig. S11). Dotted line indicates zero correlation. Asterisks at the top indicate correlations that were significantly greater than zero at p<0.05; the asterisk at the bottom of the 3rd map indicates a correlation that was significantly less than zero at p<0.05. The contrast maps used for this analysis were Eccentricity: 4–10° patterns minus 0–3° patterns; Spatial Frequency: 0.4 cpd patterns minus 2.5 cpd patterns; Curvature: straight minus curvy patterns; Category: objects minus faces. (e–l) Spatial frequency power spectra, averaged over each stimulus set, as indicated.
Fig. 6
Fig. 6
Average z-scores for eccentricity (peripheral-minus-central) and curvature (straight-minus-curvy) contrasts for Monkey face, Cartoon face, Helvetica, and Tetris ROIs combined across monkeys Y1, Y2, B1 and R2; values are mean across monkeys ±sem. Plots for individual monkeys are shown in Fig. S12.

Comment in

  • Cortical geography is destiny.
    Connor CE. Connor CE. Nat Neurosci. 2014 Dec;17(12):1631-2. doi: 10.1038/nn.3877. Nat Neurosci. 2014. PMID: 25413088 No abstract available.

References

Literature cited

    1. Halgren E, Dale AM, Sereno MI, Tootell RB, Marinkovic K, Rosen BR. Location of human face-selective cortex with respect to retinotopic areas. Hum Brain Mapp. 1999;7:29–37. - PMC - PubMed
    1. Tsao DY, Freiwald WA, Knutsen TA, Mandeville JB, Tootell RB. Faces and objects in macaque cerebral cortex. Nat Neurosci. 2003;6:989–995. - PMC - PubMed
    1. Shapiro PN, Penod SD. Psychological Bulletin. 1986;100:139–156.
    1. Gogtay N, Giedd JN, Lusk L, Hayashi KM, Greenstein D, Vaituzis AC, Nugent TF, 3rd, Herman DH, Clasen LS, Toga AW, Rapoport JL, Thompson PM. Dynamic mapping of human cortical development during childhood through early adulthood. Proc Natl Acad Sci U S A. 2004;101:8174–8179. 419576. - PMC - PubMed
    1. Golarai G, Liberman A, Yoon JM, Grill-Spector K. Differential development of the ventral visual cortex extends through adolescence. Front Hum Neurosci. 2010;3:80. 2831628. - PMC - PubMed

References for Methods

    1. Srihasam K, Sullivan K, Savage T, Livingstone MS. Noninvasive functional MRI in alert monkeys. Neuroimage. 2010;51:267–273. 2847050. - PMC - PubMed
    1. Leite FP, Tsao D, Vanduffel W, Fize D, Sasaki Y, Wald LL, Dale AM, Kwong KK, Orban GA, Rosen BR, Tootell RB, Mandeville JB. Repeated fMRI using iron oxide contrast agent in awake, behaving macaques at 3 Tesla. Neuroimage. 2002;16:283–294. - PubMed
    1. Cox R. AFNI: Software for analysis and visualization of functional magnetic resonance neuroimages. Computers and Biomedical Research. 1996;29:162–173. - PubMed

Publication types