. 2014 Dec;46(12):1363-1371.
doi: 10.1038/ng.3138. Epub 2014 Nov 2.

A multiscale statistical mechanical framework integrates biophysical and genomic data to assemble cancer networks

Affiliations

A multiscale statistical mechanical framework integrates biophysical and genomic data to assemble cancer networks

Mohammed AlQuraishi et al. Nat Genet. 2014 Dec.

Abstract

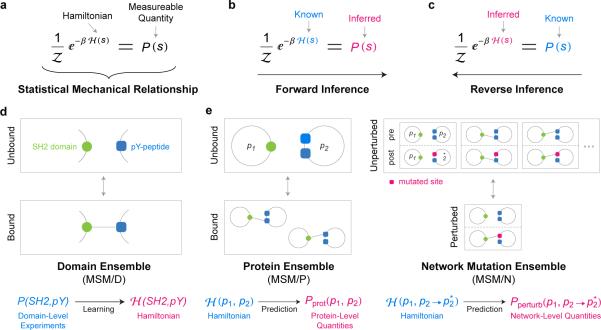
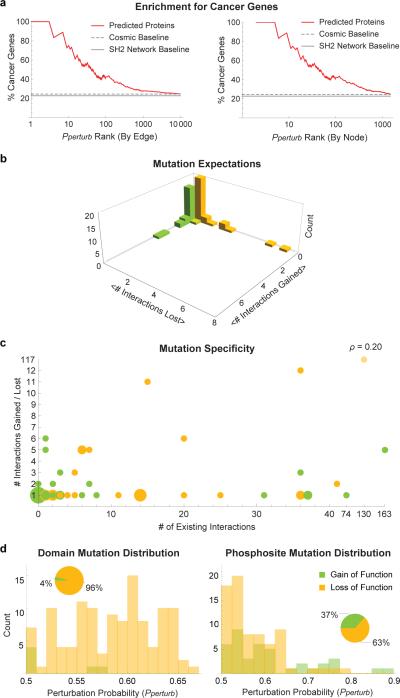
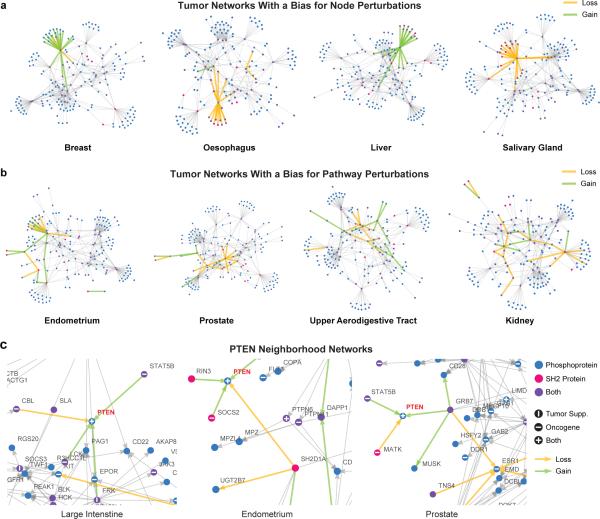
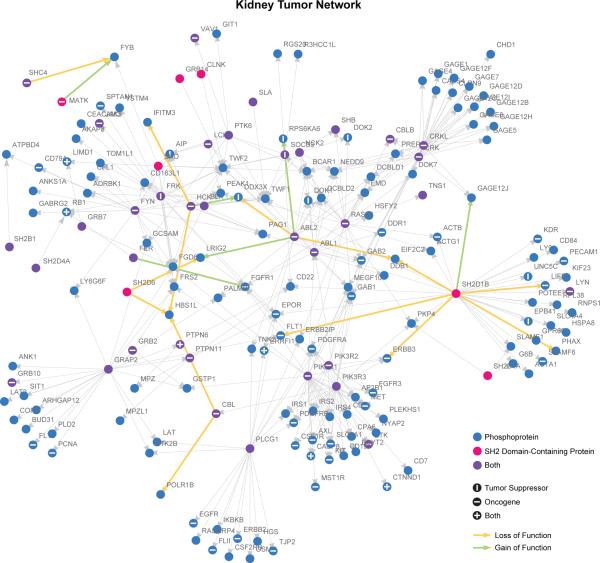
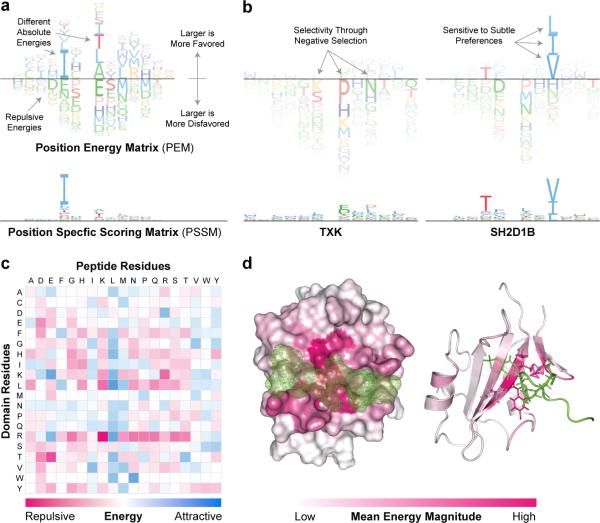
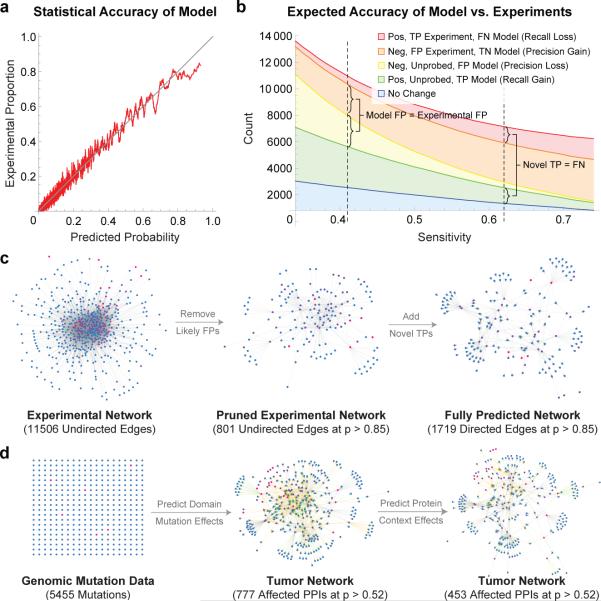
Functional interpretation of genomic variation is critical to understanding human disease, but it remains difficult to predict the effects of specific mutations on protein interaction networks and the phenotypes they regulate. We describe an analytical framework based on multiscale statistical mechanics that integrates genomic and biophysical data to model the human SH2-phosphoprotein network in normal and cancer cells. We apply our approach to data in The Cancer Genome Atlas (TCGA) and test model predictions experimentally. We find that mutations mapping to phosphoproteins often create new interactions but that mutations altering SH2 domains result almost exclusively in loss of interactions. Some of these mutations eliminate all interactions, but many cause more selective loss, thereby rewiring specific edges in highly connected subnetworks. Moreover, idiosyncratic mutations appear to be as functionally consequential as recurrent mutations. By synthesizing genomic, structural and biochemical data, our framework represents a new approach to the interpretation of genetic variation.


Figures

Figure 1
Figure 1
Multiscale Statistical Mechanical Framework. (a) Statistical mechanics establishes mathematical relationships between the energy of a state s of a system, known as the Hamiltonian H(s), and measurable thermodynamic quantities of that state, such as its probability of occurrence P(s). (b) In simple physical systems, the Hamiltonian is known, and the mathematics of statistical mechanics can be directly used to infer thermodynamic quantities. (c) Experimental data on thermodynamic quantities can be used in the reverse direction to infer the Hamiltonian (more precisely, a pseudo-Hamiltonian) using machine learning techniques. (d) In MSM, learning of the Hamiltonian is performed at the single domain level (MSM/D), by creating ensembles that correspond to bound and unbound SH2/pY-peptide complexes. (e) The learned Hamiltonian can be used to make predictions for more complex ensembles. At the whole protein level (MSM/P), ensembles comprise all physical binding configurations, accounting for the combinatorics of multiple domains and multiple phosphorylation sites. At the network and mutation level (MSM/N), ensembles comprise states that simultaneously represent the behavior of the PPI before and after a mutation is introduced. This selectively captures mutations that result in consequential changes to binding affinity (see Main Text, Supplementary Fig. 1, and Supplementary Note for more details).
Figure 2
Figure 2
Assessment of Domain Model (MSM/D) Performance. (a) Receiver-Operator Characteristic (ROC) curves assessing the performance of MSM/D and other methods (SMALI, PEPINT, and PrePPI) in predicting the binding states of SH2-phosphopeptide interactions. ROC curves characterize a model's ability to predict SH2/pY-peptide interactions by computing the true positive rate (TPR) of predictions as a function of the false positive rate (FPR). A method that makes random guesses will produce a straight line with a slope of 1 (dashed black line) whereas a perfect method produces a constant TPR value of 1 (dotted black line). Tests were performed on the combined dataset (All) and a high-confidence subset (HC2). (b) A close up view of (a), showing the relative performance of high-throughput datasets. (c) The Areas Under the Curve (AUCs) of MSM/D on predicting held out SH2 domains are plotted as a function of the domains’ sequence identity to the closest homolog in the training set. A histogram of AUC values is overlaid on the y-axis.
Figure 3
Figure 3
Experimental Validation of Wild-type and Mutated Protein Level Interactions. (a) Quantitative co-immunoprecipitation signals of GCSAM to partner proteins show excellent experimental reproducibility (ρ = 0.99) and a high correlation with MSM/P predictions (ρ = 0.80). (b) A1346V mutated IGF1R exhibits higher affinity to the PIK3R1-N, PIK3R1-C, and PIK3R1-NC SH2 domains (p = 6.2 × 10⁻⁵, p = 9.0 × 10⁻³, and p = 5.9 × 10⁻⁵, respectively, using one-sided T-test) as predicted by MSM/P. Error bars represent the standard error of five biological replicates.
Figure 4
Figure 4
Enrichment and Analysis of Cancer Mutations. (a) The percentage of genes already known to be involved in cancer (as oncogenes or tumor suppressors) are plotted as a function of their ranking by the model (Pperturb). Rankings were done based on edges (top) and nodes (bottom). (b) Histogram of the expected values (per mutation) of lost and gained interactions. (c) Bubble chart depicting number of interactions gained or lost in a mutation as a function of the number of wild-type interaction partners of the mutated protein (circle size indicates number of mutations with the same profile). One mutation was removed when calculating correlation (faint yellow circle). (d) Distributions of Pperturb values for SH2 proteins and phosphoproteins broken down by gain of function (yellow) and loss of function (orange) mutations.
Figure 5
Figure 5
Tissue-Specific Tumor Networks. (a) MSM/N predictions of top 20 interactions gained and lost (green and yellow edges, respectively) in four tumor networks overlaid on the wild-type SH2-phosphosignaling network (gray edges, each representing an interaction with p > 0.85 probability, as in Supplementary Fig. 4), showing a bias for the “node” mode of perturbations. (b) Four tumor networks that show a bias for the “pathway” mode of perturbations. (c) Local neighborhoods of the PTEN network in different cancer tissue types. All networks were generated using a spring-electrical embedding in the Mathematica software package.
Figure 6
Figure 6
Kidney Tumor Network. MSM/N predictions of top 20 perturbed interactions (green and yellow arrows) in kidney cancer overlaid on wild-type SH2-phosphosignaling network (gray edges, each representing an interaction with p > 0.85 probability, as in Supplementary Fig. 4). Networks were generated using a spring-electrical embedding in the Mathematica software package.
Figure 7
Figure 7
PEMs Capture the Biophysical Basis of SH2 Domain Specificity. (a) PEM representation. Amino acids exhibiting attractive interactions lie above the dividing line whereas amino acids involving repulsive interactions lie below, with the height of the residue corresponding to the magnitude of the interaction energy. PEMs capture the effects of negative selectivity and differential energy contributions at different residue positions. (b) PEM for the domain SH2D1B shows that a tyrosine at position −2 (relative to the pY site) contributes less to affinity than a leucine or isoleucine at position +3. In the PSSM the situation is reversed, because the PSSM representation forces each position to contribute equally to the total probability which causes the dominant valine at position +3 to appear more important than it is in terms of actual energetics. Negative selectivity is also readily evident using PEMs: in the case of the SH2 domain TXK specificity involves repulsive interactions, specifically proline, asparagine, and lysine at positions +1, +3, and −1, respectively. These effects on selectivity cannot be discerned from the corresponding PSSM. (c) Heatmap of pairwise amino acid interaction energies at the SH2-phosphopeptide interface as derived from MSM/D. Instances of strong negative energies (bright pink) correspond to electrostatic repulsion (e.g. R and K) whereas positive energies (bright blue) are electrostatically complementary (e.g. R and D) or involve buried hydrophobic amino acids (e.g. L and L). (d) Heatmap of the average magnitude of interaction energies per residue position projected onto a structural representative of SH2 domains (white) in complex with phosphopeptide (green) (accession code: 1JU5).
Figure 8
Figure 8
Model Enriches High-Throughput Experiments. (a) SH2/pY-peptide interactions were rank-ordered by their predicted interaction probability and binned into overlapping windows. The average probability within each bin (x-axis) is plotted against the proportion of experimental positives in the same bin (y-axis). We found the agreement to be high, indicating that on a statistical level MSM/D can predict experimental accuracy. (b) Expected proportions of various outcomes (TP/TN/FP/FN) for model and experiment are plotted as a function of model sensitivity. Right dashed vertical line indicates a sensitivity level at which MSM/D is expected to predict as many new interactions (green) as it loses due to oversensitivity (red). At this threshold, MSM/D is expected to eliminate ~7 times more FPs than it adds (415 model FPs added vs. 2973 experimental FPs eliminated). Left dashed vertical line corresponds to a sensitivity at which MSM/D is expected to add the same number of FPs (yellow) as it eliminates (orange). At this threshold, MSM/D discovers ~5 times more TPs than it loses (3091 model TPs added vs. 614 experimental TPs lost). (c) Model predictions can be used as quality indicators to enrich HT experiments for TPs by eliminating low probability interactions. Model predictions can also be used to add novel interactions that have not been experimentally probed. (d) Genomic mutation data only provides node-level information (i.e. which gene is mutated). Model converts node-level mutation information into edge-level perturbations, and integrates the known or predicted PPI network to model the buffering effects of multi-site proteins.

Comment in

References

    1. Lawrence MS, et al. Discovery and saturation analysis of cancer genes across 21 tumour types. Nature. 2014 doi:10.1038/nature12912. - PMC - PubMed
    1. Liu BA, Engelmann BW, Nash PD. High-throughput analysis of peptide-binding modules. Proteomics. 2012;12:1527–1546. - PMC - PubMed
    1. Ho Y, et al. Systematic identification of protein complexes in Saccharomyces cerevisiae by mass spectrometry. Nature. 2002;415:180–183. - PubMed
    1. Bader GD, Hogue CWV. Analyzing yeast protein–protein interaction data obtained from different sources. Nat. Biotechnol. 2002;2020:991, 991–997. - PubMed
    1. Gschwind A, Fischer OM, Ullrich A. The discovery of receptor tyrosine kinases: targets for cancer therapy. Nat. Rev. Cancer. 2004;4:361–370. - PubMed

Publication types

Substances

LinkOut - more resources