. 2014 Dec;15(12):1152-61.
doi: 10.1038/ni.3025. Epub 2014 Nov 2.

Autophagy is essential for effector CD8(+) T cell survival and memory formation

Affiliations

Autophagy is essential for effector CD8(+) T cell survival and memory formation

Xiaojin Xu et al. Nat Immunol. 2014 Dec.

Abstract

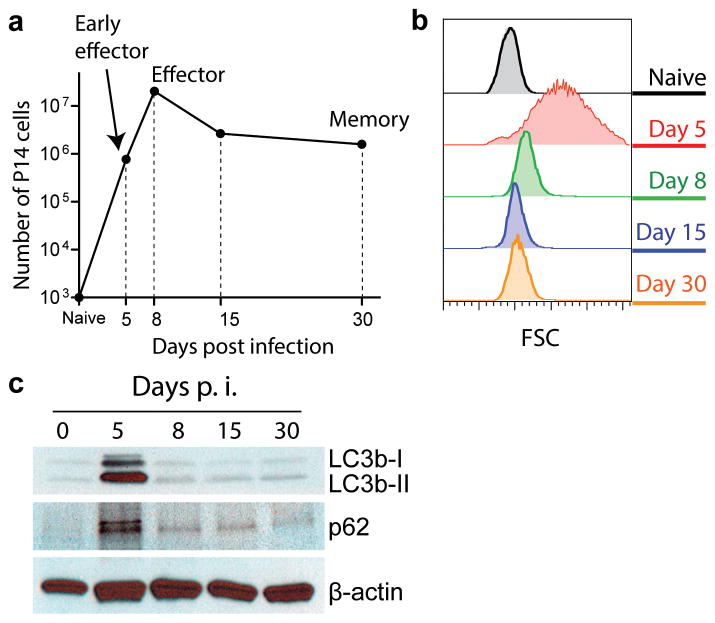
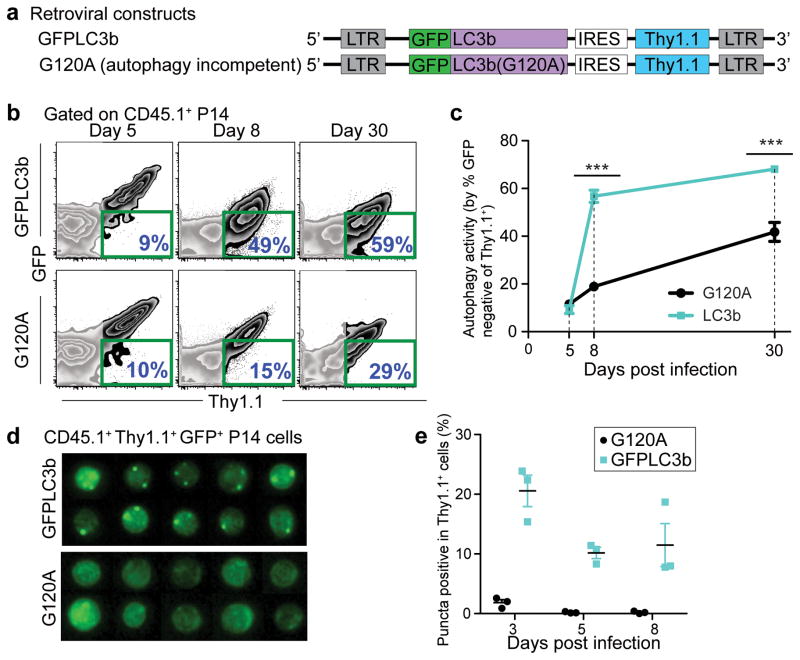
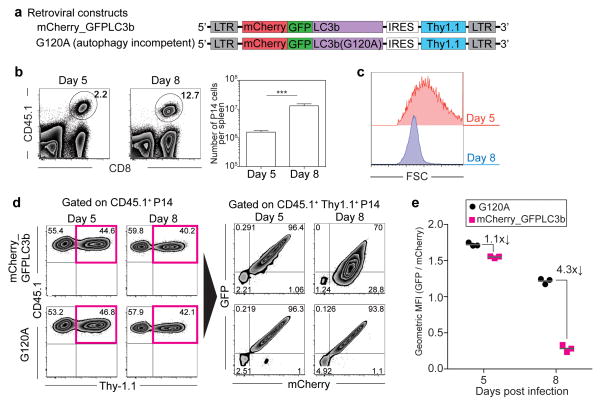
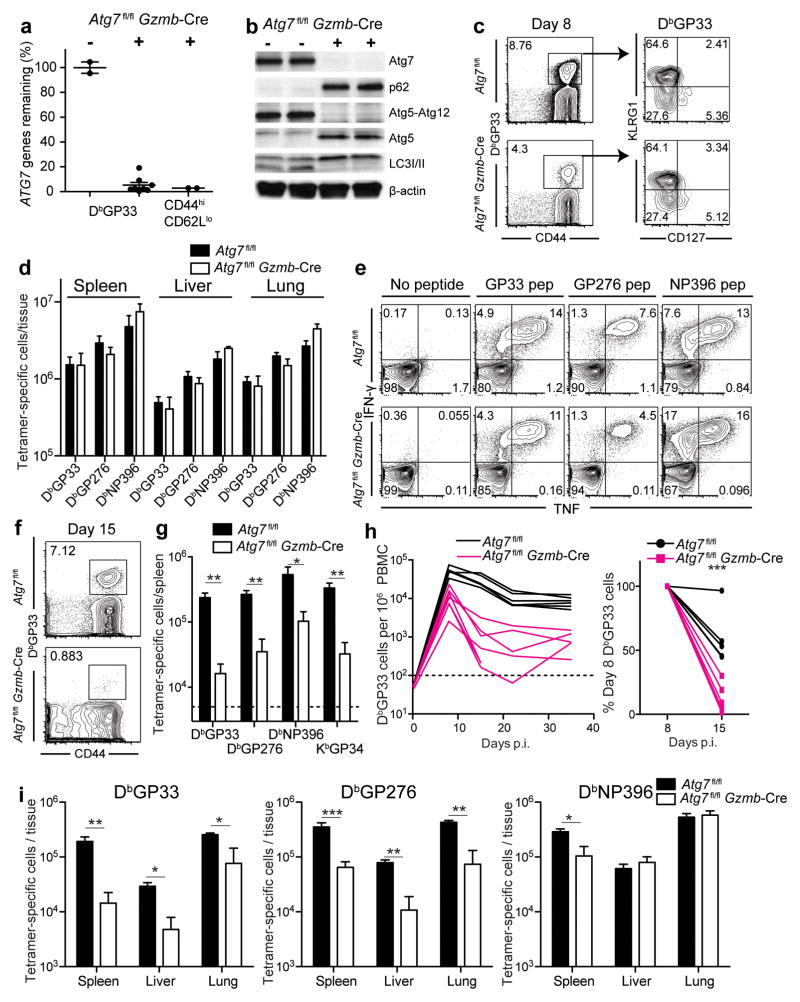
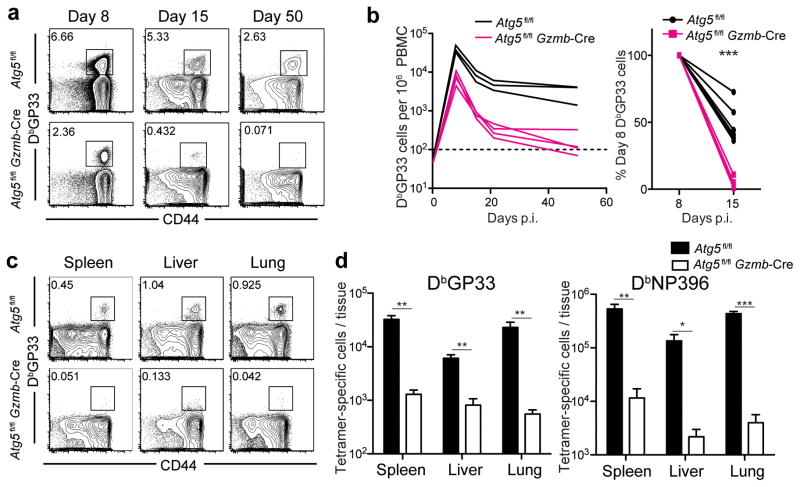
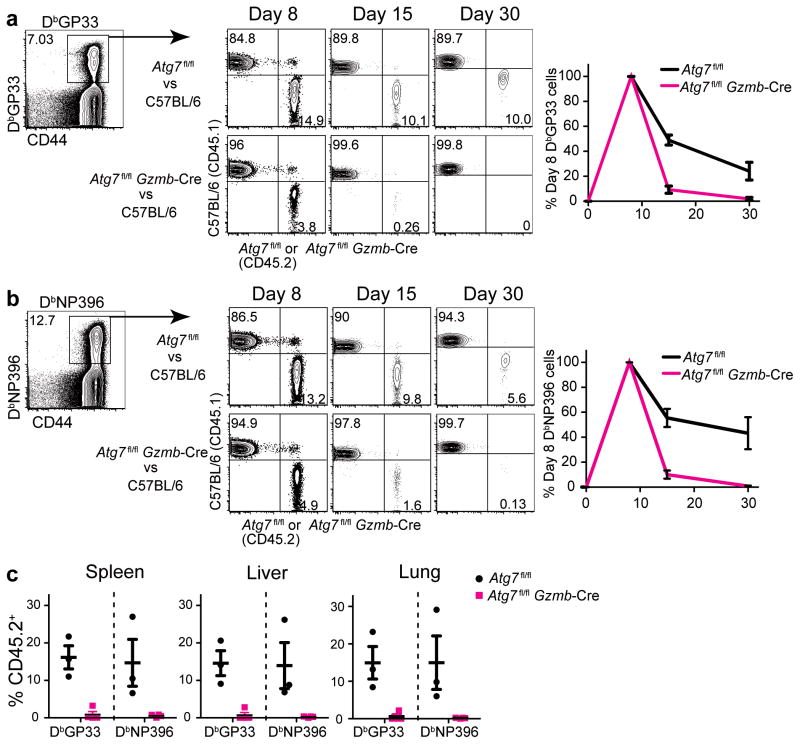
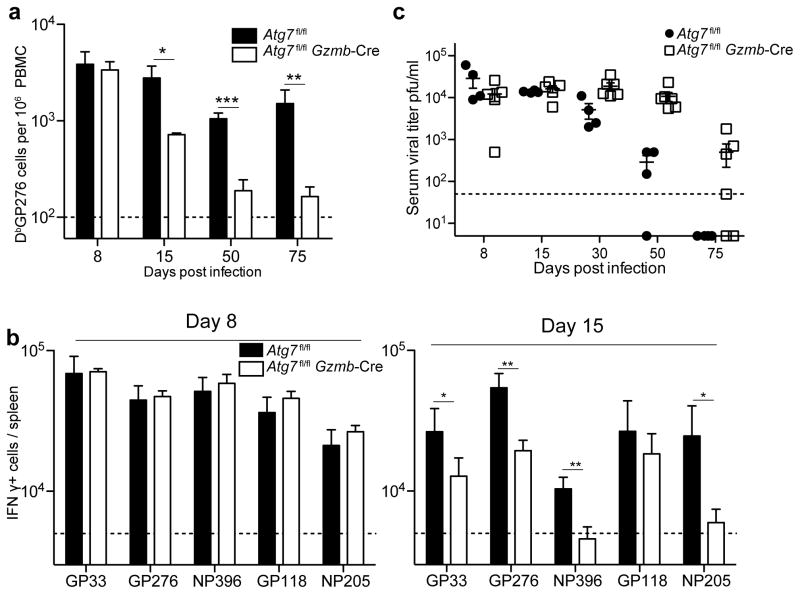
The importance of autophagy in the generation of memory CD8(+) T cells in vivo is not well defined. We report here that autophagy was dynamically regulated in virus-specific CD8(+) T cells during acute infection of mice with lymphocytic choriomeningitis virus. In contrast to the current paradigm, autophagy decreased in activated proliferating effector CD8(+) T cells and was then upregulated when the cells stopped dividing just before the contraction phase. Consistent with those findings, deletion of the gene encoding either of the autophagy-related molecules Atg5 or Atg7 had little to no effect on the proliferation and function of effector cells, but these autophagy-deficient effector cells had survival defects that resulted in compromised formation of memory T cells. Our studies define when autophagy is needed during effector and memory differentiation and warrant reexamination of the relationship between T cell activation and autophagy.


Conflict of interest statement

COMPETING FINANCIAL INTERESTS

The authors declare no competing financial interests.

Figures

FIGURE 1
FIGURE 1
Analysis of autophagy in virus-specific CD8 T cells during a viral infection. (a) Kinetics of P14 cells after LCMV Armstrong infection. 10,000 P14 cells were adoptively transferred into B6 mice and were tracked in spleens over the time course of LCMV Armstrong infection. (b) Flow cytometry histograms indicate cell size by showing forward scatters of P14 cells at different stages of differentiation as indicated. (c) Immunoblot data of LC3b and p62 at different stages of P14 differentiation. (a), (b) and (c) are representative of two independent experiments of samples pooled from 5–20 mice for each time point.
FIGURE 2
FIGURE 2
Autophagic flux in virus-specific CD8 T cells is inversely correlated with cell proliferation status. (a) MSCV retroviral constructs showing the transgenes (GFP-LC3b and GFP-LC3b-G120A) introduced in P14 cells to probe for autophagy activity. (b) Flow cytometry plots of adoptively transferred P14 cells in spleens. P14 cells transduced with retroviral plasmid of either MIT-GFP-LC3b or MIT-G120A are positive for the congenic marker Thy1.1. Day 5, 8 and 30 p.i. splenocytes were used for the analysis. The percentage of GFP-negative cells out of the transduced P14 (Thy1.1+) cells from each group is highlighted in blue on the lower right corner of each plot and is summarized in (c). (d) Representative ImageStream® data showing images of P14 cells from either GFP-LC3b or G120A groups on day 8 p.i.. Images showing GFP signals of GFP+ MIT vector-transduced P14 cells (Ly5.1+ Thy1.1+). Summary graph of ImageStream® analysis is plotted in (e) showing percentage of GFP+ or Thy1.1+ P14 cells that exhibited more than one GFP punctum. Errors bars represent SEM. (b) and (d) are representative of three independent experiments, n≥3 mice in each group.
FIGURE 3
FIGURE 3
Autophagic flux is inhibited during T cell clonal expansion phase via impairing autophagosome maturation into autophagolysosomes. (a) mCherry_GFP-LC3b MSCV constructs used in experiments. Retrovirus transduction of P14 cells were performed as shown in Supplementary Fig. 2a. (b) Representative flow cytometry plots of adoptively transferred P14 cells (CD45.1+) in spleens at days 5 and 8 post infection. Percentage of P14 cells in total splenocytes is shown. The right panel represents the average number of P14 cells per spleen. n=6 mice. Error bars indicate SEM. (c) Representative flow cytometry histograms indicate cell size (forward scatters) of P14 cells at days 5 and 8 post infection. (d) Retrovirus-transduction efficiency (CD45.1+ Thy-1.1+) is shown in the left panel. GFP expression is compared with mCherry expression in the right panel in retrovirus transduced P14 cells. Ratio of geometric mean fluorescence intensity (GFP/mCherry) summarized in (e). Data are representative of two independent experiments, n≥3 mice in each group.
FIGURE 4
FIGURE 4
Atg7 deficiency results in survival defects of the effector CD8 T cells during the effector to memory transition. Atg7fl/flGzmb-Cre and control mice were infected with LCMV Armstrong. (a) Genomic deletion of Atg7 in DbGP33+ T cells and in total activated CD8 T cells (CD44hiCD62Llo) day 8 p.i. Levels of Atg7 in WT mice were set to 100%. (b) Deletion of Atg7 protein and its enzymatic activities verified by Immunoblotting in CD44hiCD62Llo CD8 T cells isolated day 8 p.i. β-actin was used as a loading control. (c) DbGP33+ T cells in peripheral blood day 8 p.i.. The number represents the percentage of DbGP33+ T cells. Gated on CD8 T cells. Right, representative plots of DbGP33+ T cells showing terminal effector (KLRG1hi CD127lo) and memory precursor (KLRG1lo CD127hi) populations. (d) Total number of antigen-specific cells at day 8 p.i. (e) IFN-γ and TNF production at 8 days p.i. using ex vivo peptide stimulation. Gated on total CD8 T cells. (f) DbGP33+ T cells in peripheral blood day 15 p.i. The number indicates the DbGP33+ percentage of CD8 T cells. (g) Numbers of tetramer-positive cells in spleens day 15 p.i. (h) Kinetics of DbGP33+ CD8 T cells in peripheral blood following infection. Each line represents data from one experimental mouse. Plot on the right shows the percentage of DbGP33+ CD8 T cells remaining on day 15 relative to day 8. (i) Numbers of tetramer-positive cells at day 30 p.i. Errors bars in (a), (d), (g) and (i) indicate SEM. Data for (a) are pooled from two independent experiments and data for (c) to (i) are representative of at least two independent experiments. n=3–7 in each group. Horizontal dotted lines in (g) and (h) represent limit of detection. *, p≤0.05; **, p≤0.005; ***p≤0.0005.
FIGURE 5
FIGURE 5
Survival defects of Atg5-deficient T cells during the contraction phase following LCMV Armstrong infection. Atg5fl/flGzmb-Cre and control mice were infected with LCMV Armstrong. (a) Flow cytometric analysis of circulating LCMV-specific T cells in PBMC post-infection. The number on each plot indicates the percentage of CD8 T cells stained positive for DbGP33-tetramer from a representative mouse on days 8, 15 and 50. (b) Summary of the longitudinal kinetics of DbGP33-positive T cells in peripheral blood. Each line represents data from one experimental mouse. Plot on the right shows the percentage of DbGP33+ CD8 T cells remaining on day 15 relative to day 8. (c) DbGP33-specific T cells in tissues on day 279 post-infection. (c) The numbers on flow cytometry plots indicate the percentage of DbGP33-specific T cells of the total gated CD8 T cells. (d) The total number of DbGP33- and DbNP396-specific T cells in each tissue indicated on the graph. Errors bars in (d) indicate SEM. The horizontal dotted line in (b) represents the limit of detection. n=3–7 in each group. Data are representative of two independent experiments. *, p≤0.05; **, p≤0.005; ***p≤0.0005.
FIGURE 6
FIGURE 6
Antigen-specific CD8 T cells lacking the Atg7 gene exhibit cell-intrinsic defects in developing into long-term memory cells in bone marrow chimeric mice. Atg7fl/fl plus C57BL/6 (CD45.2/CD45.1) control and Atg7fl/flGzmb-Cre plus C57BL/6 (CD45.2/CD45.1) experimental mixed bone marrow chimera mice were generated. CD8 T cell response was evaluated following the LCMV Armstrong infection according to the scheme in Supplementary Fig. 5a. (a) and (b) Flow cytometric analysis of DbGP33- and DbNP396-specific T cells on day 8, 15 and 30 p.i. Gated on tetramer-positive CD8 T cells as indicated. Number on each quadrant represents the percentage of tetramer-positive cells that are either CD45.1+ or CD45.2+ as indicated on the axis. Average percentages of DbGP33- and DbNP396-specific T cells from day 8 to day 30 in the peripheral blood of both groups of chimeric mice are plotted to the right of the flow plots in (a) and (b). The black line represents tetramer-positive cell of Atg7fl/fl origin and the red line of Atg7fl/flGzmb-Cre origin. The number of tetramer-positive cells on day 8 p.i. from each mouse is normalized to 100%. (c) Percent of CD45.2+ antigen-specific cells in tissues on day 30 post-infection. The error bars in (a)–(c) indicate SEM. n=3–4 mice in each group. Data in (a)–(c) are representative of two independent experiments.
FIGURE 7
FIGURE 7
Metabolomic and transcriptomic analysis of Atg7-dificient CD8 T cells. Atg7fl/flGzmb-Cre (KO) and control (Atg7fl/fl, WT) mice were infected with LCMV Armstrong. DbGP33+ CD8 T cells were isolated from mice 8 day p.i for analysis. (a) Pathways differentially regulated in Day 8 Atg7-deficient antigen-specific cells. Each column represents an independent experiment of samples pooled from 3 WT or KO mice; each row a pathway colored to indicate its p-value. (b) Gene set enrichment analysis (GSEA) of genes represented in T cells, which are associated with the metabolic enzymes underlying the most differentially regulated metabolic pathways (a) in KO vs. WT. p=0.024.
FIGURE 8
FIGURE 8
Autophagy in CD8 T cells is essential for regulating chronic LCMV infection. Atg7fl/flGzmb-Cre and control Atg7fl/fl mice were infected with LCMV Clone-13. (a) Kinetics of DbGP276-specific T cells in the peripheral blood. (b) Total number of IFN-γ secreting cells in spleens after 5-hr stimulation ex vivo with peptide indicated from days 8 and 15 p.i. (c) Viral titers in serum at various time points p.i. n=3–5 mice in each group. Data are representative of two independent experiments. Error bars indicate SEM. *, p≤0.05; **, p≤0.005; ***p≤0.0005.

Comment in

  • Cell death: breaking down memory.
    Kugelberg E. Kugelberg E. Nat Rev Immunol. 2014 Dec;14(12):778-9. doi: 10.1038/nri3774. Epub 2014 Nov 14. Nat Rev Immunol. 2014. PMID: 25394943 No abstract available.

References

    1. Williams MA, Bevan MJ. Effector and memory CTL differentiation. Annu Rev Immunol. 2007;25:171–192. - PubMed
    1. Kaech SM, Wherry EJ. Heterogeneity and cell-fate decisions in effector and memory CD8+ T cell differentiation during viral infection. Immunity. 2007;27(3):393–405. - PMC - PubMed
    1. Kaech SM, Tan JT, Wherry EJ, Konieczny BT, Surh CD, Ahmed R. Selective expression of the interleukin 7 receptor identifies effector CD8 T cells that give rise to long-lived memory cells. Nat Immunol. 2003;4(12):1191–1198. - PubMed
    1. Sarkar S, Kalia V, Haining WN, Konieczny BT, Subramaniam S, Ahmed R. Functional and genomic profiling of effector CD8 T cell subsets with distinct memory fates. J Exp Med. 2008;205(3):625–640. - PMC - PubMed
    1. Joshi NS, Cui W, Chandele A, Lee HK, Urso DR, Hagman J, et al. Inflammation directs memory precursor and short-lived effector CD8(+) T cell fates via the graded expression of T-bet transcription factor. Immunity. 2007;27(2):281–295. - PMC - PubMed

Publication types

Associated data