

Review
doi: 10.1152/physiol.00012.2014.
Making microvascular networks work: angiogenesis, remodeling, and pruning
Affiliations
- PMID: 25362638
- PMCID: PMC4280154
- DOI: 10.1152/physiol.00012.2014
Item in Clipboard
Review
Making microvascular networks work: angiogenesis, remodeling, and pruning
Physiology (Bethesda).
2014 Nov.
Abstract
The adequate and efficient functioning of the microcirculation requires not only numerous vessels providing a large surface area for transport but also a structure that provides short diffusion distances from capillaries to tissue and efficient distribution of convective blood flow. Theoretical models show how a combination of angiogenesis, remodeling, and pruning in response to hemodynamic and metabolic stimuli, termed "angioadaptation," generates well organized, functional networks.
©2014 Int. Union Physiol. Sci./Am. Physiol. Soc.
Conflict of interest statement
No conflicts of interest, financial or otherwise, are declared by the author(s).
Figures
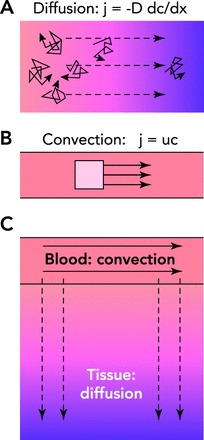
Basic principles of solute transport to tissue A: diffusive transport depends on the random thermal motion of individual solute molecules (solid arrows). In the presence of a concentration gradient (see footnote 1), this random motion results in a net mass flux (j) down the concentration gradient (dc/dx), proportional to the molecular diffusivity (D). Diffusive transport generally requires a steep gradient in concentration to be effective and is therefore limited to short distances. B: in convective transport, the solute is carried by a flowing fluid. The local mass flux of solute (j) is given by the product of the flow velocity (u, solid arrows) and the concentration (c). The transport distance is limited only by the energy dissipation due to friction of fluid flow. C: modes of solute transport in the microcirculation. Both convective transport and diffusive transport occur in blood and tissue regions. Convective transport is dominant in the blood, whereas diffusive transport is dominant in tissue for oxygen and other low molecular weight solutes.
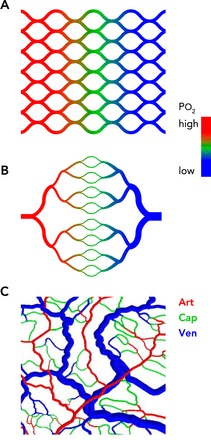
Comparison of idealized and actual structures of microvascular networks A: a capillary mesh provides a short and homogeneous diffusion distance, but high resistance to blood flow and an oxygen gradient across the tissue is generated. Color coding indicates the intravascular oxygen level. B: a symmetric tree structure provides low resistance to blood flow but short diffusion distances only in the central band containing capillaries. Color coding is as in A. C: a real network structure, based on observations of the rat mesentery, provides short and homogeneous diffusion distances in combination with low flow resistance. Color coding indicates vessel type: Art, arterioles (part of a diverging tree); Cap, capillaries (connecting a divergent with a convergent tree); Ven, venules (part of a converging tree).
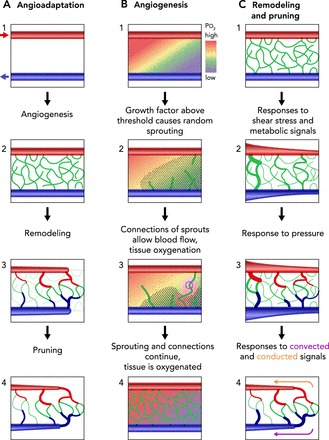
Processes of network formation and maturation A: overview. Red arrows, arteriolar inflow; blue arrows, venular drainage. 1: initial configuration with underperfused region between arteriole and venule. 2: sprouting angiogenesis leads to formation of an initial disordered mesh of new vessels. 3: structural remodeling results in an orderly progression of segment diameters along flow pathways. Redundant segments shrink in diameter. 4: pruning of redundant segments gives mature network structure. B: sprouting angiogenesis. 1: initial configuration with underperfused region between arteriole and venule. Color scale shows tissue oxygen levels. Growth factor is generated in hypoxic regions. Diagonal hatched lines indicate region with growth factor levels above a threshold level. 2: new sprouts (shown in white) are generated at random locations within region where growth factor level exceeds threshold. 3 and 4: connections between sprouts (pink circle) form continuous flow pathways, allowing flow and providing local tissue oxygenation. C: structural adaptation of vessel diameters. 1: initial disordered mesh of new vessels. 2: response to wall shear stress leads to larger diameters in vessels with higher flow. Response to metabolic signals stabilizes network by maintaining segments that are needed to supply metabolic needs. 3: response to intravascular pressure leads to arterio-venous asymmetry, with larger diameters in venules than in corresponding arterioles. 4: transmission of metabolic signals upstream by conducted responses and downstream by metabolite convection preferentially enlarges diameters on long flow pathways, which would otherwise be underperfused.
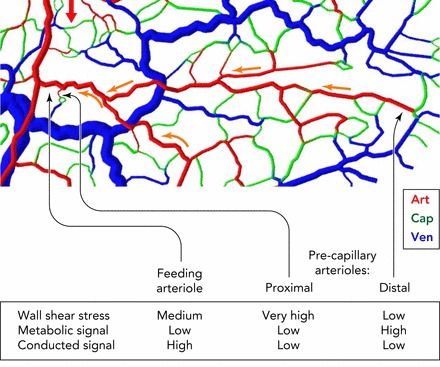
Schematic illustration of signals involved in remodeling of vessel diameters, showing importance of conducted responses Shown is a section of a mesenteric microvascular network, color-coded for vessel type (Art, arteriole; Cap, capillary; Ven, venule). Red arrow shows blood flow direction in main arteriole supplying region. Two precapillary arterioles are identified: one (proximal) forming part of a short arterio-venous flow pathway; the other (distal) forming part of a long flow pathway. The feeding arteriole of both pathways is shown for comparison. The feeding arteriole and the proximal precapillary arteriole experience equivalent oxygen levels and thus have similar local metabolic signals, but the proximal precapillary arteriole is subjected to a much steeper pressure gradient, leading to high wall shear stress, a growth stimulus. To establish a situation without functional shunting, i.e., high flow in the feeding arteriole relative to a proximal precapillary arteriole, the diameter of the feeding arteriole must be maintained large relative to that of the possible shunt. This condition can be achieved if the feeding arteriole, but not the proximal precapillary arteriole, receives a strong conducted signal transmitted from the high number of supplied capillaries (yellow arrows), ensuring a large vessel diameter and low flow resistance. The distal precapillary arteriole is typically in a low-oxygen region and receives a relatively strong local metabolic signal.
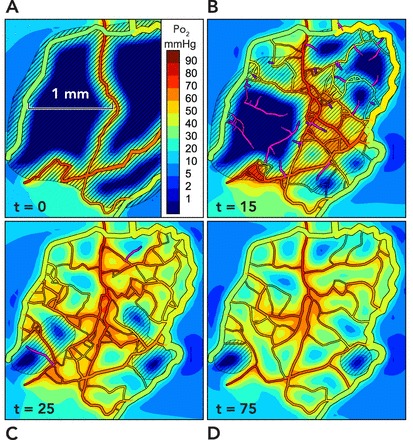
Simulation of angioadaptation Results are presented from two-dimensional simulations incorporating the mechanisms described in FIGURE 3 and described in detail elsewhere (68). A: the initial configuration is derived from observations of rat mesentery, with all but a few main vessels removed. Colors indicate oxygen levels (see scale bar). The extensive hypoxic regions generate levels of growth factor above the threshold level (diagonal lines) throughout most of the region. B: at 15 days, some regions contain unconnected new sprouts (shown in purple), whereas connected sprouts in other regions carry flow, and tissue is oxygenated. C: at 25 days, most of the tissue is well oxygenated, but some areas of hypoxia are still stimulating sprouting angiogenesis. D: at 75 days, the structure has stabilized with a vasculature capable of supplying nearly all points with oxygen but with pruning of redundant vessels.
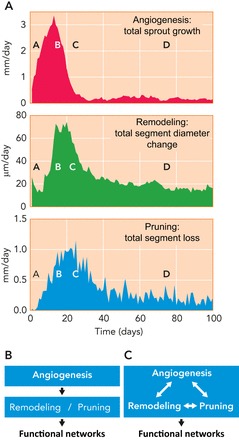
Time course of angiogenesis, remodeling, and pruning during simulated angioadaptation A: results based on the simulations described in FIGURE 5 show the strong overlap of these processes with some phase shift from angiogenesis to remodeling and to pruning. The letters A to D indicate corresponding time points in FIGURE 5. B: in the past, angiogenesis and structural remodeling/pruning were generally considered as sequential processes and were mostly separate areas of investigation, with angiogenesis receiving much greater emphasis. C: the results presented here, including those in A, indicate that remodeling and pruning occur largely in parallel with angiogenesis and that all three processes interact with each other. Therefore, understanding the formation of vascular networks requires consideration of the integrated processes of angiogenesis, structural adaptation, and pruning.
References
-
- Ahmad S, Hewett PW, Wang P, Al-Ani B, Cudmore M, Fujisawa T, Haigh JJ, Le Noble F, Wang L, Mukhopadhyay D, Ahmed A. Direct evidence for endothelial vascular endothelial growth factor receptor-1 function in nitric oxide-mediated angiogenesis. Circ Res 99: 715–722, 2006. - PubMed
-
- Anderson AR, Chaplain MA. Continuous and discrete mathematical models of tumor-induced angiogenesis. Bull Math Biol 60: 857–899, 1998. - PubMed
-
- Andres AC, Djonov V. The mammary gland vasculature revisited. J Mammary Gland Biol Neoplasia 15: 319–328, 2010. - PubMed
-
- Augustin HG, Koh GY, Thurston G, Alitalo K. Control of vascular morphogenesis and homeostasis through the angiopoietin-Tie system. Nat Rev Mol Cell Biol 10: 165–177, 2009. - PubMed
-
- Baish JW, Jain RK. Cancer, angiogenesis and fractals. Nat Med 4: 984, 1998. - PubMed
Publication types
MeSH terms
Grants and funding
LinkOut - more resources
Full Text Sources
Other Literature Sources