. 2015 Aug 13;34(33):4368-78.
doi: 10.1038/onc.2014.367. Epub 2014 Nov 3.

Mcph1/Brit1 deficiency promotes genomic instability and tumor formation in a mouse model

Affiliations

Mcph1/Brit1 deficiency promotes genomic instability and tumor formation in a mouse model

Y Liang et al. Oncogene. .

Abstract

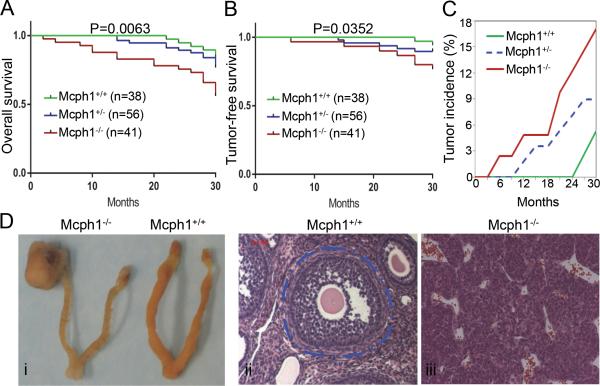
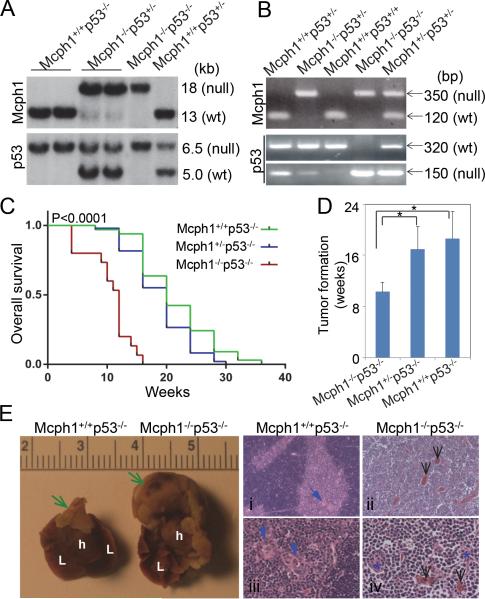
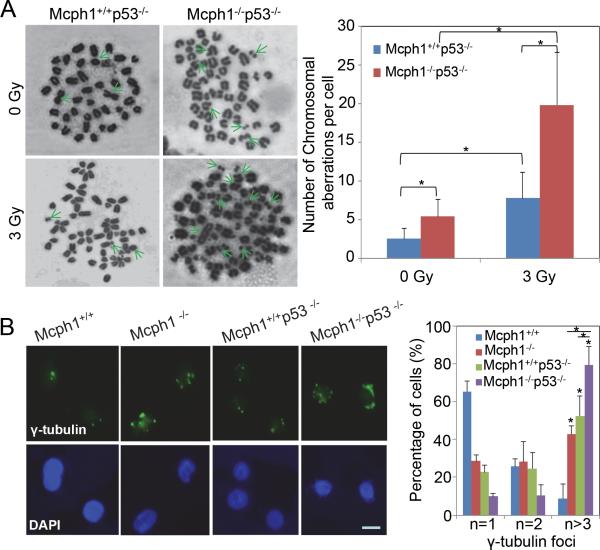
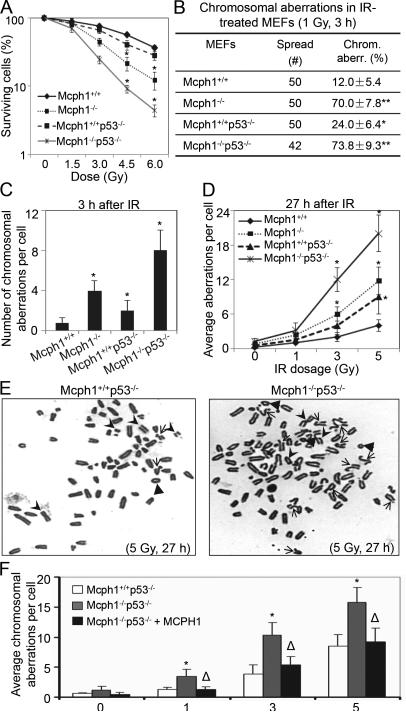
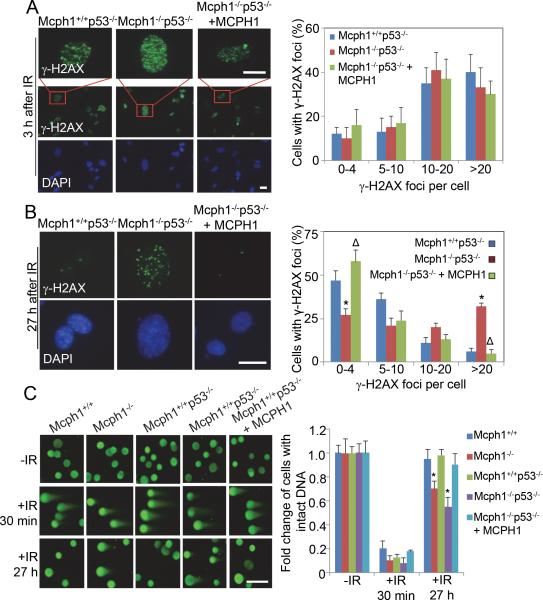
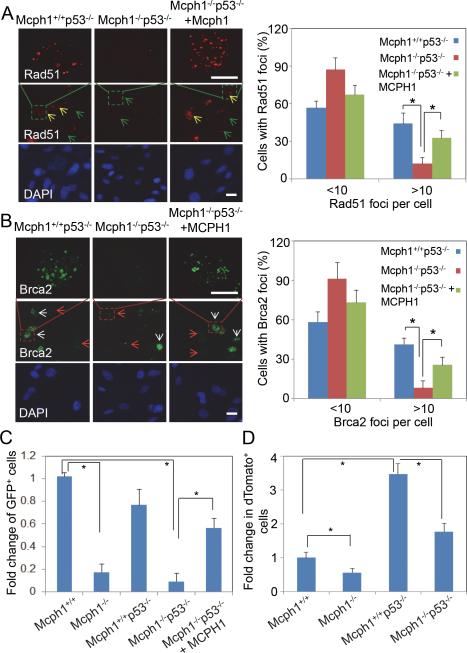
MCPH1, also known as BRIT1, has recently been identified as a novel key regulatory gene of the DNA damage response pathway. MCPH1 is located on human chromosome 8p23.1, where human cancers frequently show loss of heterozygosity. As such, MCPH1 is aberrantly expressed in many malignancies, including breast and ovarian cancers, and the function of MCPH1 has been implicated in tumor suppression. However, it remains poorly understood whether MCPH1 deficiency leads to tumorigenesis. Here we generated and studied both Mcph1(-/-) and Mcph1(-/-)p53(-/-) mice; we showed that Mcph1(-/-) mice developed tumors with long latency, and that primary lymphoma developed significantly earlier in Mcph1(-/-)p53(-/-) mice than in Mcph11(+/+)p53(-/-) and Mcph1(+/-)p53(-/-) mice. The Mcph1(-/-)p53(-/-) lymphomas and derived murine embryonic fibroblasts (MEFs) were both more sensitive to irradiation. Mcph1 deficiency resulted in remarkably increased chromosome and chromatid breaks in Mcph1(-/-)p53(-/-) lymphomas and MEFs, as determined by metaphase spread assay and spectral karyotyping analysis. In addition, Mcph1 deficiency significantly enhanced aneuploidy as well as abnormal centrosome multiplication in Mcph1(-/-)p53(-/-) cells. Meanwhile, Mcph1 deficiency impaired double strand break (DSB) repair in Mcph1(-/-)p53(-/-) MEFs as demonstrated by neutral Comet assay. Compared with Mcph1(+/+)p53(-/-) MEFs, homologous recombination and non-homologous end-joining activities were significantly decreased in Mcph1(-/-)p53(-/-) MEFs. Notably, reconstituted MCPH1 rescued the defects of DSB repair and alleviated chromosomal aberrations in Mcph1(-/-)p53(-/-) MEFs. Taken together, our data demonstrate MCPH1 deficiency promotes genomic instability and increases cancer susceptibility. Our study using knockout mouse models provides convincing genetic evidence that MCPH1 is a bona fide tumor suppressor gene. Its deficiency leading to defective DNA repair in tumors can be used to develop novel targeted cancer therapies in the future.


Figures

Figure 1
Figure 1. Mcph1 deficiency promotes tumor formation in mice
(A) Overall survival of a cohort of Mcph1+/+ (n=38), Mcph1+/− (n=56), and Mcph1−/− (n=41) mice monitored for 2.5 years. (B) Tumor-free survival of the cohort described in (A). (C) The cumulative tumor incidence in the cohort described in (A). Percent cumulative tumor incidence for each genotype plotted as a function of time, as indicated. (D) Representative ovarian tumors occurred in Mcph1−/− mice. (i) Gross images of ovarian tumor and ovaries. (ii and iii) H&E staining of normal ovaries (ii) and ovarian tumors (iii). The structure circled with dashed blue line is an example of a complete mature normal ovarian follicle in Mcph1+/+ mice (in ii), compare to panel iii showing the structure of ovaries with tumors in Mcph1−/− mice.
Figure 2
Figure 2. Mcph1 deficiency accelerates tumorigenesis in the absence of p53
(A) Southern blot analysis of mice genotyping. For Mcph1, the sizes of the WT and null alleles are 13 kb and 18 kb, respectively; for p53, the sizes are 6.5 kb (WT) and 5.0 kb (null). (B) PCR-based genotyping of mice. For Mcph1, the sizes of the PCR products are 350 bp (null) and 120 bp (WT); for p53, the sizes are 320 bp (WT) and 150 bp (null). (C) Kaplan-Meier survival analysis of Mcph1+/+p53−/− (n=33), Mcph1+/−p53−/− (n=49), and Mcph1−/−p53−/− (n=15) mice. (D) Average tumor onset in Mcph1+/+p53−/−, Mcph1+/−p53−/−, and Mcph1−/−p53−/− mice. * P<0.05. (E) Representative thymic lymphoma in Mcph1−/−p53−/− mice. (Left) Gross images of normal thymus and thymic lymphoma (scale=cm). Green arrows indicate normal thymus (in Mcph1+/+p53−/−) or thymic lymphoma (in Mcph1−/−p53−/−). L, lung; h, heart. (Right) Histological characterization of thymus or thymic lymphoma. Tissues were cut from normal thymus (Mcph1+/+p53−/−) or thymic lymphoma (Mcph1−/−p53−/−), and stained with H&E. Normal thymus is composed of a dark-staining basophilic cortex and a light-staining eosinophilic medulla (i, iii). Normal cortex contains numerous densely packed lymphocytes, and the medulla has fewer lymphocytes and more thymic corpuscles (blue arrows). However, there is no definite cortex and medulla structure in thymic lymphoma from Mcph1−/− p53−/− mice (ii, iv), and the entire region is composed of densely packed lymphocytes and infiltrated with more blood vessels (black arrows). Thymic corpuscles are almost disrupted and infiltrated with more lymphocytes (blue asterisks in panel iv).
Figure 3
Figure 3. Mcph1 deficiency induces chromosomal aberrations and centrosome abnormalities in the absence of p53
(A) Chromosomal aberrations are differentially induced in IR-treated Mcph1+/+p53−/− and Mcph1−/−p53−/− primary lymphoma cells. Cells were treated with or without IR (3 Gy), and subjected to the metaphase spread assay to examine chromosomal aberrations 3 h later. (Left) Representative images of metaphase spreads. Green arrows indicate chromosomal aberrations: chromosomal breaks, fusions, and ring chromosomes. (Right) Quantitative analysis of chromosomal aberrations per cell for each genotype. The number of chromosomal aberrations was counted per spread from at least 30 spreads for each sample, and at least two pairs of primary lymphomas were used for each genotype. These experiments were repeated in duplicate, and the data represented as mean ± s.d. (* P<0.05). (B) Centrosome multiplication is induced in Mcph1−/−p53−/− MEFs. Immunofluorescent staining of centrosome marker γ-tubulin was used to detect the number of centrosomes in a cell. (Left) Representative images of γ-tubulin staining. Scale bar, 25 nM. (Right) Quantitative analysis of γ-tubulin foci per cell for each genotype. The number of γ-tubulin foci was counted per cell from at least 300 cells per sample. These experiments were repeated twice in duplicate for each MEF (* P<0.05). n, number of γ-tubulin foci (representing the number of centrosomes) in one cell.
Figure 4
Figure 4. Mcph1 deficiency enhances genomic instability in p53 null background
(A) Mcph1−/−p53−/− MEFs are more sensitive to IR. Mcph1+/+, Mcph1−/−, Mcph1+/+p53−/−, and Mcph1−/−p53−/− MEFs were irradiated with increasing doses of IR (0, 1.5, 3, 4.5, and 6 Gy). Cells were counted 6 days later and the counts were normalized to the number of cells from unirradiated controls for each genotype. These experiments were triplicated, and the data represented as mean ± s.d. (* P<0.05, compared with Mcph1+/+ MEFs at the indicated doses). (B) Percentage of cells with chromosomal aberrations in Mcph1+/+, Mcph1−/−, Mcph1+/+p53−/−, and Mcph1−/−p53−/− MEFs treated with IR (1 Gy, 3 h). (* P<0.05, compared with Mcph1+/+ MEFs). (C) The average number of chromosomal aberrations per cell in Mcph1+/+, Mcph1−/−, Mcph1+/+p53−/−, and Mcph1−/−p53−/− MEFs treated with IR (1 Gy, 3 h). (* P<0.05, compared with Mcph1+/+ MEFs). (D) The average number of chromosomal aberrations per cell 27 h after IR at the indicated doses. Mcph1+/+, Mcph1−/−, Mcph1+/+p53−/−, and Mcph1−/−p53−/− MEFs were irradiated with increasing doses of IR (0, 1, 3, and 5 Gy), and then analyzed with the metaphase spread assay. (* P<0.05, compared with Mcph1+/+ MEFs at the indicated doses). (E) Representative metaphase spread of Mcph1+/+p53−/− and Mcph1−/−p53−/− MEFs 27 h after IR (5 Gy). Arrows, chromatid breaks or translocations; arrowheads, chromosomal breaks or fusions; triangles, ring chromosomes. (F) Ectopic MCPH1 can largely reduce chromosomal aberrations in Mcph1−/−p53−/− MEFs. MCPH1 was stably transfected into Mcph1−/−p53−/− MEFs, namely Mcph1−/−p53−/−+MCPH1, and the average number of chromosomal aberrations per cell was counted as described in (D). (* P<0.05, compared with either Mcph1+/+p53−/− or Mcph1−/− p53−/−+MCPH1 MEFs at the indicated doses; Δ, P>0.05, compared with Mcph1+/+p53−/− MEFs at the indicated doses).
Figure 5
Figure 5. Mcph1 deficiency impairs DNA DSB repair
(A) Mcph1 deficiency does not affect γ-H2AX foci formation. An immunofluorescence staining assay was used to examine foci formation of γ-H2AX in the indicated MEFs 3 h after IR (2 Gy). (Left) Representative images of γ-H2AX foci. A large field of cells with γ-H2AX staining is also shown here. Scale bar, 25 μM. (Right) Quantitative analysis of γ-H2AX foci per cell in each genotype from three independent experiments. (B) Immunofluorescence analysis of residual γ-H2AX foci in the indicated MEFs 27 h after IR (2 Gy). (Left) Representative images of γ-H2AX foci. Scale bar, 25 μM. (Right) The graph represents the number of γ-H2AX foci per cell in the indicated MEFs. (* P<0.05, compared with Mcph1+/+p53−/− MEFs; Δ, P>0.05, compared with Mcph1+/+p53−/− MEFs). (C) DSB repair is impaired in Mcph1-deficienct MEFs as determined by Neutral-pH Comet assay. (Left) Representative images. A large file of these images is provided in Supplementary Figure S4. Scale bar is 50 μM. (Right) Quantitative analysis of three independent experiments. More than 96% of the untreated cells contained tail moments less than 2, which was set as the parameter for cells with intact DNA. Percentage of no-IR cells with intact DNA (tail moment less than 2) was set as 1 for each genotype. At least 75 cells were scored in each sample and each value represents the mean ± s.d. of three independent experiments. (* P<0.05, compared with Mcph1+/+ MEFs).
Figure 6
Figure 6. HR and NHEJ are reduced in Mcph1−/−p53−/− MEFs
(A, B) Rad51 and Brac2 foci formation are impaired in Mcph1−/−p53−/− MEFs and partially rescued by ectopic MCPH1. Three different types of MEFs were treated with IR (8 Gy), and stained for immunofluorescent analysis of Rad51 (A) and Brca2 (B) 3 h after IR. The large fields of Rad51 and Brca2 foci staining are also shown here. Yellow arrows, Rad51-positive cells; green arrows, Rad51-negative cells; white arrows, Brca2-positive cells; red arrows, Brca2-negative cells. Scale bar, 50 μM. * P<0.05. (C) HR activity is significantly decreased in MCPH1-deficienct MEFs according to the analysis of the results of the HR repair assay. The HR activity in each MEF was represented by the relative percentage of GFP+ cells. The relative percentage of GFP+ cells in each MEF was calculated as the percentage of GFP+ cells in I-SceI-transfected MEFs, which was first subtracted by the percentage of GFP+ cells in control plasmid (pCAGGS)-transfected MEFs, and then normalized by transfection efficiency determined by pEGFP-C1. Each value in the graph is relative to the percentage of GFP+ cells in Mcph1+/+ MEFs, which was set at 1, and is shown as the mean ± s.d. of three independent experiments (* P<0.05). (D) NHEJ activity is reduced in Mcph1-deficient MEFs. NHEJ activity was reported as the ratio of cells that were double positive for red (dTomato+) and green (GFP+) fluorescence to the total cells that were only positive for green fluorescence (GFP+). The level of NHEJ activity in Mcph1+/+ MEFs was set as “1”. The values for all other MEFs were normalized to that in Mcph1+/+ MEFs. This experiment was performed twice in duplicates for each MEFs (* P<0.05).

Similar articles

Cited by

References

    1. Rai R, Dai H, Multani AS, Li K, Chin K, Gray J, et al. BRIT1 regulates early DNA damage response, chromosomal integrity, and cancer. Cancer Cell. 2006;10:145–157. - PMC - PubMed
    1. Lin SY, Liang Y, Li K. Multiple roles of MCPH1/MCPH1 in DNA damage response, DNA repair, and cancer suppression. Yonsei Med J. 2010;51:295–301. - PMC - PubMed
    1. Venkatesh T, Suresh PS. Emerging roles of MCPH1: expedition from primary microcephaly to cancer. Eur J Cell Biol. 2014;93:98–105. - PubMed
    1. Mohammad DH, Yaffe MB. 14-3-3 proteins, FHA domains and BRCT domains in the DNA damage response. DNA Repair (Amst) 2009;8:1009–1017. - PMC - PubMed
    1. Bork P, Hofmann K, Bucher P, Neuwald AF, Altschul SF, Koonin EV. A superfamily of conserved domains in DNA damage-responsive cell cycle checkpoint proteins. FASEB J. 1997;11:68–76. - PubMed

Publication types

MeSH terms