. 2014 Nov 27;515(7528):523-7.
doi: 10.1038/nature13953. Epub 2014 Nov 2.

A positional Toll receptor code directs convergent extension in Drosophila

Affiliations

A positional Toll receptor code directs convergent extension in Drosophila

Adam C Paré et al. Nature. .

Erratum in

Abstract

Elongation of the head-to-tail body axis by convergent extension is a conserved developmental process throughout metazoans. In Drosophila, patterns of transcription factor expression provide spatial cues that induce systematically oriented cell movements and promote tissue elongation. However, the mechanisms by which patterned transcriptional inputs control cell polarity and behaviour have long been elusive. We demonstrate that three Toll family receptors, Toll-2, Toll-6 and Toll-8, are expressed in overlapping transverse stripes along the anterior-posterior axis and act in combination to direct planar polarity and polarized cell rearrangements during convergent extension. Simultaneous disruption of all three receptors strongly reduces actomyosin-driven junctional remodelling and axis elongation, and an ectopic stripe of Toll receptor expression is sufficient to induce planar polarized actomyosin contractility. These results demonstrate that tissue-level patterns of Toll receptor expression provide spatial signals that link positional information from the anterior-posterior patterning system to the essential cell behaviours that drive convergent extension.


Figures

Extended Data Figure 1
Extended Data Figure 1. Targeting of Eve, Runt, and Toll receptors by dsRNA injection
(a-c) Control and dsRNA-injected embryos stained for Runt (red, middle) and Wingless (Wg) (green, bottom) proteins. (a) In uninjected wild-type embryos, Runt is expressed in seven broad stripes and Wg is expressed in 14 narrow stripes. (b) In embryos injected with eve dsRNA alone, Runt is more uniformly expressed, and the Wg expression pattern collapses into fewer, broader stripes, similar to eve mutants (data not shown). (c) In embryos co-injected with eve and runt dsRNAs, Runt protein is undetectable, indicating that the runt dsRNA effectively inhibits Runt expression, and the Wg expression pattern collapses into fewer, broader stripes, similar to eve and runt mutants (data not shown). Anterior left, ventral down. Bars, 100 μm. (d-f) Quantitative RT-PCR analysis of Toll-2 (2), Toll-6 (6), Toll-7 (7), and Toll-8 (8) expression in late stage 6 embryos before axis elongation. CT values were normalized to the internal control gene Rpl32. (d) Relative transcript levels in WT embryos were calculated using the 2−ΔCT method. Toll-2, Toll-6, and Toll-8 were expressed at comparable levels, whereas Toll-7 was expressed at much lower levels. (e) Toll-8 expression in Toll-859/145 embryos was reduced 76-fold compared with WT embryos. (f) Gene expression was specifically reduced in embryos injected with single dsRNAs targeting Toll-2, Toll-6, or Toll-8 compared with embryos injected with a control Toll-3 dsRNA, as determined using the 2−ΔΔCT method.
Extended Data Figure 2
Extended Data Figure 2. Expression patterns of Toll-2, Toll-6, and Toll-8 relative to Runt
(a-f) Toll-2, Toll-6, and Toll-8 transcripts (green top, white bottom) and Runt protein (magenta) in wild-type (WT) embryos during early (stage 7, a-c) and mid-elongation (stage 8, d-f). The embryos are the same as in Fig. 1a-f. Colored bars indicate the position of the Toll-2, Toll-6, and Toll-8 stripes (green) relative to Runt. Anterior left, ventral down. Bars, 100 μm.
Extended Data Figure 3
Extended Data Figure 3. Time-lapse imaging of embryos defective for combinations of Toll-2, Toll-6, and Toll-8
(a-e) Axis elongation (tissue AP length relative to t=0) (top row), total cell rearrangements (average number of neighbors lost per cell) (second row), T1 processes resulting from the contraction of single edges (third row), and rosette rearrangements resulting from the contraction of multiple connected edges (fourth row) over time in wild-type embryos (a) and embryos defective for one (b), two (c), or three (d,e) Toll receptors. Images were acquired every 15 s. (f-i) Axis elongation (f), average number of cell rearrangements (g), T1 processes (h), and rosettes (i) per cell at t=30 min. (j) Edge contraction rate for AP edges (oriented 75-90° relative to the AP axis) at mid-stage 7 (averaged from t=5-8 min after the onset of elongation). (k) The orientation of shrinking edges relative to the AP axis (0°) was similar for all conditions. Single average values were obtained for each embryo, and plots show the mean±s.e.m. across embryos. *p=0.01-0.03, **p<0.005 (unpaired t-test). n = 3-8 embryos/genotype, 164-365 cells/embryo (see Supplementary Table 2 for full list of n values). (l) Cross sections of the ventrolateral epithelium in wild-type and Toll-2Δ76, Toll-61B, Toll-714F, Toll-8 mutant (Toll-2,6,7,8) embryos, showing that apical-basal polarity is unaffected in quadruple mutants. Myosin II (green) and Par-3 (red, white) are enriched at apical adherens junctions. Apical up, basal down. Bars, 10 μm. WT (Spider-GFP in a, e-k; Resille-GFP in a, f-k; and Resille-GFP+Toll-3 dsRNA in a-d and f-k); Toll-2 (Resille-GFP+Toll-2 dsRNA); Toll-6 (Resille-GFP+Toll-6 dsRNA); Toll-8 (Resille-GFP; Toll-859/145); Toll-2,6 (Resille-GFP+Toll-2/Toll-6 dsRNAs); Toll-2,8 (Resille-GFP; Toll-859/145+Toll-2 dsRNA); Toll-6,8 (Toll-2Δ76/CyO; Toll-8, Toll-65A, Spider-GFP); Toll-2,6,8 (Toll-2Δ76; Toll-8, Toll-65A, Spider-GFP), Toll-2,6,8 i1 (Resille-GFP; Toll-859/145+Toll-2/Toll-6 dsRNAs set 1); Toll-2,6,8 i2 (Resille-GFP; Toll-859/145+Toll-2/Toll-6 dsRNAs set 2); runt (runtLB5; Spider-GFP/+); and eve (eveR13; Spider-GFP/+).
Extended Data Figure 4
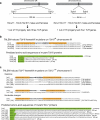
Extended Data Figure 4. Generation of double, triple, and quadruple Toll receptor mutants
(a) The crossing strategy used to generate Toll-2,6,8 triple mutants and Toll-2,6,7,8 quadruple mutants. Toll-7 and Toll-2 are 285 kb apart on the right arm of chromosome II and Toll-8 and Toll-6 are 94 kb apart on the left arm of chromosome III. (b) Three unique Toll-6 null alleles (Toll-61B, Toll-64B, and Toll-65A) were generated on the Toll-8 chromosome using TALEN-mediated mutagenesis to create Toll-8, Toll-6 double-mutant chromosomes. (c) Six unique Toll-7 null alleles (Toll-71C, Toll-74D, Toll-75A, Toll-75F, Toll-714F, and Toll-716A) were generated on the Toll-2Δ76 chromosome using TALEN-mediated mutagenesis to create Toll-7, Toll-2 double-mutant chromosomes. Each Toll-6 and Toll-7 allele is a frame-shift mutation leading to premature translational termination. TALENs were designed to induce double-stranded breaks immediately downstream of the ATG translational start sites. Orange letters indicate the TALEN binding sites, and the spacer regions are shown in bold. The Ava II and Ava I restriction sites used for screening are indicated with dotted boxes. Shown below are the predicted amino acid sequences of the mutant proteins compared with the wild-type sequence. Residues that are identical in the mutant and wild-type proteins are shown in green.
Extended Data Figure 5
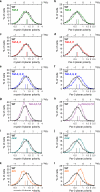
Extended Data Figure 5. Distributions of cell polarity measurements in Toll receptor mutants
(a-l) Planar polarity distributions for myosin II (left panels) and Par-3 (right panels) in Toll-2 single mutants (a,b), Toll-6,8 double mutants (c,d), Toll-2,6,8 triple mutants (e,f), Toll-2,6,7,8 quadruple mutants (g,h), runt mutants (i,j), and eve mutants (k,l). Vertical lines indicate the means of the distributions. Error bars indicate s.e.m. between embryos. Mean planar polarity was shifted toward 1 (absolute ratio; 0 on the log2 scale) in Toll-2 single mutants (p=0.005 for myosin and p<0.00005 for Par-3), Toll-2,6,8 triple mutants (p<0.00002 for myosin and Par-3), Toll-2,6,7,8 quadruple mutants (p<0.00001 for myosin and Par-3), runt mutants (p=0.002 for myosin and p<0.00001 for Par-3), and eve mutants (p<0.00001 for myosin and Par-3), indicating reduced planar polarity (unpaired t-test with the means of the distributions used as the test statistic). Planar polarity in Toll-2,6,7,8 quadruple mutants was not significantly enhanced relative to triple mutants. Single values were obtained for each embryo, and plots show the mean±s.e.m. across embryos. n=2,166-4,909 cells in 7-20 embryos/genotype (see Supplementary Table 2).
Extended Data Figure 6
Extended Data Figure 6. Toll receptor expression affects planar polarity in a regional manner
(a) Single-cell analysis of Par-3 planar polarity in wild-type (WT) (left) and Toll-2 mutant (right) embryos. Toll-8-expressing cells were identified by fluorescence in situ hybridization. Cyan lines, boundaries between stripes; Toll-8+, Toll-8-expressing cells. AP enriched (red), DV enriched (blue). Cells without at least one AP and one DV edge were not scored (gray). (b,c) Myosin II (cyan, white) and Toll-2 mRNA (red) in stage 7 WT (b) and eve mutant (c) embryos. Arrows, residual myosin cables in eve embryos. Anterior left, ventral down. Bars, 20 μm.
Figure 1
Figure 1. Cells express different combinations of Toll-2, Toll-6, and Toll-8 along the anterior-posterior axis
(a-n) Toll-2 (red), Toll-6 (cyan), and Toll-8 (green) mRNA expression in wild-type (WT) (a-f,m,n), eve mutant (g-i), and runt mutant (j-l) embryos during early (stage 7, a-c,m,n) and mid-elongation (stage 8, d-l). (m,n) Toll-6 (cyan) is expressed anterior to the strong Toll-2 stripes (red) and Toll-8 (green) is expressed between them. (o) Toll-8-YFP protein in a stage 7 Toll-8 mutant. (p) Schematic of Toll-2, Toll-6, and Toll-8 expression. Numbers, parasegments; vertical lines, parasegmental boundaries. Anterior left, ventral down. Bars, 100 μm (a-l), 20 μm (m-o).
Figure 2
Figure 2. Toll-2, Toll-6, and Toll-8 regulate cell intercalation and axis elongation
(a) Stills from time-lapse movies of a wild-type (WT) embryo (top) and a Toll-8 mutant injected with Toll-2 and Toll-6 dsRNAs (Toll-2,6,8) (bottom). Resille-GFP (white). t=0, onset of elongation. In WT, nearly all initially adjacent cells become separated by intercalated cells (yellow dots). In Toll-2,6,8 embryos, many cells fail to separate. Anterior left, ventral down. Bar, 20 μm. (b,c) Axis elongation (tissue AP length relative to t=0) over time (b) and at 30 min (c). (d) Edge contraction and formation. (e,f) Cell rearrangements over time (e) and at 30 min (f). Single average values were obtained for each embryo; plots show the mean±s.e.m. across embryos. (b-f) n=3-8 embryos/genotype, 164-365 cells/embryo (Supplementary Table 2). (g) Edge formation errors. n=3-9 embryos/genotype, 42-104 vertices/embryo. *p=0.01-0.03, **p<0.005 (unpaired t-test). WT (Spider-GFP); 2 (Resille-GFP+Toll-2 dsRNA); 6 (Resille-GFP+Toll-6 dsRNA); 8 (Resille-GFP; Toll-859/145); 2,6 (Resille-GFP+Toll-2/Toll-6 dsRNAs); 2,8 (Resille-GFP; Toll-859/145+Toll-2 dsRNA); 6,8 (Toll-2Δ76/CyO; Toll-8, Toll-65A, Spider-GFP); 2,6,8 i (Resille-GFP; Toll-859/145+Toll-2/Toll-6 dsRNAs); 2,6,8 (Toll-2Δ76; Toll-8, Toll-65A, Spider-GFP); runt (runtLB5; Spider-GFP/+); eve (eveR13; Spider-GFP/+).
Figure 3
Figure 3. Toll receptors are required for myosin II and Par-3 planar polarity
(a-d) Stage 7 wild-type (WT) (a), Toll-2,6,8 (b), eve (c), and runt (d) embryos. Par-3 (red, middle), myosin II (green, right). (e-j) Par-3 and myosin II planar polarity in all cells (e,f) and subsets of cells (g-j). Horizontal line, median; +, mean; boxes, 2nd and 3rd quartiles; whiskers, 5th to 95th percentile. Single average values were obtained for each embryo; plots show the distribution of values across embryos. *p≤0.005, **p<0.0001 (unpaired t-test). n = 2,445-4,698 cells in 11-19 embryos/genotype (Supplementary Table 2). Anterior left, ventral down. Bar, 20 μm.
Figure 4
Figure 4. Myosin II localization and activity are enhanced at boundaries of Toll-2 and Toll-8 expression
(a-c) Stage 15 embryos expressing control β-catenin-HA (a), Toll-2-HA (b), or Toll-8-HA (c) expressed with engrailed-Gal4. Myosin II (green, white), HA (red). Arrows, anterior boundary of the engrailed domain. Ventral views. Bar, 10 μm. (d) Myosin levels are increased at the posterior boundary of Toll-2 stripes in eve mutants (p=0.00001). All edges oriented 75-90° relative to the AP axis (AP) or edges only at anterior (Ant) or posterior (Post) boundaries of Toll-2 stripes; edge values were normalized to average edge intensity. (e) Myosin levels are increased at the anterior boundary of ectopic Toll-2 and Toll-8 expression. (f) Peak retraction velocities following laser ablation are increased at the anterior boundary of ectopic Toll-8 expression. Horizontal line, median; boxes, 2nd and 3rd quartiles; whiskers, 5th to 95th percentile. Single average values were obtained for each embryo; plots show the distribution of values across embryos. *p≤0.008, **p≤0.0001 (unpaired t-test). (d,e) n=6-15 embryos/genotype, (f) n=16-17 ablations/genotype (Supplementary Table 2).
Figure 5
Figure 5. Toll receptors mediate heterophilic interactions between cells
(a-d) Drosophila S2R+ cells expressing Toll-2-HA (red) incubated with pentamerized Toll-8 (a,b) or Toll-2 (c,d) extracellular domains (ECD) (green). Toll-8 ECD bound more strongly (b) and Toll-2 ECD bound less strongly (d) to Toll-2-positive (Toll-2+) cells compared with Toll-2-negative (Toll-2-) cells (p<0.00001, unpaired t-test). Horizontal line, median; boxes, 2nd and 3rd quartiles; whiskers, 5th to 95th percentile. (e-k) Interactions between cells expressing myosin-GFP (cyan, listed first) or myosin-mCherry (red, listed second) with the indicated Toll receptors (−, myosin marker alone). Receptor-expressing cells displayed increased binding to untransfected cells (p≤0.0001, Chi-square test). Heterophilic binding was increased between cells expressing Toll-2 and Toll-6 (p≤0.0003), Toll-2 and Toll-8 (p<0.05), and Toll-2 and Toll-6+Toll-8 (p≤0.0001) (Chi-square test). *p=0.01-0.05, **p≤0.0003. (l) Model: heterophilic interactions between Toll receptors recruit myosin II, promoting oriented cell rearrangements and convergent extension. (b,d) n=170-176 cells/condition, (k) n=85-123 transfected cells/condition (Supplementary Table 2). Bars, 20 μm (a,c,g-j), 100 μm (e,f).

Comment in

References

    1. Keller R, et al. Mechanisms of convergence and extension by cell intercalation. Philosophical Transactions of the Royal Society B: Biological Sciences. 2000;355:897–922. - PMC - PubMed
    1. Zallen JA. Planar polarity and tissue morphogenesis. Cell. 2007;129:1051–1063. - PubMed
    1. Wallingford JB. Planar Cell Polarity and the Developmental Control of Cell Behavior in Vertebrate Embryos. Annu. Rev. Cell Dev. Biol. 2012;28:627–653. - PubMed
    1. Solnica-Krezel L, Sepich DS. Gastrulation: making and shaping germ layers. Annu. Rev. Cell Dev. Biol. 2012;28:687–717. - PubMed
    1. Walck-Shannon E, Hardin J. Cell intercalation from top to bottom. Nat Rev Mol Cell Biol. 2014;15:34–48. - PMC - PubMed

Publication types

MeSH terms

Associated data