. 2015 Jan 15;517(7534):386-90.
doi: 10.1038/nature13848. Epub 2014 Oct 26.

CEACAM1 regulates TIM-3-mediated tolerance and exhaustion

Affiliations

CEACAM1 regulates TIM-3-mediated tolerance and exhaustion

Yu-Hwa Huang et al. Nature. .

Erratum in

  • Corrigendum: CEACAM1 regulates TIM-3-mediated tolerance and exhaustion.
    Huang YH, Zhu C, Kondo Y, Anderson AC, Gandhi A, Russell A, Dougan SK, Petersen BS, Melum E, Pertel T, Clayton KL, Raab M, Chen Q, Beauchemin N, Yazaki PJ, Pyzik M, Ostrowski MA, Glickman JN, Rudd CE, Ploegh HL, Franke A, Petsko GA, Kuchroo VK, Blumberg RS. Huang YH, et al. Nature. 2016 Aug 18;536(7616):359. doi: 10.1038/nature17421. Epub 2016 Mar 16. Nature. 2016. PMID: 26982724 Free PMC article. No abstract available.
  • Author Correction: CEACAM1 regulates TIM-3-mediated tolerance and exhaustion.
    Huang YH, Zhu C, Kondo Y, Anderson AC, Gandhi A, Russell A, Dougan SK, Petersen BS, Melum E, Pertel T, Clayton KL, Raab M, Chen Q, Beauchemin N, Yazaki PJ, Pyzik M, Ostrowski MA, Glickman JN, Rudd CE, Ploegh HL, Franke A, Petsko GA, Kuchroo VK, Blumberg RS. Huang YH, et al. Nature. 2024 Feb;626(8001):E19. doi: 10.1038/s41586-024-07164-y. Nature. 2024. PMID: 38336833 No abstract available.

Abstract

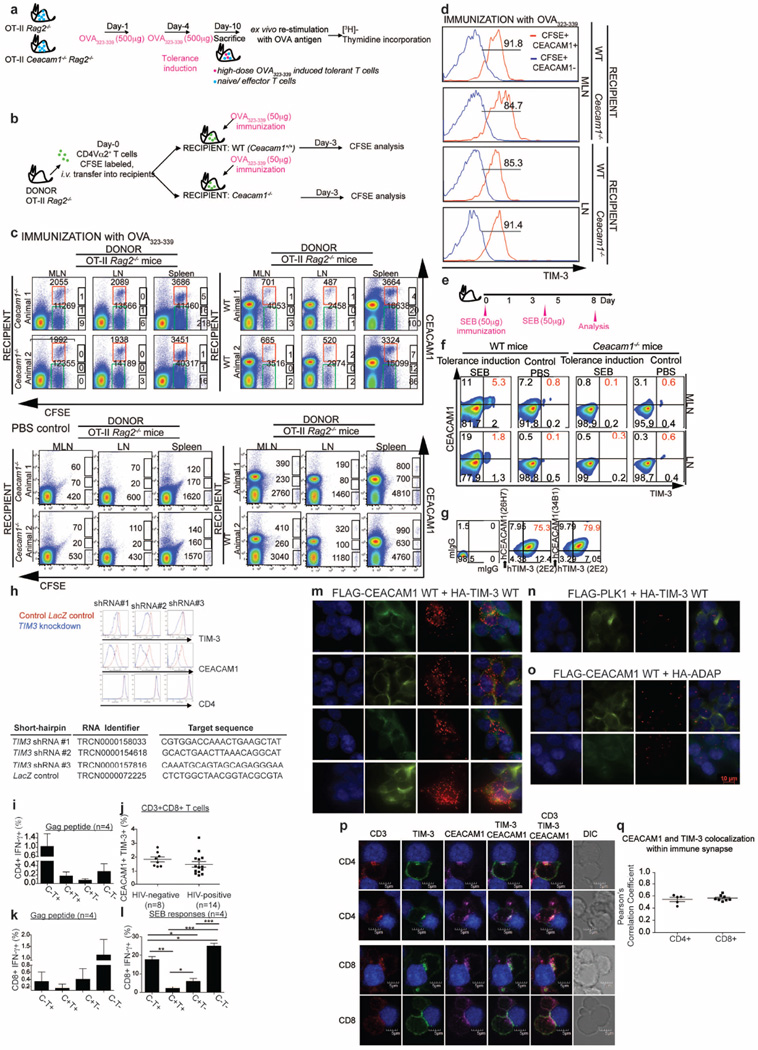
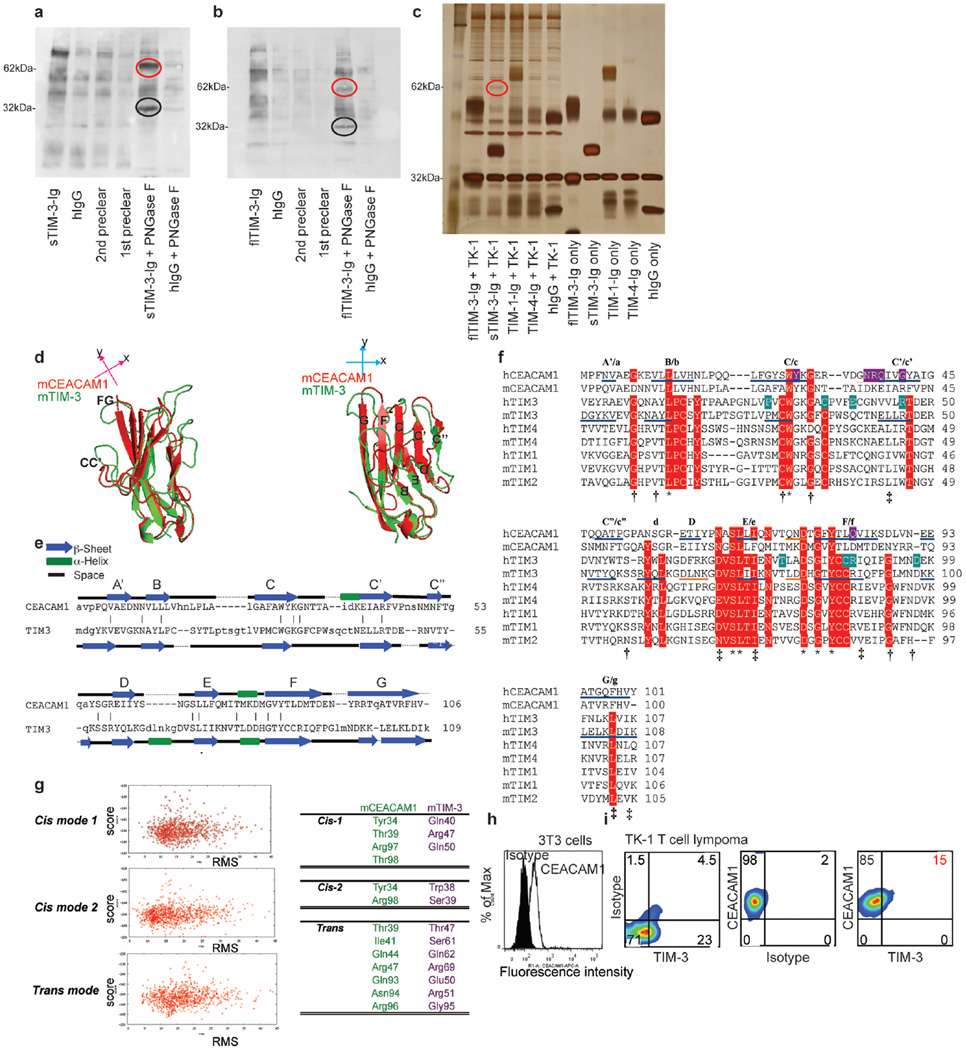
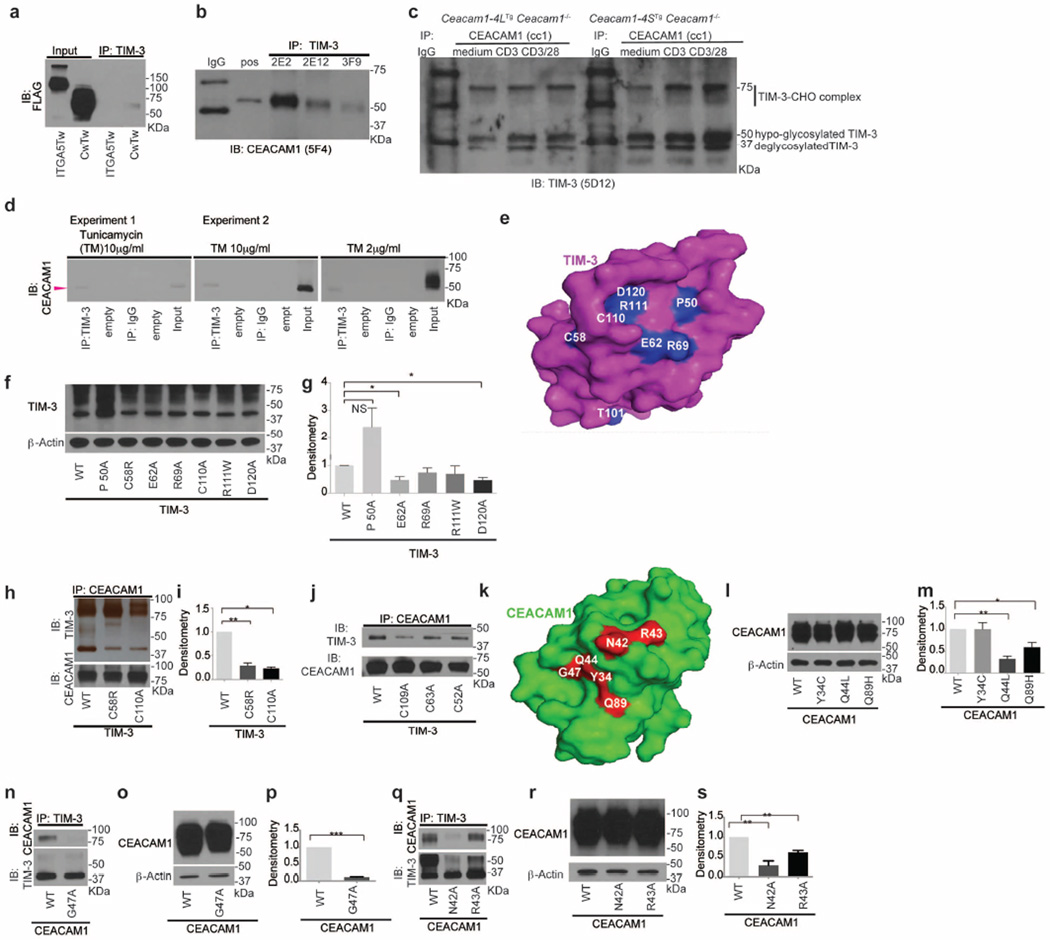
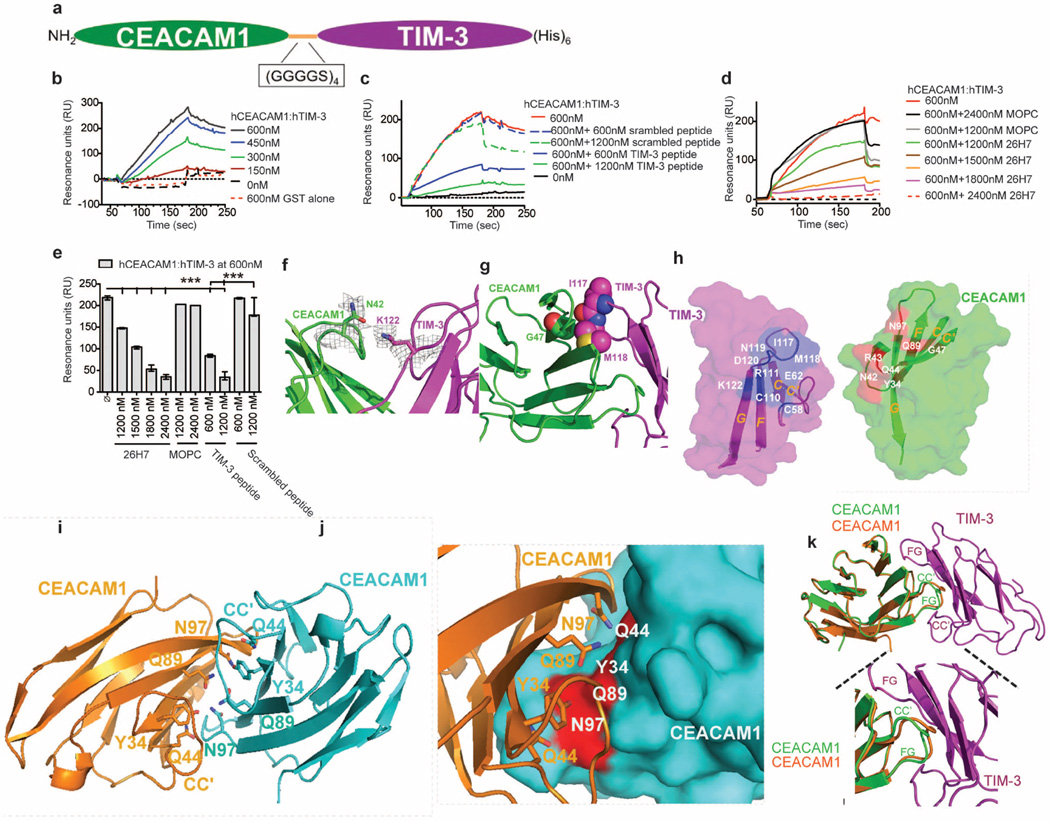
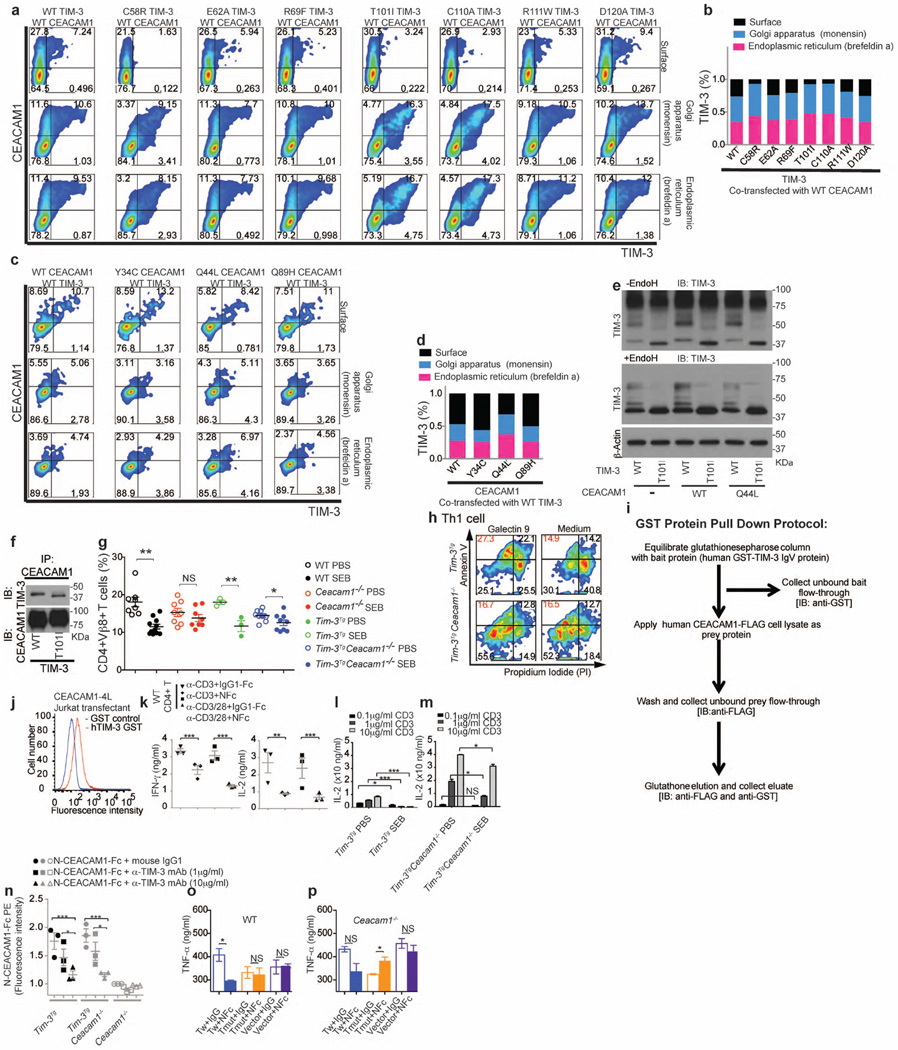
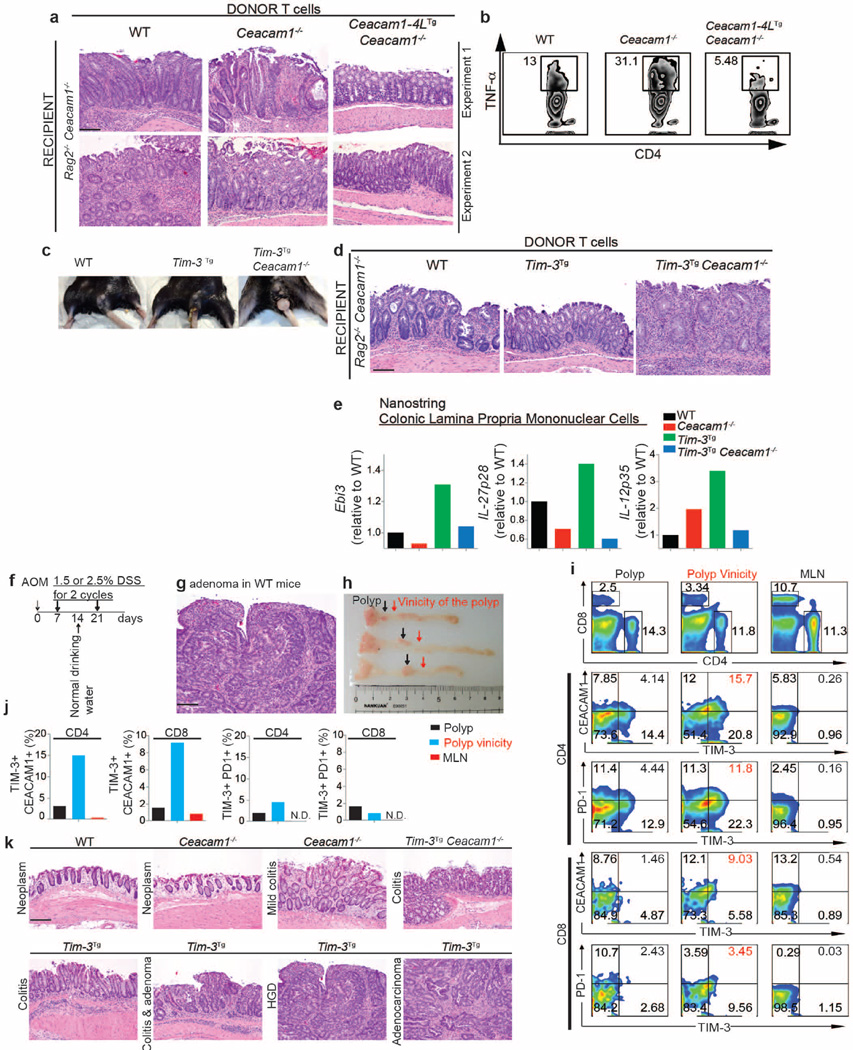
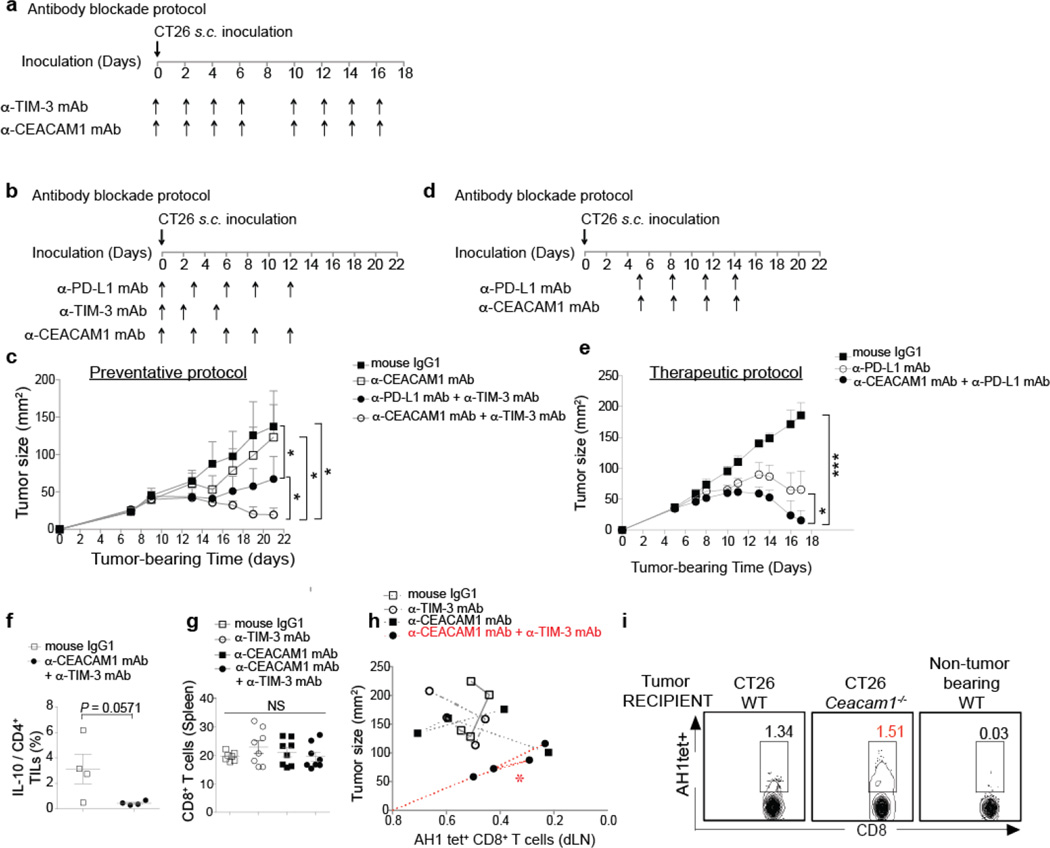
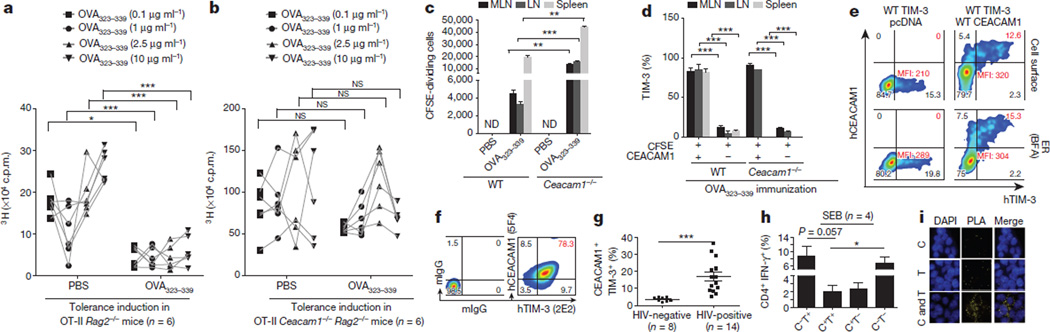
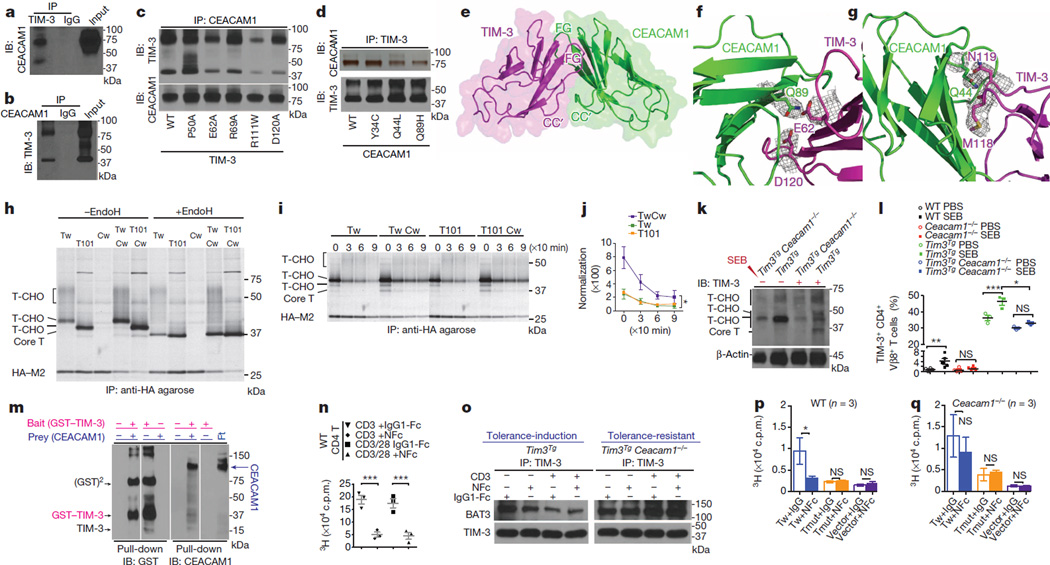
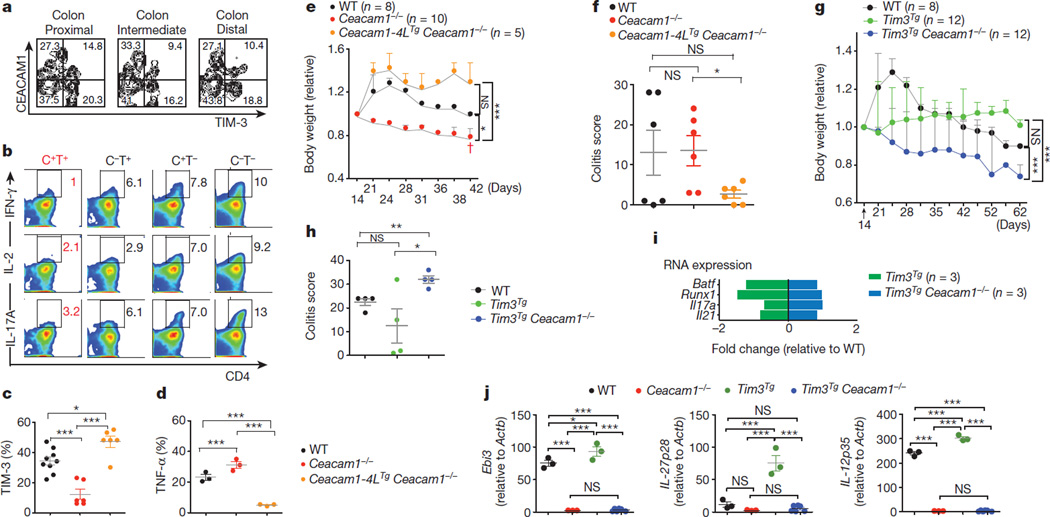
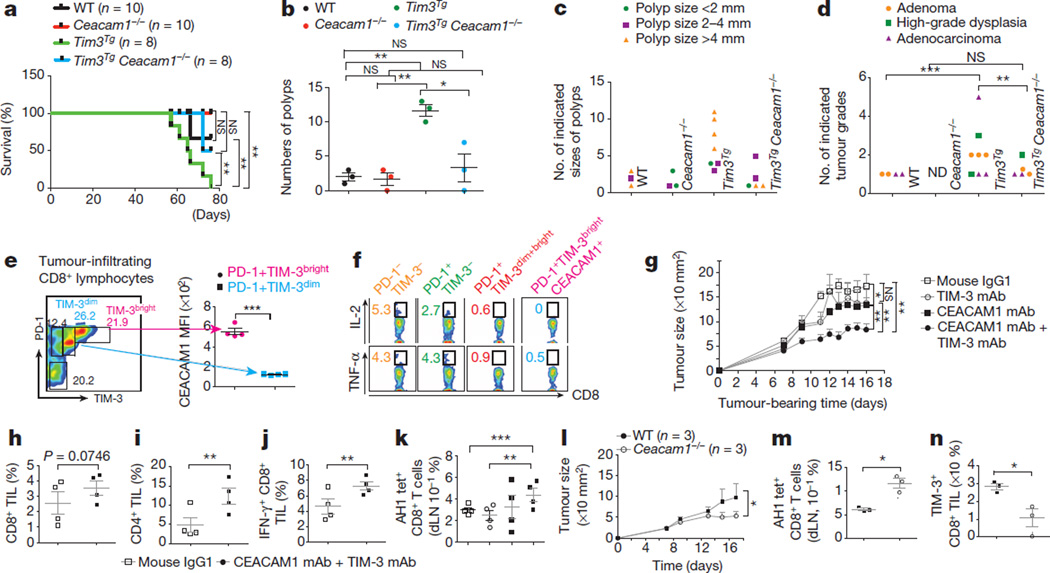
T-cell immunoglobulin domain and mucin domain-3 (TIM-3, also known as HAVCR2) is an activation-induced inhibitory molecule involved in tolerance and shown to induce T-cell exhaustion in chronic viral infection and cancers. Under some conditions, TIM-3 expression has also been shown to be stimulatory. Considering that TIM-3, like cytotoxic T lymphocyte antigen 4 (CTLA-4) and programmed death 1 (PD-1), is being targeted for cancer immunotherapy, it is important to identify the circumstances under which TIM-3 can inhibit and activate T-cell responses. Here we show that TIM-3 is co-expressed and forms a heterodimer with carcinoembryonic antigen cell adhesion molecule 1 (CEACAM1), another well-known molecule expressed on activated T cells and involved in T-cell inhibition. Biochemical, biophysical and X-ray crystallography studies show that the membrane-distal immunoglobulin-variable (IgV)-like amino-terminal domain of each is crucial to these interactions. The presence of CEACAM1 endows TIM-3 with inhibitory function. CEACAM1 facilitates the maturation and cell surface expression of TIM-3 by forming a heterodimeric interaction in cis through the highly related membrane-distal N-terminal domains of each molecule. CEACAM1 and TIM-3 also bind in trans through their N-terminal domains. Both cis and trans interactions between CEACAM1 and TIM-3 determine the tolerance-inducing function of TIM-3. In a mouse adoptive transfer colitis model, CEACAM1-deficient T cells are hyper-inflammatory with reduced cell surface expression of TIM-3 and regulatory cytokines, and this is restored by T-cell-specific CEACAM1 expression. During chronic viral infection and in a tumour environment, CEACAM1 and TIM-3 mark exhausted T cells. Co-blockade of CEACAM1 and TIM-3 leads to enhancement of anti-tumour immune responses with improved elimination of tumours in mouse colorectal cancer models. Thus, CEACAM1 serves as a heterophilic ligand for TIM-3 that is required for its ability to mediate T-cell inhibition, and this interaction has a crucial role in regulating autoimmunity and anti-tumour immunity.


Figures

Extended Data Figure 1
Extended Data Figure 1. CEACAM1 is essential for TIM-3 mediated T cell tolerance
a, Schematic diagram of OVA antigen-specific tolerance induction model. b, Schematic diagram of OVA immunization. c, Tracking in vivo antigen-specific T-cell responses of CFSE-labelled OT-II transgenic Rag2−/−T cells in total lymphocyte gate of mesenteric lymph nodes, peripheral lymph node or spleen of wild-type or Ceacam1−/− recipients after gating on CFSE-positive cells and staining for CEACAM1 in PBS and OVA323–339 immunized mice. Hyper-responsiveness of OT-II transgenic Rag2−/− T cells in Ceacam1−/− mice was not due to decreased regulatory T-cell induction (data not shown) or increased initial parking on the basis of cell numbers shown. d, TIM-3 expression on CEACAM1-positive and -negative CFSE+ cells as in c. e, Schematic diagram of SEB-induced T-cell tolerance model. f, mCEACAM1 and mTIM-3 expression on CD4+ Vβ8+ T cells after SEB tolerance induction. g, hCEACAM1 and hTIM-3 expression on activated primary human T cells defined by staining with indicated antibodies. h, CEACAM1 expression on TIM-3-silenced primary human T cells after re-activation by flow cytometry. Relative TIM-3, CEACAM1 or CD4 expression on T cells expressing control shRNA (lacZ control, red) or three independent shRNAs directed at TIM3 (overlay, blue). shRNA target sequences shown. il, CEACAM1 and TIM-3 expression and functional consequences on T cells in HIV infection. CD4+ IFN-γ+ T cells are decreased among CEACAM1+ TIM-3+ CD4+ T cells in HIV infection in response to Gag peptides (i). Although proportions of CEACAM1+ TIM-3+ CD8+ T cells are similar in HIV-infected and -uninfected subjects (j), CEACAM1+ TIM-3+ CD8+ T cells express little IFN-γ after stimulation with HIV Gag peptides or SEB relative to TIM-3+ CEACAM1 CD8+ T cells (k, l). C, hCEACAM1; T, hTIM-3 (n = 4 per group, mean ± s.e.m.). mo, In situ proximity ligation analysis (PLA) of CEACAM1 and TIM-3. m, HEK293T cells transiently co-transfected with Flag–hCEACAM1 or HA–hTIM-3. Cells stained with DAPI (left), anti-tubulin (middle), anti-HA (rabbit) and anti-Flag (mouse) (middle right) or merged (right). Several examples of a positive PLA signal (middle right and right panels: red fluorescent dots) indicative of a maximum distance of 30–40 nm between hCEACAM1 and hTIM-3. n, Negative control, co-expression of Flag–PLK1 (protein kinase I) and HA–TIM-3 failed to generate fluorescent dots (that is, PLA negative). Cells stained with DAPI, anti-tubulin, anti-HA/anti-Flag or merged as in m. o, Negative control, co-expression of HA–ADAP (adhesion and degranulation promoting adaptor protein) failed to show a signal (that is, PLA negative) with staining as in m. p, q, CEACAM1 and TIM-3 colocalization at immunological synapse of primary human CD4 and CD8 T cells. Confocal microscopy of hTIM-3+ hCEACAM1+ primary CD4+ and CD8+ T cells forming conjugates with SEB-loaded B cells. DIC, differential interference contrast. Blue denotes B cell; red denotes CD3; purple denotes CEACAM1; green denotes TIM-3. White indicates colocalization between CEACAM1 and TIM-3 (p). Average Pearson correlation coefficients for CD4+ and CD8+ T cells were 0.543 and 0.566, respectively, representing strong co-localization (q). Data are mean ± s.e.m. and representative of five (f, g), four (p, q), three (c, d, m–o) and two (h) independent experiments. *P < 0.05; **P < 0.01; ***P < 0.001.
Extended Data Figure 2
Extended Data Figure 2. Structural similarities between CEACAM1 and TIM-3 IgV-like N-terminal domains and biochemical association
a–c, Interaction between TIM-3–Ig fusion protein and membrane protein of 60 kDa after deglycosylation derived from surface-biotinylated TK-1 cells. TIM-3–Ig fusion proteins and human IgG-precipitated proteins were deglycosylated by PNGase F and separated by SDS–PAGE. TIM-3–Ig-binding membrane proteins detected by immunoblot. A 60-kDa membrane protein (red circles) and 32-kDa protein consistent with galectin-9 (black circles) are found specifically associated with soluble (s) TIM-3–Ig fusion protein (a, lane 5) and full-length (f) TIM-3–Ig proteins (b, lane 5), but not with the pre-clear controls (lanes 3 and 4) or human IgG (lanes 2 and 6). c, sTIM-3–Ig and full-length (fl) TIM-3–Ig interacting proteins were de-glycosylated by PNGase F and separated by SDS–PAGE. Proteins detected by silver staining. A band of 60kDa (red circle) isspecifically associated with sTIM-3–Ig proteins (lane 2), but not with human IgG (lane 5), or TIM-1–Ig or TIM-4–Ig (lanes 3, 4, 6–10). d, Superimposition of previously described IgV-like domains of mCEACAM1 and mTIM-3 demonstrate structural similarity with a score of 2.42 by the structural alignment and root mean square deviation (r.m.s.d.) calculated by Pymol. e, Sequence alignment of the IgV-like domains of mCEACAM1 and mTIM-3 on the basis of the secondary structure alignment in d. f, Sequence alignments of IgV domain sequences of CEACAM1 and overall mTIM and hTIM family members. α helices (orange) and β strands (blue) denoted as underlined segments in hCEACAM1 and mTIM-3. β strands labelled with upper- and lower-case letters for hCEACAM1 and mTIM-3, respectively. Conserved residues are shaded red. Mutated residues are shaded violet for hCEACAM1, and green for hTIM-3. Asterisk (*) indicates positions having a single, fully conserved residue; a dagger (†) indicates conservation between groups of weakly similar residues; a double-dagger (‡) indicates conservation between groups of strongly similar residues. g, Computational modelling as defined by energy calculations (score) relative to r.m.s. values of docking models to define potential cis and trans interfaces between mCEACAM1 and mTIM-3 as described in Supplementary Information and amino acids involved. h, CEACAM1 expression on mouse fibroblast 3T3 cells used to identify a galectin-9-independent ligand. i, CEACAM1 expression on mouse TK-1 cells as in a–c. Representative of three (a–c, h, i) independent experiments.
Extended Data Figure 3
Extended Data Figure 3. Biochemical characterization of interactions between CEACAM1 and TIM-3
a, hTIM-3 does not co-immunoprecipitate (co-IP) with ITGA5 despite interactions with hCEACAM1. HEK293T cells transfected with Flag–ITGA5 and HA–TIM-3 (ITGA5Tw) or Flag–CEACAM1 and HA–TIM-3 (CwTw). Immunoprecipitation with anti-HA antibody and immunoblotted (IB) with anti-Flag antibody are shown. Input represents anti-Flag immunoblot of lysates. b, Co-immunoprecipitation of human TIM-3 and CEACAM1 from activated primary human T cells after N-glycanase treatment of lystates followed by immunoprecipitation with anti-human TIM-3 antibodies (2E2, 2E12 or 3F9) or IgG as control and immunoblotted with anti-human CEACAM1 antibody (5F4). Protein lystates from HeLa-CEACAM1 transfectants treated with N-glycanase followed by immunoprecipitation with 5F4 and the immune complex used as positive control (pos). c, mTIM-3 interacts with mCEACAM1 in mouse T cells. Splenocytes from Ceacam14STg Ceacam1−/− and Ceacam1-4LTg Ceacam1−/− mice cultured with anti-CD3 (1 μg ml−1) or anti-CD3 (1 μg ml−1) and anti-CD28 (1 μg ml−1) or medium for 96 h. Cell lysates immunoprecipitated with anti-mCEACAM1 antibody (cc1) or with mIgG and IB with 5D12 (anti-mTIM-3 antibody) are shown. Locations of mTIM-3 protein variants are indicated. CHO, carbohydrate. d, Immunoprecipitation and immunoblot as in a with tunicamycin treated, wild-type HA–hTIM-3 and Flag–hCEACAM1 co-transfected HEK293T cells. Arrowhead denotes core CEACAM1 protein. e, Potential hCEACAM1-interacting residues on hTIM-3 highlighted in blue. f, HEK293 T cells transiently co-transfected with Flag–hCEACAM1 and HA–hTIM-3 mutants. Immunoblotting of anti-HA were used to analyse hTIM-3 expression in HEK293T transfectants. Except for Pro50Ala mutation displaying enhanced overall protein expression, all other mutations in the IgV domain of hTIM-3 are equally detected by anti-HA antibody. g, Quantification of association of hTIM-3 mutants associated with wild-type hCEACAM1 shown in Fig. 2c summing all experiments performed. Association between wild-type hCEACAM1 and hTIM-3 core protein are depicted as reference (set as 1, n = 3, mean ± s.e.m. shown, unpaired Student’s t-test). h, Immunoprecipitation with anti-Flag (hCEACAM1) and immunoblot with anti-HA (hTIM-3) or anti-Flag of wild-type hCEACAM1 and mutant hTIM-3 proteins are shown. i, Quantification of h as performed in g. j, HEK293T cells co-transfected with Flag–hCEACAM1 wild-type and HA– hTIM-3 mutants and immunoprecipitation/immunblot as in h revealing no effects of Cys52Ala or Cys63Ala mutations in hTIM-3 in affecting association with hCEACAM1 in contrast to Cys109Ala mutation of hTIM-3 that disrupts interactions with hCEACAM1. k, Potential hTIM-3-interacting-residues around the FG–CC′ cleft of hCEACAM1 highlighted in red. l, HEK293T cells transiently co-transfected with Flag–hCEACAM1 mutants and wild-type HA–hTIM-3. Immunoblot with anti-Flag antibody was used to analyse hCEACAM1 expression in HEK293T co-transfectants. All hCEACAM1 mutations in IgV domain equally detected. m, Densitometric quantification of IgV domain hCEACAM1 mutations associating with wild-type HA–hTIM-3 described in Fig. 2d. n–p, Analysis of Gly47Ala mutation of hCEACAM1 in hTIM-3 co-transfected HEK293T cells by immunoprecipitation with anti-HA (hTIM-3) and immunoblot with anti-Flag (hCEACAM1) to detect association (n), IB with anti-Flag to confirm similarity of hCEACAM1 transfection (o) and quantification of associated hCEACAM1 of n as shown in m. q–s, Analysis of hCEACAM1 mutants Asn42Ala and Arg43Ala association with hTIM-3 (q), similarity of transfections (r) and quantification of q as in n–p. Representative of four (d, h), three (f, g, i, l–s), two (a–c) and one (j) independent experiments. *P < 0.05; **P < 0.01; ***P < .001.
Extended Data Figure 4
Extended Data Figure 4. Structural analysis of hCEACAM1 and hTIM-3 protein interactions
a, Schematic diagram of single-chain construct consisting of hCEACAM1 IgV-domain (amino acids 1–107), a linker consisting of (GGGGS)4 and hTIM-3 IgV-domain (amino acids 1–105) and C-terminal hexahistidine tag. b–e, Surface plasmon resonance analyses of hCEACAM1–hTIM-3 single-chain interaction with GST–hTIM-3. b, Representative sensorgrams of serial dilutions of hCEACAM1–hTIM-3 single chain flowed over immobilized GST–hTIM-3 or GST alone. c, Representative sensorgrams of 600nM hCEACAM1–hTIM-3 single-chain flowed over immobilized GST–hTIM-3 in presence of various concentrations of blocking hTIM-3 specific peptide (amino acids 58–77) or control scrambled peptide. d, Representative sensorgrams as in b in presence of various concentrations of anti-hCEACAM1 monoclonal antibody (26H7) or control isotype antibody (mIgG1, MOPC). e, Bar graphs represent resonance units upon equilibrium (RUEq) of above treatments with mean ± s.e.m. shown from >three runs. GST–hTIM-3 immobilized by amine coupling. Dilutions of hCEACAM1–hTIM-3 single chain, hCEACAM1–hTIM-3 single chain with either blocking hTIM-3-specific peptide, control scrambled peptide, and 26H7 antibody or control MOPC antibody were injected over immobilized GST–hTIM-3 at 25 °C. Flow rate was 25 μl min−1f, g, 2Fo – 2Fc maps contoured at 0.9σ showing electron densities for X-ray crystal structure of single chain hCEACAM1–hTIM-3 (PDB code 4QYC). h, Summary of crucial amino acid residues defined biochemically and structurally. i–k, Similarity between apo-hCEACAM1 and hTIM-3-associated CEACAM1. Structure of CEACAM1 homodimer at 2.0 Åresolution (PDB code4QXW) (i).Homophilic ‘YQQN’ concavity indicated consisting of residues Tyr 34, Gln 44, Gln 89 and Asn97 at hCEACAM1 (IgV)–hCEACAM1 (IgV) interface (j). Superimposition of IgV domain of hCEACAM1 monomer (orange) from i on hCEACAM1 (green) from hCEACAM1–hTIM-3 heterodimer in Fig. 2e (k). Representative of three (b–e) independent experiments. ***P < 0.001.
Extended Data Figure 5
Extended Data Figure 5. CEACAM1 determines TIM-3 expression and function
a, HEK293T cells transiently co-transfected with Flag–hCEACAM1 and wild-type or mutants of HA–hTIM-3. Flow cytometry detecting HA–hTIM-3 (detected with anti-HA) and Flag–hCEACAM1 (detected with 5F4) proteins at cell surface (top), Golgi apparatus (middle) or endoplasmic reticulum (bottom) using monensin and brefeldin A, respectively. b, Cellular distribution of wild-type or mutant hTIM-3 when co-expressed with wild-type hCEACAM1. Total counts of hTIM-3 at surface, Golgi apparatus and endoplasmic reticulum summed up to 100%. Depicted as percentage of hTIM-3. c, HEK293T cells transiently co-transfected with wild-type HA–hTIM-3 (detected with 2E2) and wild-type or mutant Flag–hCEACAM1 (detected with anti-Flag). Flow cytometry analyses as in a. d, Cellular distribution of c, as in b. Depicted as percentage of hTIM-3. e, Immunoblot for wild-type or Thr101Ile variant of hTIM-3 showing maturation status in presence of wild-type or mutated (Gln44Leu) hCEACAM1. f, Normal association of Thr101Ile variant of hTIM-3 with hCEACAM1. g, Analysis of CD4+ Vβ8+ T cells after SEB tolerance induction from experimental mice of indicated genotypes. h, Galectin-9 induction of apoptosis. Annexin V+ propidium iodide staining of TH1 cells polarized from Tim3Tg or Tim3Tg Ceacam1−/− mice after treatment with galectin-9 (2 μg ml−1) for 8 h. Note decreased apoptosis in Tim3Tg Ceacam1−/− T cells. i, Schematic diagram of protocol used for protein pull-down using in-column IgV domain of GST–hTIM-3 incubated with hCEACAM1 protein derived from transfected HEK293T cells as in Fig. 2m. j, GST or GST–hTIM-3 staining of hCEACAM1-4L–transfected Jurkat T cells. k, Wild-type CD4+ T cells stimulated with anti-CD3 and/or anti-CD28 in the presence or absence of mCEACAM1 NFc, or IgG1-Fc as control, and cells analysed for secretion of IFN-γ and IL-2. l, m, Characterization of tolerance in SEB model. Tim3Tg(l) and Tim3Tg Ceacam1−/−(m) mice treated with SEB with schedule described in Extended Data Fig. 1e. Lymph node cells collected after SEB treatment and re-stimulated with soluble anti-CD3 at indicated doses and IL-2 measured by ELISA after 72 h. Note tolerance in Tim3Tg but not Tim3Tg Ceacam1−/−mice. n = 3 per group. n, Anti-mTIM-3 blockade with 2C12 antibody of mCEACAM1 NFc or control IgG-Fc staining of CD4+ T cells from indicated genotypes expressed as levels relative to Ceacam1−/− mice. o, p, Analysis of mTIM-3 cytoplasmic tail function in transmitting mCEACAM1-induced signals. Activated mouse CD4+ T cells from wild-type (o) or Ceacam1−/−(p) mice were retrovirally transduced, sorted and stimulated with anti-CD3 with either human IgG-Fc (IgG, control) or mCEACAM1 N-terminal domain as NFc and TNF-α secretion assessed by ELISA after 72 h. Note ability of CEACAM1 N-terminal domain to transduce a signal associated with inhibition of TNF-α secretion in wild-type but not Ceacam1−/− T cells. n = 3 per group. Data are mean ± s.e.m. and represent three (f, g, k–p) and two (a–e, h, j) independent experiments. *P < 0.05; **P < 0.01; ***P < .001.
Extended Data Figure 6
Extended Data Figure 6. CEACAM1 and TIM-3 cooperatively regulate inflammation and anti-tumour immunity
a, Representative haematoxylin and eosin staining of groups described in Fig. 3e. Scale bar, 50 μm. b, Flow cytometry for intracellular cytokine assessment of TNF-α expression from infiltrating CD4+ T cells from inflamed colonic lamina propria of Ceacam1−/− Rag2−/− recipients, 6weeks after transfer with naive CD4+ CD44lo CD62Lhigh T cells from indicated genotypes. c, Anorectal prolapse of indicated genotypes. d, Representative haematoxylin and eosin staining of groups described in Fig. 3g. Scale bar, 50 μm. e, RNA expression defined by nanostring of lamina propria mononuclear cells in indicated groups (mean of n = 3 per group). f, Schematic overview of protocol for AOM/DSS colitis-associated cancer model. g, Representative haematoxylin and eosin staining of colon from wild-type mice in AOM/1.5% DSS model. Scale bar, 50 μm; h, Representative photograph of distal colons of wild-type mice (n = 3 per group, anorectal junction at left end) in AOM/1.5% DSS model. Vertical arrows show the sites for dissection of the polyps (black) and the vicinity of the polyps (red). i, Representative flow cytometry analyses on infiltrating lymphocytes of invading distal colonic polyps or from the vicinity of the polyps or from mesenteric lymph nodes for CD4+ and CD8+ T cells and expression of CEACAM1 and TIM-3orPD-1 and TIM-3. Note that vicinity of polyps exhibit highest numbers of T cells with an exhausted phenotype. j, Summary of flow cytometry on infiltrating lymphocytes from invading distal colonic polyps or from vicinity of polyps and from mesenteric lymph nodes for CD4+ and CD8+ T cells expressing CEACAM1 and TIM-3 or PD-1 and TIM-3 (n = 3, median shown). k, Representative pathology in AOM/1.5% DSS model. Scale bar, 60 μm. HGD, high grade dysplasia. Representative of three independent experiments (a–e, g–k).
Extended Data Figure 7
Extended Data Figure 7. Blockade of CEACAM1 and TIM-3 or genetic loss of CEACAM1 increases anti-tumour immunity
a, Schematic presentation of antibody blockade protocol described in Fig. 4g. b, Schematic presentation of antibody blockade protocol referred to in panel c. c, Prevention of CT26 tumour growth with indicated combinations of antibodies as in (b) (n = 5 per group, post-hoc Dunnett’s correction followed by Friedman test). d, Schematic of schedule used for therapeutic antibody administration as described in e. e, Synergy of CEACAM1 and programmed death-ligand1 (PD-L1) blockade in a therapeutic protocol as described in d was performed in wild-type BALB/c mice that received a subcutaneous inoculation of CT26 tumour cells. Mean tumour size (n = 5 per group, with linear regression analysis). Note synergistic increase in anti-tumour effect when CEACAM1 and PD-L1 co-blockade was performed. f, TILs were analysed for the relative proportion of CD4+ T cells that produced IL-10 as in Fig. 4g (n = 4, unpaired Student’s t-test with Mann–Whitney U correction). g, Percentages of CD8+ T cells from spleen show that antibody treatments have no effects on total CD8+ T cell numbers (n = 7/8, unpaired two-tailed t-test). h, Negative correlation of the numbers of AH1 tet+ CD8+ T cells and the size of tumours in the draining lymph nodes from the tumour-bearing mice in Fig. 4g (Pearson’s correlation coefficient, r = 0.9560, P = 0.044). i, Representative flow cytometry for tumour-specific (AH1-tetramer, tet+) CD8+ T cells in draining lymph nodes of mice from the indicated genotypes. Data are mean ± s.e.m. and represent three (f–i), two (e) and one (c) independent experiments. *P < 0.05; ***P < 0.001.
Figure 1
Figure 1. TIM-3 and CEACAM1 are co-expressed on T cells during induction of tolerance
a, b, Tolerance induction in indicated mice. Median c.p.m., counts per minute. c, d, Responses of CFSE-labelled transgenic OT-II Rag2−/− T cells in mesenteric lymph nodes (MLN), peripheral lymph node (LN) or spleen of wild-type (WT) or Ceacam1−/− recipients to PBS (n = 3 per group) or OVA (n = 5 per group) for proliferation (c) and CEACAM1 or TIM-3 (d) expression. ND, not detectable. e, hCEACAM1 and hTIM-3 expression in co-transfected HEK293T cells. Percentage and mean fluorescence intensity (MFI) of hTIM-3 indicated. BFA, brefeldin A; ER, endoplasmic reticulum. f, hCEACAM1 and hTIM-3 expression on activated primary CD4+ human T cells. g, h, CEACAM1+ TIM-3+ CD4+ T cells (g) and intracellular cytokine staining for IFN-γ in CD4+ T cells after SEB stimulation (h) in HIV infection. C, CEACAM1; T, TIM-3 (n = 4 per group). i, In situ proximity ligation assay of hCEACAM1 and hTIM-3 co-transfected HEK293T as in e. DAPI, 4′,6-diamidino-2-phenylindole. All data are mean ± s.e.m. and represent five (e, f), three (c, d, i) and two (a, b) independent experiments. *P < 0.05; **P < 0.01; ***P < 0.001.
Figure 2
Figure 2. CEACAM1 and TIM-3 heterodimerize and serve as heterophilic ligands
a, b, Co-immunoprecipitation (IP) and immunoblot (IB) of wild-type hCEACAM1 and hTIM-3 in co-transfected HEK293T cells, c, d, Co-immunoprecipitation and immunoblot of wild-type hCEACAM1 and hTIM-3 mutants (c) or wild-type hTIM-3 and hCEACAM1 mutants (d) as in a and b. e, Human CEACAM1 (IgV)-TIM-3 (IgV) heterodimer structure, f, g, 2Fo — Fc maps contoured at 0.9σ showing electron densities, h, i, Autoradiogram of anti-haemagglutinin (HA) (hTIM-3) immunoprecipitate from metabolic-labelled (h) and pulse-chase metabolic-labelled (i) co-transfected HEK293T cells. CHO, carbohydrate; core T, non-glycosylated hTIM-3; Cw, wild-type hCEACAM1; EndoH, endoglycosidaseH; H2-MA, HA-tagged influenza virus A M2 protein; T, hTIM-3 (Thr101Ile); Tw, wild-type hTIM-3. hTIM-3 isoforms noted. j, Quantification of densities in i (n = 3 per group). k, Immunoblot for mTIM-3 from PBS-treated (−) or SEB-treated (+) CD4+ T cells. Labelling as in h and i. 1, mTIM-3 expression after SEB tolerance induction, m, Column-bound glutathione S-transferase (GST)-hTIM-3 IgV-domain pull-down of hCEACAM1 detected by immunoblot. GST2, GST-hTIM-3 dimer. Ft, flow through, n, Suppression of mouse CD4+ T-cell proliferation by mCEACAM1 N-terminal domain-Fc fusion protein (NFc). o, Immunoprecipitation of mTIM-3 and immunoblot for BAT3 or mTIM-3 from lysates of CD4+ T cells. p, q, Proliferation of CD4+ T cells from wild-type (p) and CeaCAM1−/−(q) mice transduced with wild-type mTIM-3 (Tw), mTIM-3Δ252–281 (Tmut) or vector exposed to anti-CD3 and either NFc or IgG1-Fc (IgG1). Data are mean ± s.e.m. and represent five (a, b), four (c, d), three (h-j, l, n, p, q) and two (k, m, o) independent experiments. NS, not significant; *P < 0.05; **P < 0.01; ***P < 0.001.
Figure 3
Figure 3. TIM-3 regulation of mucosa-associated inflammation requires CEACAM1
a, mCEACAM1 and mTIM-3 expression on colonic lamina propria CD4+ T cells, b, Intracellular cytokines in cells described in a. c, d, mTIM-3 (c) and intracellular TNF-α (d) expression in lamina propria CD4+ T cells from indicated donors, e, Body weights relative to weights on day 14 of groups in c and d. Five mice expired (†). f, Score of surviving mice of groups in e. g, Body weights of genotypes as in e. h, Score of groups described in g. i, j, Nanostring (i) and quantitative PCR (j) of lamina propria mononuclear cells. Actb, β-actin gene. All data are mean ± s.e.m. and represent six (a), four (b) and three (c–j) independent experiments. *P < 0.05; **P < 0.01; ***P < 0.001.
Figure 4
Figure 4. CEACAM1 determines TIM-3 regulation of anti-tumour immune responses
a, Survival curves in AOM/2.5% DSS model. b–d, Assessment of polyp numbers (b), polyp size (c) and cancer grades (d) in AOM/1.5% DSS model, e, Staining of CD8+ T cells associated with CT26 tumours. f, Intracellular cytokine expression in TIL subsets after anti-CD3 stimulation. g, Prevention of CT26 tumour growth in wild-type mice (n = 5 per group). mAb, monoclonal antibody. h–k, Analysis of TILs for relative proportion of CD8+ (h) and CD4+ (i) T cells, IFN-γ+ CD8+ T cells (j) and tumour-specific (AH1-tetramer, tet+) CD8+ T cells in draining lymph nodes (dLN) (k) in groups described in g. l–n, Growth of CT26 cells (1), AH1 tet+ CD8+ T cells in dLN (m) and TIM-3 expression on TILs (n) in wild-type and CeaCAM1−/− mice. Data are mean ± s.e.m. and represent four (e), three (g–k) and two (a–d, f, l–n) independent experiments. *P < 0.05; **P < 0.01; ***P < 0.001.

References

    1. Monney L, et al. Th1-specific cell surface protein Tim-3 regulates macrophage activation and severity of an autoimmune disease. Nature. 2002;415:536–541. - PubMed
    1. Sabatos CA, et al. Interaction of Tim-3 and Tim-3 ligand regulates T helper type 1 responses and induction of peripheral tolerance. Nature Immunol. 2003;4:1102–1110. - PubMed
    1. Sánchez-Fueyo A, et al. Tim-3 inhibits T helper type 1-mediated auto-and alloimmune responses and promotes immunological tolerance. Nature Immunol. 2003;4:1093–1101. - PubMed
    1. Jones RB, et al. Tim-3 expression defines a novel population of dysfunctional T cells with highly elevated frequencies in progressive HIV-1 infection. J. Exp. Med. 2008;205:2763–2779. - PMC - PubMed
    1. Sakuishi K, et al. Targeting Tim-3 and PD-1 pathways to reverse T cell exhaustion and restore anti-tumor immunity. J. Exp. Med. 2010;207:2187–2194. - PMC - PubMed

Publication types

MeSH terms