. 2015 Jan 22;517(7535):489-92.
doi: 10.1038/nature13898. Epub 2014 Nov 2.

The mutational landscapes of genetic and chemical models of Kras-driven lung cancer

Affiliations

The mutational landscapes of genetic and chemical models of Kras-driven lung cancer

Peter M K Westcott et al. Nature. .

Abstract

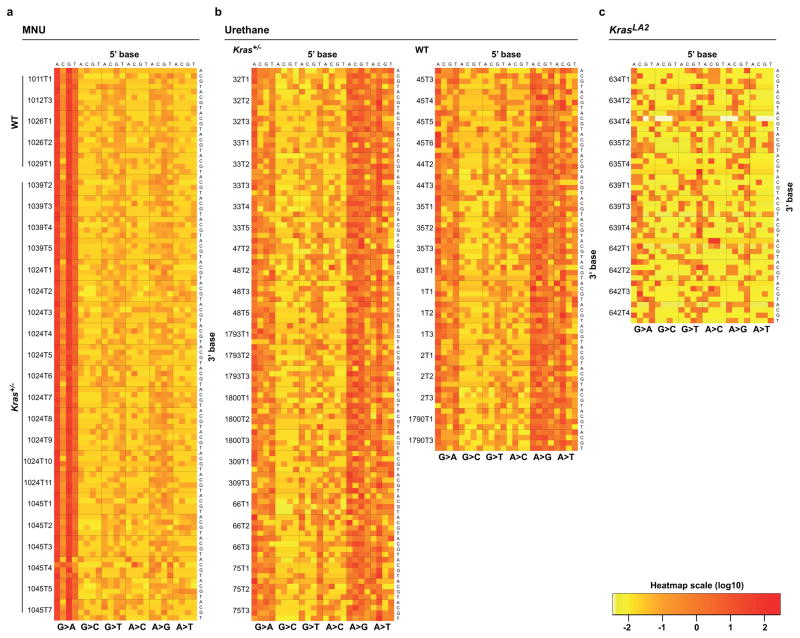
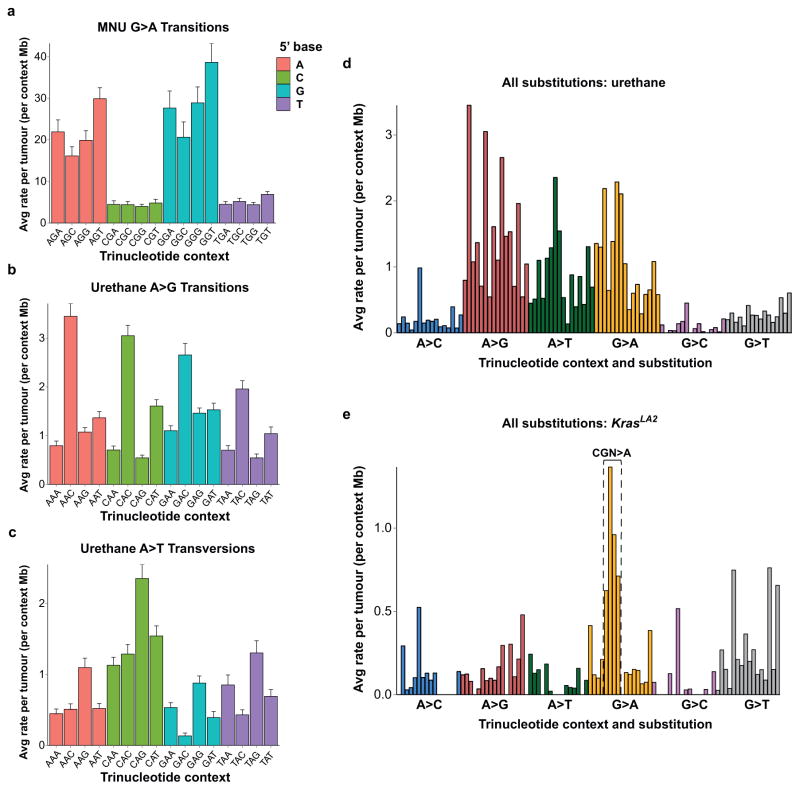
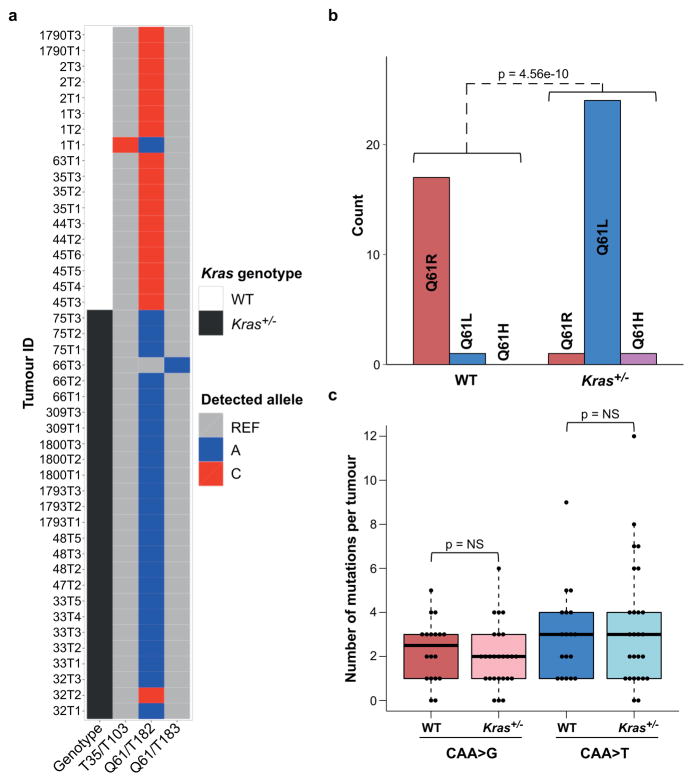
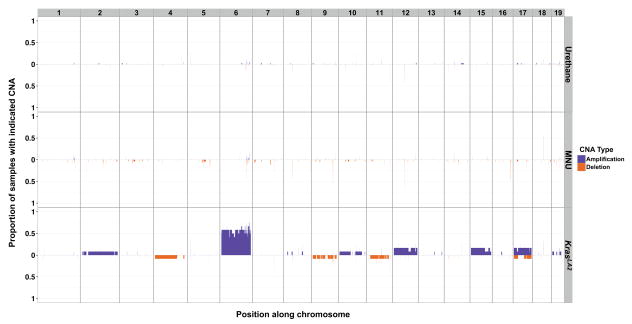
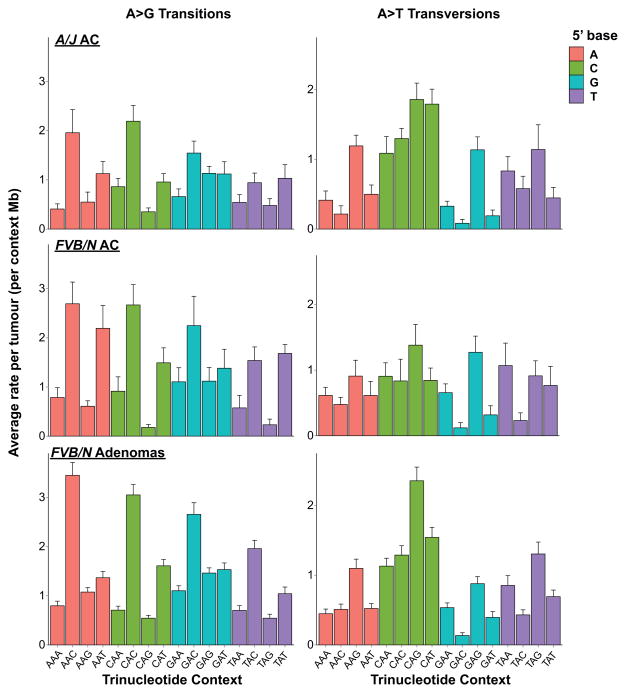
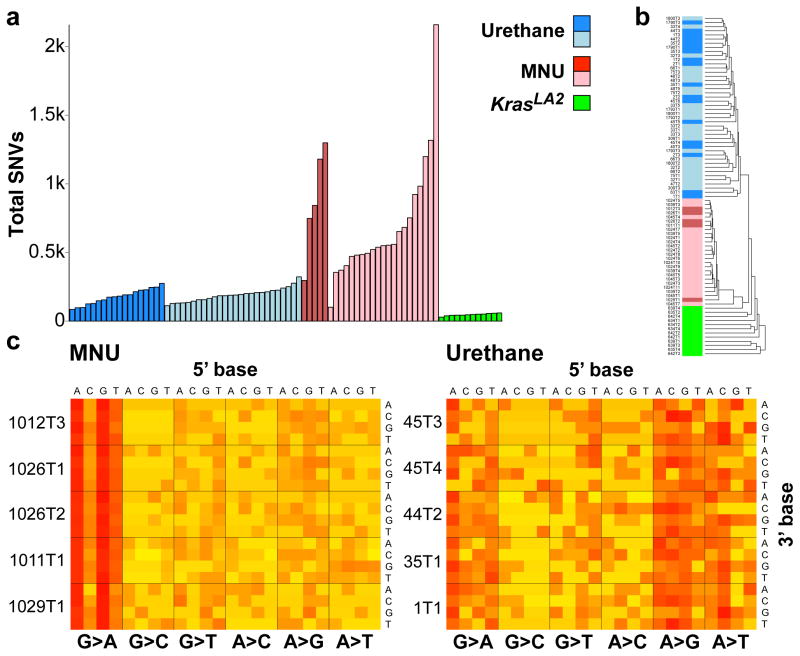
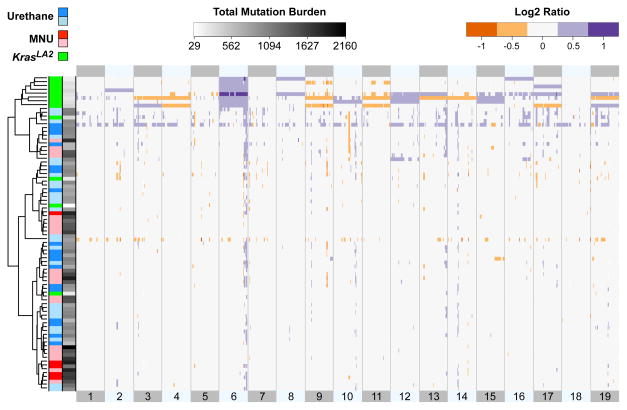
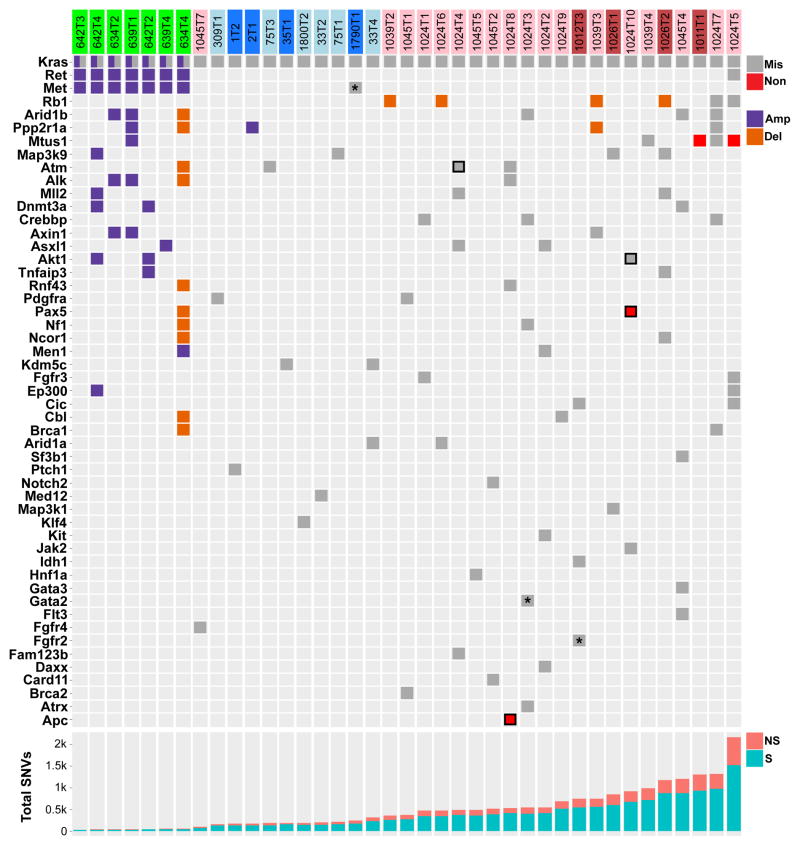
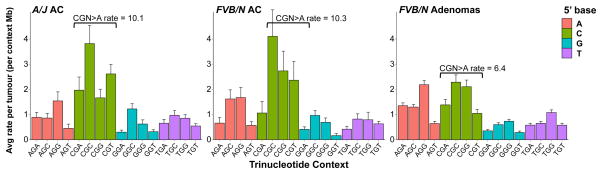
Next-generation sequencing of human tumours has refined our understanding of the mutational processes operative in cancer initiation and progression, yet major questions remain regarding the factors that induce driver mutations and the processes that shape mutation selection during tumorigenesis. Here we performed whole-exome sequencing on adenomas from three mouse models of non-small-cell lung cancer, which were induced either by exposure to carcinogens (methyl-nitrosourea (MNU) and urethane) or by genetic activation of Kras (Kras(LA2)). Although the MNU-induced tumours carried exactly the same initiating mutation in Kras as seen in the Kras(LA2) model (G12D), MNU tumours had an average of 192 non-synonymous, somatic single-nucleotide variants, compared with only six in tumours from the Kras(LA2) model. By contrast, the Kras(LA2) tumours exhibited a significantly higher level of aneuploidy and copy number alterations compared with the carcinogen-induced tumours, suggesting that carcinogen-induced and genetically engineered models lead to tumour development through different routes. The wild-type allele of Kras has been shown to act as a tumour suppressor in mouse models of non-small-cell lung cancer. We demonstrate that urethane-induced tumours from wild-type mice carry mostly (94%) Kras Q61R mutations, whereas those from Kras heterozygous animals carry mostly (92%) Kras Q61L mutations, indicating a major role for germline Kras status in mutation selection during initiation. The exome-wide mutation spectra in carcinogen-induced tumours overwhelmingly display signatures of the initiating carcinogen, while adenocarcinomas acquire additional C > T mutations at CpG sites. These data provide a basis for understanding results from human tumour genome sequencing, which has identified two broad categories of tumours based on the relative frequency of single-nucleotide variations and copy number alterations, and underline the importance of carcinogen models for understanding the complex mutation spectra seen in human cancers.


Conflict of interest statement

COMPETING FINANCIAL INTERESTS

The authors declare no competing financial interests.

Figures

Extended Data Figure 1
Extended Data Figure 1. Distinct and consistent mutation spectra across tumours from carcinogen and genetic models
a–c, Stacked heatmaps displaying the mutation spectra of all MNU-induced, a, urethane-induced, b, and KrasLA2, c, tumours, shown as normalized frequencies of all 96 possible substitutions. Substitutions are shown below each heatmap, with 5′- and 3′-flanking base context displayed on the top and right, respectively. Tumour ID is shown to the left of each heatmap.
Extended Data Figure 2
Extended Data Figure 2. Highly specific mutation signatures
a, Breakdown of G>A transitions in MNU-induced tumours. 5′-flanking purine versus pyrimidine G>A substitutions, and 3′-flanking thymidine versus all other G>A substitutions, are highly significant (p < 0.0003, Wilcoxon rank-sum test). b–c, Breakdowns of A>G transitions, b, and A>T transversions, c, in urethane-induced tumours. d–e, All 96 substitutions in urethane-induced, d, and KrasLA2 tumours, e. In e, the CGN>A (NCG>T) signature mutations of genomic instability are denoted. Mutation counts per tumour were normalized to total length of sequenced trinucleotide contexts in each tumour and averaged. Error bars represent SEM.
Extended Data Figure 3
Extended Data Figure 3. Kras G12D induces tumours with different histologies than codon 61 mutants
a, Representative papillary, solid, and mixed tumour histologies (200x magnification). b, Breakdown of different histologies in each treatment group. Histologies from KrasLA2 and MNU groups were significantly different than those from urethane, but there was no significant difference between KrasLA2 and MNU (Fisher Exact test, Holm’s correction for multiple comparisons).
Extended Data Figure 4
Extended Data Figure 4. Germline Kras genotype influences mutation specificity in urethane-induced tumours
a, Kras mutant alleles for urethane tumours are plotted as colored squares for all three oncogenic alleles detected in these tumours. Kras genotype is indicated as either white (WT) or black (heterozygous) squares. b, Highly significant switch in Kras codon 61 mutations between tumours from WT mice and Kras+/− mice (Fisher Exact test). c, No significant difference was seen between the exome-wide rates of causative Kras Q61R (CAA>G) and Q61L (CAA>T) mutations between tumours from WT and Kras+/− mice (Wilcoxon rank-sum test).
Extended Data Figure 5
Extended Data Figure 5. MTUS1 is a tumour suppressor in mouse and human lung cancer
a, qRT-PCR quantification of siRNA knockdown of Mtus1 in a Kras G12D mouse lung cancer cell line (K493.1) (Wilcoxon rank-sum test). b, MTT assay shows increased growth following Mtus1 knockdown (Wilcoxon rank-sum test). Four independent trials were performed and growth was significantly increased by day 3 after knockdown in each experiment. One representative trial is shown. c, MTUS1 expression is significantly associated with overall survival in human lung adenocarcinoma, p=0.00097, χ2=10.9. Analysis was performed using clinical covariates gender, age, pack years smoked, and stage.
Extended Data Figure 6
Extended Data Figure 6. Proportion of tumours with CNAs in each treatment group
Amplifications and deletions were defined as regions with a log2 ratio greater than 0.5 or less than −0.5, respectively. Chromosomes are arranged on the X axis in a head-to-tail formation.
Extended Data Figure 7
Extended Data Figure 7. Histological confirmation of lung adenocarcinomas
a–b, Representative histologies (400x magnification) of A/J, a, and FVB/N, b, adenocarcinomas. Zoom insets show tumour cell crowding and scattered mitotic figures (black arrowheads), nuclear atypia including enlargement and moderate pleomorphism, nuclear membrane irregularity, and prominent nucleoli. Scale bar = 20 μm.
Extended Data Figure 8
Extended Data Figure 8. Comparison of urethane-signature mutations in adenomas and adenocarcinomas
Urethane A>G transitions (left) and A>T transversions (right) are shown in A/J adenocarcinomas, FVB/N adenocarcinomas, and FVB/N adenomas. Mutation counts per tumour were normalized to total length of sequenced trinucleotide contexts in each tumour and averaged. Error bars represent SEM.
Figure 1
Figure 1. Differences in mutation burden and spectra between carcinogen and genetic models
a, Total SNVs per tumour. Light shades denote Kras+/− genotype. All comparisons of SNVs between treatment groups were significant (p ≤ 1.0x10⁶, Wilcoxon rank-sum test, Holm’s correction). No significant differences were observed between WT and Kras+/− tumours. b, Unsupervised, hierarchical clustering of tumours by trinucleotide context substitutions. c, Stacked heatmaps of mutation spectra for five representative MNU-induced and urethane-induced tumours (see Extended Data Fig. 1 for all tumours). Substitutions are shown below each heatmap, with 5′ and 3′ flanking base displayed on top and right, respectively.
Figure 2
Figure 2. Distinct copy number profiles of genetically- and chemically-induced tumours
Unsupervised, hierarchical clustering of log2 transformed read count ratios. KrasLA2 tumours showed a significantly higher number of CNAs compared to carcinogen-induced tumours (p = 4.310, Wilcoxon rank-sum test). Chromosomes are aligned head to tail on the X axis, starting at the left. Samples are labeled by treatment and genotype, with Kras+/ samples appearing as light blue and light red. Sample SNV burden is displayed along the Y axis in greyscale.
Figure 3
Figure 3. Consequential SNVs in high-likelihood driver genes only occur in carcinogen-induced tumours
All missense and nonsense SNVs, amplifications, and deletions in genes listed in Extended Data Table 2 are displayed. KrasLA2, urethane-, and MNU-induced tumours are denoted above in green, blue, and red, respectively, with lighter shading denoting Kras+/− genotype. SNVs with unequivocal evidence of consequence are bordered in black. All SNVs, excepting those marked with an asterisk, are concordant with the signature mutations of the inducing carcinogen. The bottom panel shows total SNVs per tumour (NS = nonsynonymous, S = synonymous).
Figure 4
Figure 4. Adenocarcinomas show enrichment for a signature of genomic instability
Breakdown of G>A transitions in A/J and FVB/N adenocarcinomas reveals significant increases in CGN>A (NCG>T) transition rates over FVB/N adenomas (p = 0.00047 and 0.0143, respectively, Wilcoxon rank-sum), despite similar rates and patterns of other G>A transitions. Mutation counts per tumour were normalized to total length of sequenced trinucleotide contexts in each tumour and averaged. Error bars represent SEM.

References

    1. Ciriello G, et al. Emerging landscape of oncogenic signatures across human cancers. Nat Genet. 2013;45:1127–1133. - PMC - PubMed
    1. Stratton MR, Campbell PJ, Futreal PA. The cancer genome. Nature. 2009;458:719–724. - PMC - PubMed
    1. Alexandrov LB, et al. Signatures of mutational processes in human cancer. Nature. 2013;500:415–421. - PMC - PubMed
    1. Lawrence MS, et al. Mutational heterogeneity in cancer and the search for new cancer-associated genes. Nature. 2013;499:214–218. - PMC - PubMed
    1. Johnson L, et al. Somatic activation of the K-ras oncogene causes early onset lung cancer in mice. Nature. 2001;410:1111–1116. - PubMed

Publication types

MeSH terms