. 2014 Dec 18;516(7531):400-4.
doi: 10.1038/nature13863. Epub 2014 Oct 29.

Modelling human development and disease in pluripotent stem-cell-derived gastric organoids

Affiliations

Modelling human development and disease in pluripotent stem-cell-derived gastric organoids

Kyle W McCracken et al. Nature. .

Abstract

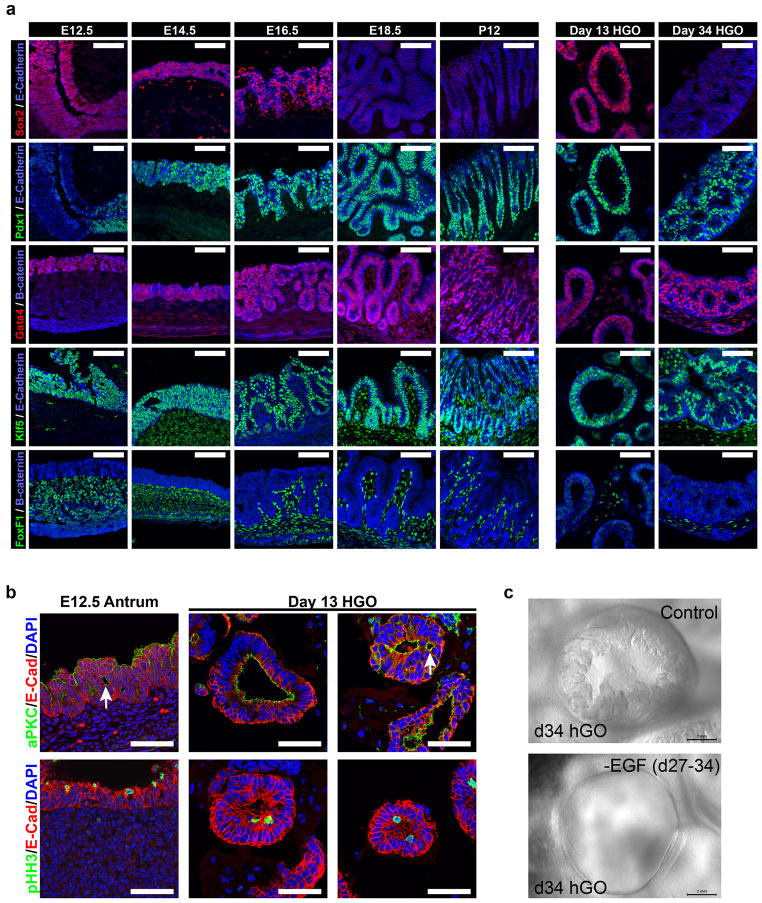
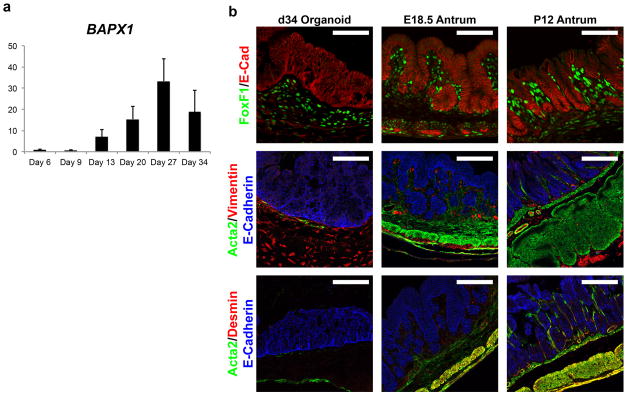
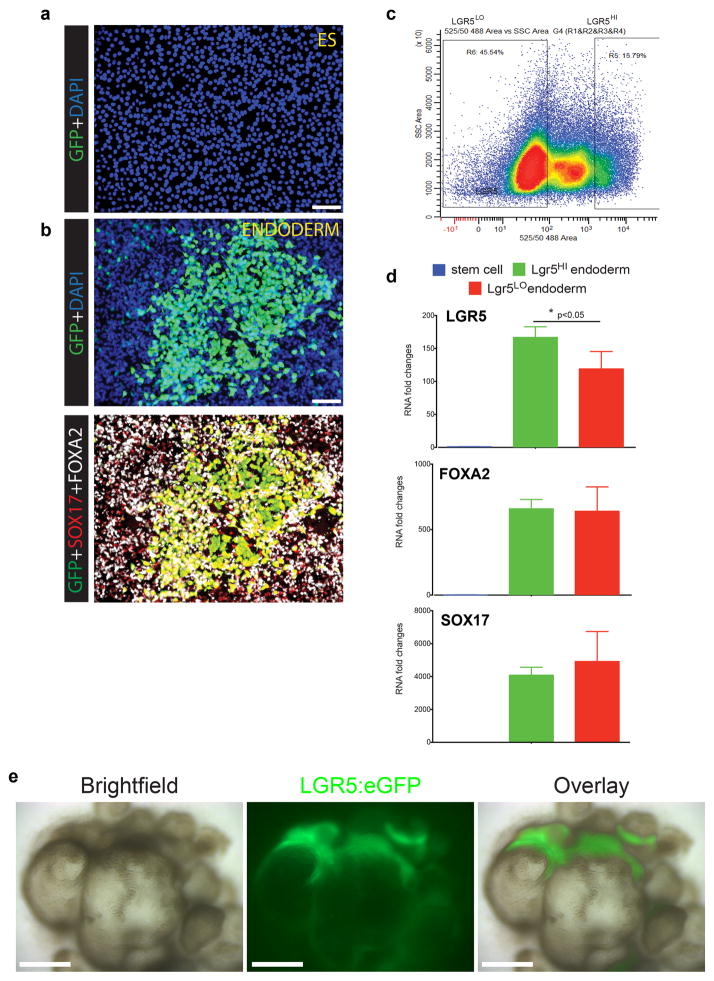
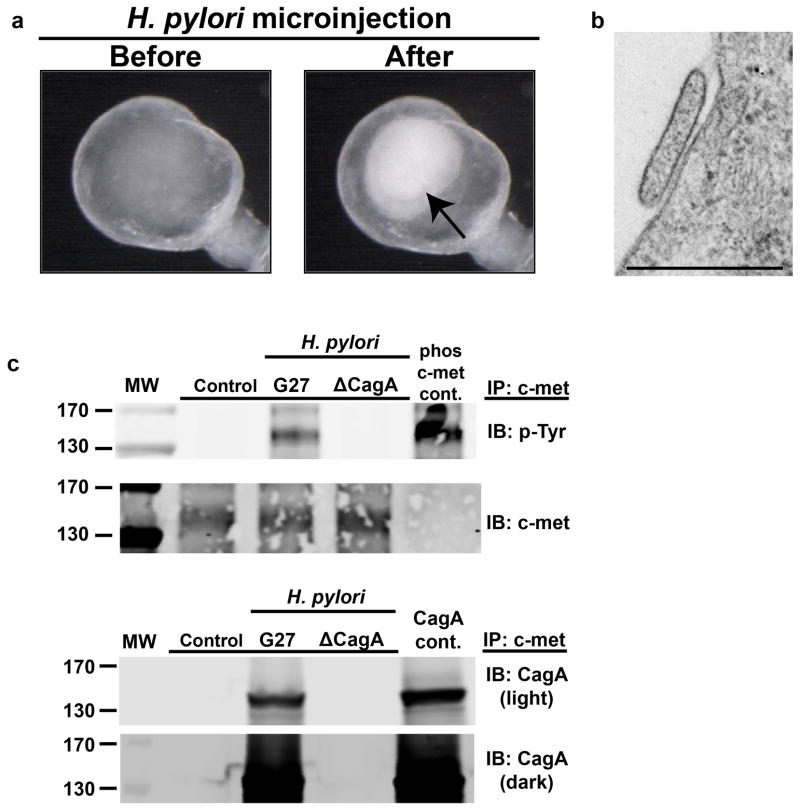
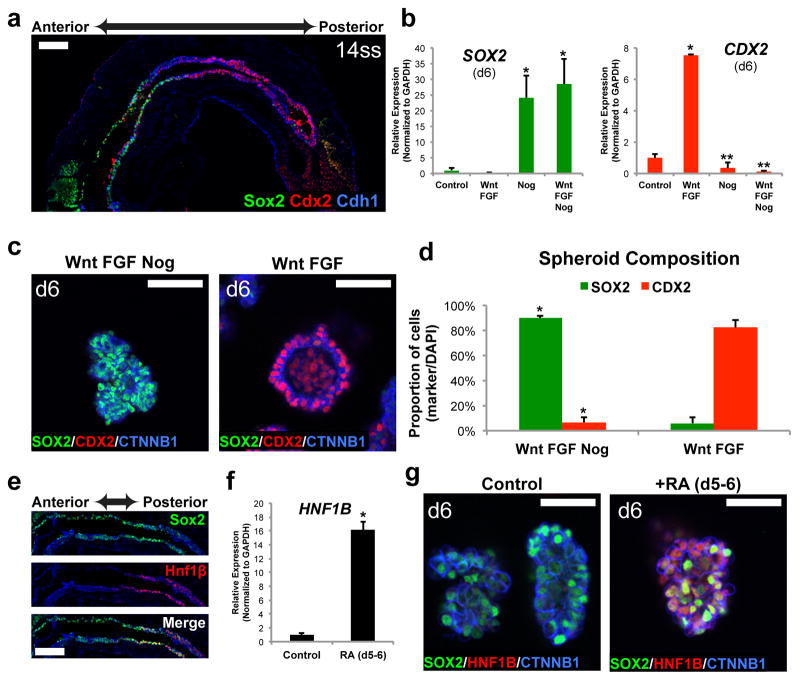
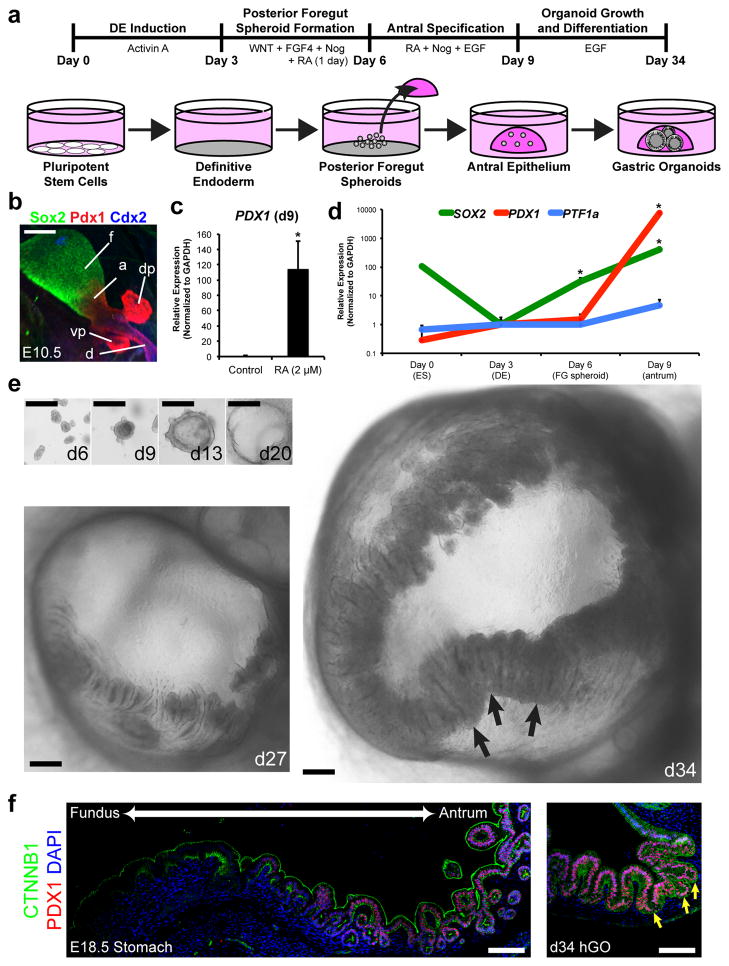
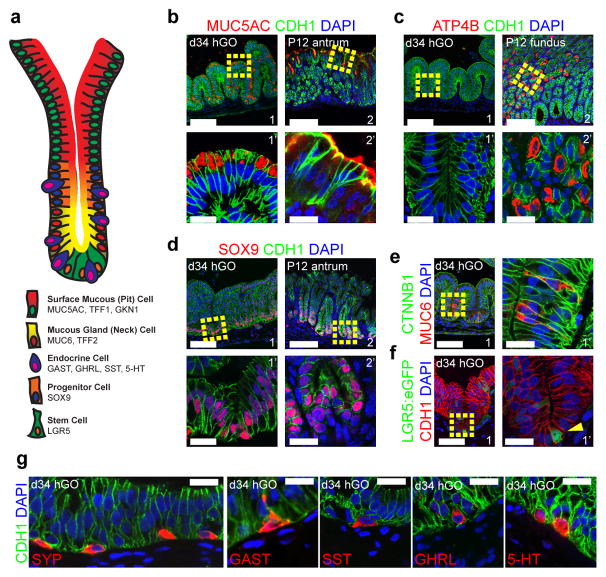
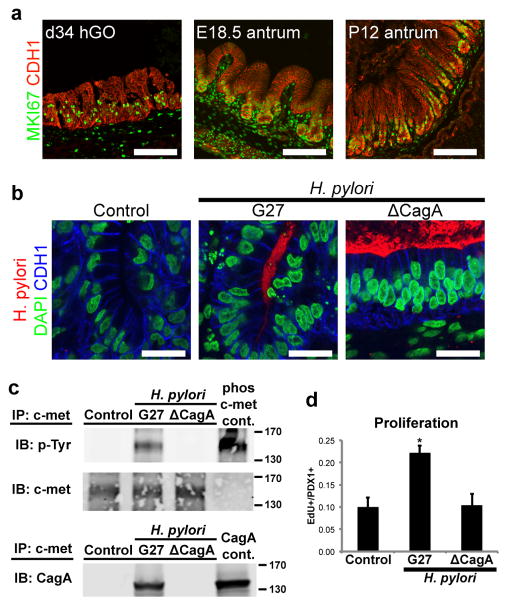
Gastric diseases, including peptic ulcer disease and gastric cancer, affect 10% of the world's population and are largely due to chronic Helicobacter pylori infection. Species differences in embryonic development and architecture of the adult stomach make animal models suboptimal for studying human stomach organogenesis and pathogenesis, and there is no experimental model of normal human gastric mucosa. Here we report the de novo generation of three-dimensional human gastric tissue in vitro through the directed differentiation of human pluripotent stem cells. We show that temporal manipulation of the FGF, WNT, BMP, retinoic acid and EGF signalling pathways and three-dimensional growth are sufficient to generate human gastric organoids (hGOs). Developing hGOs progressed through molecular and morphogenetic stages that were nearly identical to the developing antrum of the mouse stomach. Organoids formed primitive gastric gland- and pit-like domains, proliferative zones containing LGR5-expressing cells, surface and antral mucous cells, and a diversity of gastric endocrine cells. We used hGO cultures to identify novel signalling mechanisms that regulate early endoderm patterning and gastric endocrine cell differentiation upstream of the transcription factor NEUROG3. Using hGOs to model pathogenesis of human disease, we found that H. pylori infection resulted in rapid association of the virulence factor CagA with the c-Met receptor, activation of signalling and induction of epithelial proliferation. Together, these studies describe a new and robust in vitro system for elucidating the mechanisms underlying human stomach development and disease.


Figures

Extended Data Figure 1
Extended Data Figure 1. BMP signaling is required in parallel with activation of WNT and FGF, to promote a posterior fate
a, Activation of Wnt signaling with WNT3a or the GSK3β inhibitor CHIR99021 (CHIR; 2 μM) induced a posterior fate and this was blocked by BMP inhibition. n=3 biological replicates per condition. b, Activation of Wnt signaling with WNT3a or CHIR induced gut tube morphogenesis and spheroid production. c, Immunofluorescent staining of monolayer cultures confirmed the high efficiency of CDX2 induction by CHIR/FGF treatment, and that noggin blocked posterior CDX2 expression and induced expression of the foregut marker SOX2. d, qPCR analysis of BMP target genes MSX1/2 indicated that BMP activity is not increased in response to Wnt/FGF, but target genes are suppressed in response to noggin, suggesting that noggin acts on endogenous BMP signaling. n=3 biological replicates per condition. e, Addition of BMP2 (100 ng mL−1) did not substitute for or augment the ability of Wnt/FGF to posteriorize endoderm. These data indicate that the posteriorizing effect of Wnt/FGF is not mediated by up-regulation of BMP signaling but does require endogenous BMP activity. n=3 biological replicates per condition. Scale bars, 1 mm in b; 100 μm in c. Error bars represent standard deviation.
Extended Data Figure 2
Extended Data Figure 2. Gastric organoid differentiation is efficient in multiple PSC lines
a, Table comparing spheroid formation and characteristics between two hESC lines (H1 and H9) and one iPSC line (72.3). Spheroid number was averaged from n=8 wells per cell line; total cells per spheroid and epithelial composition were determined from whole mount staining (DAPI for total cell number and Foxa2 for epithelial cells) and quantification from n=6 spheroids per cell line. b, Immunofluorescent staining of 34-day hGOs derived from H1 and iPSC 72.3 cell lines. iPSC-derived organoids exhibit the same morphological and molecular features of those derived from hESCs. c, Organ epithelial cell type quantification in 34-day hGOs. Greater than 90% of the epithelium is antral, indicated by PDX1 expression and lack of PTF1A expression, whereas less than 5% express markers associated with other organs derived from endoderm including CDX2 (intestine), albumin (liver) and p63 (squamous epithelium). Data shown are averages from n=6 hGOs. d–g, Characterization of induced pluripotent stem cell line iPSC 72.3 used in a. d, iPSC 72.3 exhibited normal morphological characteristics of pluripotent stem cell colonies, as compared to the H1 hESC line and e, had a normal 46;XY karyotype. f, iPSC 72.3 expressed pluripotent markers OCT3/4 and NANOG, and g, demonstrated pluripotency by differentiation into endoderm, mesoderm, and ectoderm lineages in an in vivo teratoma assay. Error bars represent standard deviation. h, Human pluripotent stem cell scorecard assay results demonstrating that H1 hESC and iPSC 72.3 have similar pluripotency and differentiation potential and that iPSC 72.3 does not have a lineage bias. UD, undifferentiated; EB, differentiated as embryoid bodies for 14 days. Scale bars, 100 μm. Error bars represent standard deviation.
Extended Data Figure 3
Extended Data Figure 3. Retinoic acid posteriorizes foregut endoderm
a, Lineage diagram that summarizes the patterning effects of noggin and RA in the formation of both anterior and posterior foregut endoderm. b, Bright field images show that RA increased the number of spheroids that are produced from foregut monolayer cultures. c, A lower power image of figure 1d showing immunofluorescent image of a E8.5, 14 somite stage embryo with Hnf1β protein localized to the posterior portion of the foregut. Boxed region of embryo is shown in figure 1d. d, qPCR analysis of gene expression in foregut spheroids treated with RA. Posterior foregut markers HNF1β and HNF6 were robustly induced by 24-hour exposure to RA. Although RA induced posterior foregut gene expression it did not induce expression of the posterior marker CDX2. *, p<0.05; student’s t-test; n=3 biological replicates per condition, data representative of 3 independent experiments. Scale bars, 1 mm in b; 100 μm in c. Error bars represent standard deviation.
Extended Data Figure 4
Extended Data Figure 4. Human gastric organoids recapitulate normal antrum development of mouse embryos
a, Comparison of transcription factor expression between hGO development and in vivo stomach organogenesis. Four embryonic stages (E12.5, E14.5, E16.5 and E18.5) and one postnatal stage (P12) of in vivo antrum development were analyzed for expression of the following transcription factors: Sox2, Pdx1, Gata4, Klf5, and FoxF1. The same markers were analyzed at two stages (day 13 and day 34) of in vitro hGO development and revealed that organoid development parallels what occurs in vivo. At early stages of antrum development the epithelial marker Sox2 was expressed ubiquitously but at later stages it is down-regulated, while other epithelial transcription factors, Pdx1, Gata4 and Klf5, exhibit persistent expression in the epithelium throughout development. Both early and late stage hGOs contain FoxF1-positive mesenchymal cells surrounding the epithelium, similar to the in vivo antrum. b, Early stage human gastric organoids exhibit stereotypic epithelial architecture and nuclear behavior. At 13 days, hGOs contained pseudostratified epithelia that display apicobasal polarity marked by the apical marker aPKC and the basolateral marker E-Cadherin, similar to the E12.5 mouse antrum. Further, extensions of apical membrane (white arrows) were seen within deeper portions of the organoid epithelium. Both the E12.5 mouse antrum and day 7 hGOs appeared to undergo interkinetic nuclear migration, indicated by the presence of mitotic nuclei, pHH3, in only the apical portions of cells. c, EGF is required for morphogenesis in gastric organoids. Bright field images demonstrate the requirement for EGF in epithelial morphogenesis including folding and gland formation at late stages of hGO differentiation. When EGF is removed from the growth medium at day 27, prior to glandular morphogenesis, the hGO epithelium retains a simple, cuboidal structure that fails to form glands. Scale bars, 100 μm in a, 50 μm in b, 2 mm in c.
Extended Data Figure 5
Extended Data Figure 5. Mesenchymal differentiation in gastric organoids
a, Temporal expression analysis of the antral mesenchyme transcription factor BAPX1. Similar to its known embryonic expression pattern, BAPX1 is up-regulated during the earlier stages of hGO differentiation and then down-regulated coincident with functional cell type marker expression. n=3 biological replicates per time point. b, Staining for mesenchymal cell type markers revealed that 34-day hGOs contain FOXF1/VIM-positive submucosal fibroblasts and a small number of VIM/ACTA2-expressing subepithelial fibroblasts. hGOs lack a robust smooth muscle layer, indicated by Acta2/Desmin-positive cells in the in vivo antrum. Scale bars, 100 μm. Error bars represent standard deviation.
Extended Data Figure 6
Extended Data Figure 6. Induction of genes during development of hGOs that mark specific differentiated antral cell types
a, qPCR analyses of cell lineage differentiation marker expression at several stages throughout the gastric organoid differentiation protocol (d0, d3, d6, d9, d20, d27, and d34) and d34 human intestinal organoids (hIO). Beginning at day 27, hGOs robustly induced genes expressed in differentiated cell types including surface mucous cells (MUC5AC, TFF1, TFF3, and GKN1) and antral gland cells (TFF2). HGOs do not up-regulate expression of markers found in fundic lineages such as parietal cells (ATP4A and ATP4B) and chief cells (MIST1) or intestinal goblet cells (MUC2). Expression levels are normalized to d3 DE cultures. n=3 biological replicates per time point. b, Muc5AC-expressing surface mucous cells in the late fetal (E18.5) mouse antrum are not yet confined to a pit region and are more broadly distributed through the antral epithelium. Further, these pit cells exhibit high amounts of intracellular mucin staining, similar to 34-day hGOs. c, Global gene expression profiling of 34-day hGOs was performed using RNA-seq, and data were compared to published RNA-seq datasets from human tissues. Hierarchical clustering revealed that hGOs closely resemble human fetal stomach tissue but not human fetal intestine. Error bars represent standard deviation.
Extended Data Figure 7
Extended Data Figure 7. Characterization of LGR5: eGFP BAC transgenic reporter hESC line
a, H9-LGR5:eGFP hESC line did not show eGFP fluorescence in undifferentiated, pluripotent stem cells. b, Upon differentiation to definitive endoderm, robust eGFP expression was observed, consistent with published microarray and RNA-sequencing analyses that show LGR5 as a highly enriched endoderm transcript,. The top panel shows DAPI and eGFP staining, whereas the bottom panel shows eGFP co-localization with endoderm markers SOX17 and FOXA2. c, FACS was used to sort LGR5:eGFPLO and LGR5:eGFPHI from 3-day Activin A-treated definitive endoderm cultures. d, qPCR was used to measure LGR5, FOXA2, and SOX17 expression levels in undifferentiated H9-LGR5:eGFP cells (blue bars; “stem cell”) and in FACS-purified H9-LGR5:eGFP endoderm (red bars, LGR5:eGFPLO; green bars, LGR5:eGFPHI). As expected, LGR5, FOXA2, and SOX17 were all highly enriched in both LGR5:eGFPLO and LGR5:eGFPHI endoderm populations compared to undifferentiated controls, and the LGR5:eGFPHI cells showed significant enrichment of LGR5 mRNA, but not FOXA2 or SOX17, compared to the LGR5:eGFPLo population. n=3 biological replicates for each group and error bars represent the S.E.M. *, p<0.05. This analysis suggests that the LGR5:eGFP BAC construct drives eGFP expression in endoderm cells with the highest levels of LGR5 expression. e, H9-LGR5:eGFP hESCs were differentiated into antral gastric organoids. Bright field and GFP stereomicrographs of 30-day hGOs showed that the organoid epithelium developed regionally-restricted areas of LGR5:eGFP expression, suggesting that LGR5+ stem cell populations formed during the differentiation of the organoids. Scale bars, 100 μm.
Extended Data Figure 8
Extended Data Figure 8. NEUROG3 expression and endocrine differentiation are reduced in a high EGF environment
a, Endocrine cell differentiation in the antrum is first evident at E18.5 and highly robust at postnatal stages (P12 shown). As early as e18.5, all expected gastric endocrine subtype hormones are present, including gastrin, ghrelin, somatostatin, and serotonin (5-HT). b, High levels of EGF (100 ng ml−1) repressed NEUROG3 expression, however a reduction in EGF concentration (10 ng ml−1) at day 30 resulted in a significant increase in NEUROG3 expression measured at day 34 by qPCR. *, p<0.05; student’s t-test; n=5 biological replicates, data representative of 3 independent experiments. c, hGOs maintained in high concentrations of EGF (100 ng mL−1) had very few endocrine cells at day 34, shown by staining for the pan-endocrine marker CHGA. However, a reduction of EGF concentration (10 ng mL−1) at day 30 resulted in more physiologic numbers of endocrine cells in the gastric epithelium. d, Schematic indicating the effects of EGF at different stages of hGO growth, morphogenesis, and cell type specification. High levels of EGF were required at early developmental stages for growth and morphogenesis, however it repressed endocrine differentiation at late stages of development; thus, the EGF concentration was reduced at day 30 to allow for endocrine cell development. e, To test whether EGF repression of endocrine differentiation occurs upstream of NEUROG3, hGOs were generated from a hESC line stably transfected with a dox-inducible NEUROG3-overexpressing transgene. hGOs were maintained in high EGF (100 ng mL−1) then at day 30 were treated with doxycycline (1 μg mL−1) for 24 hours and then analyzed at day 34. f, Dox-treated hGOs show robust activation of endocrine markers CHGA, GASTRIN, GHRELIN, and SOMATOSTATIN, and (g) they contain CHGA, GHRELIN, and SOMATOSTATIN expressing cells with endocrine morphology. *, p<0.05; student’s t-test; n=3 biological replicates per condition, data representative of 2 independent experiments. Therefore NEUROG3 overexpression was sufficient to induce gastric endocrine cell fate in a high EGF environment. Scale bars, 100 μm. Error bars represent standard deviation.
Extended Data Figure 9
Extended Data Figure 9. H. pylori infection of human gastric organoids
a, hGOs were used to model human-specific disease processes of H. pylori infection. Bacteria were microinjected into the lumen of hGOs and bacteria were detected in the lumen 24 hours post-injection by bright field microscopy (black arrow). b, Electron micrograph illustrates the attachment of H. pylori bacterial to an hGO epithelial cell 24 hours after injection. Scale bar, 500 nm. c, Western blots from figure 4 that show the molecular weight markers in the first lane. The darker exposure for the CagA western blot (CagA dark) was included to show the molecular weight markers (170 and 130kd).
Extended Data Figure 10
Extended Data Figure 10. Summary of methods for the directed differentiation of gastric organoids
Each step in the differentiation process is indicated, along with representative stereomicrographs.
Figure 1
Figure 1. Generation of three-dimensional posterior foregut spheroids
a, Sox2 marks foregut endoderm and Cdx2 marks mid/hindgut endoderm in E8.5 (14 somite stage) mouse embryo. b–c, qPCR analysis (b) and wholemount immunostaining (c) for patterning markers in hPSC-DE cultures exposed to three days in media alone (control) or with the indicated growth factors/antagonists. WNT3A and FGF4 induced CDX2 expression whereas the BMP antagonist noggin repressed CDX2 and induced high levels of the foregut marker SOX2. Results are normalized to expression in Control (stage-matched, no growth factor-treated) endoderm. *, p<0.05 compared to control. **, p<0.005 compared to WNT/FGF; two-tailed student’s t-test; n=3 biological replicates per condition, data representative of 6 independent experiments. d, Quantitation of SOX2- and CDX2-expressing cells in day 6 spheroids generated in hindgut (WNT/FGF4) and foregut (WNT/FGF4/Noggin) patterning conditions. Data are expressed as the percentage of cells expressing indicated markers, normalized to the total number of cells in the spheroids. *, p<1.0×10⁻⁶; two-tailed student’s t-test; n=5 biological replicates per condition, data representative of 3 independent experiments. e, The posterior foregut in the E8.5 mouse embryo expressed both Sox2 and Hnf1β. f–g, Exposing cultures to RA on the final day of the spheroid generation step induced expression of HNF1β in SOX2-expressing epithelium, measured by both qPCR (f) and wholemount immunofluorescent staining (g), indicating the formation of posterior foregut spheroids. *, p<0.005; two-tailed student’s t-test; n=3 biological replicates per condition, data representative of 3 independent experiments. Scale bars, 100 μm in a and e, 50 μm in c and g. Error bars represent standard deviation.
Figure 2
Figure 2. Specification and growth of human antral gastric organoids
a, Schematic representation of the in vitro culture system used to direct the differentiation of hPSCs into three-dimensional gastric organoids. b, Defining molecular domains of the posterior foregut in E10.5 mouse embryos with Sox2, Pdx1 and Cdx2; Sox2/Pdx1, antrum (a); Sox2, fundus (f); Pdx1, dorsal and ventral pancreas (dp and vp); Pdx1/Cdx2, duodenum (d). c, Posterior foregut spheroids exposed for three days to RA (2 μM) exhibited >100-fold induction of PDX1 compared to control spheroids, measured by qPCR. *, p<0.05; two-tailed student’s t-test; n=3 biological replicates per condition, data representative of 4 independent experiments. d, Time course qPCR analysis of antral differentiation (according to protocol detailed in figure 2a) demonstrated sequential activation of SOX2 at day 6 (posterior foregut endoderm), followed by induction of PDX1 at day 9 (presumptive antrum). Day 9 antral spheroids had a 500-fold increase in SOX2 and a 10,000-fold increase in PDX1 relative to day 3 DE. *, p<0.05; two-tailed student’s t-test; n=3 biological replicates per timepoint, data representative of 2 independent experiments. The pancreatic marker PTF1A was not significantly increased. e, Stereomicrographs showing morphological changes during growth of gastric organoids. By four weeks, the epithelium of hGOs exhibited a complex folded and glandular architecture (arrows). f, Comparison of mouse stomach at E18.5 and 34-day hGOs. Pdx1 was highly expressed in the mouse antrum but excluded from the fundus. hGOs expressed PDX1 throughout the epithelium and exhibited morphology similar to the late gestational mouse antrum (arrows). Scale bars, 100 μm in b and f, 250 μm in e. Error bars represent standard deviation.
Figure 3
Figure 3. Human gastric organoids contain differentiated antral cell types
a, Schematic representation of a typical antral gland showing normal cell types and associated molecular markers. b–g, Immunofluorescent staining demonstrated that 34-day hGOs consisted of normal cell types found in the antrum, but not the fundus. The hGO epithelium contained surface mucous cells that express MUC5AC (b1, b1′), similar to the postnatal day 12 (P12) mouse antrum (b2, b2′), but not ATP4B-expressing parietal cells (c1, c1′) that characterize the fundus (c2, c2′). SOX9+ cells were found at the base of the hGO epithelium (d1, d1′), similar to the progenitor cells found in the P12 antrum (d2, d2′). Further, hGOs contained MUC6+ antral gland cells (e) and LGR5-expressing cells (f). Boxed regions in b–f are shown as high magnification images indicated by an apostrophe (’). g, Day 34 hGOs also contained endocrine cells (SYP) that expressed the gastric hormones GAST, SST, GHRL, and serotonin (5-HT). Scale bars, 100 μm in b–f, 20 μm in b′–f′ and g. Marker expression data are representative from a minimum of 10 independent experiments, except LGR5-GFP data, which is a representative example from two separate experiments.
Figure 4
Figure 4. Human gastric organoids exhibit acute responses to H. pylori infection
a, Day 34 hGOs contained a zone of MKI67+ proliferative cells similar to the embryonic (E18.5) and postnatal (P12) mouse antrum. b, Using hGOs to model human-specific disease processes of H. pylori infection. Pathogenic (G27) and attenuated (ΔCagA) bacteria were microinjected into the lumen of hGOs and after 24 hours, bacteria (both G27 and ΔCagA strains) were tightly associated with the apical surface of the hGO epithelium. c, Immunoprecipitation (IP) for the oncogene c-MET demonstrates that H. pylori induced a robust activation (tyrosine phosphorylation) of c-MET, and this is a CagA-dependent process. Further, CagA immunoprecipiated with c-MET, suggesting these proteins interact in hGO epithelial cells. Lysates that were immunoprecipitated are underlined, phospho-c-met and CagA control lysates were not immunoprecipitated but used to confirm molecular weights. The molecular weight markers are indicated (130 and 170kd) and shown in extended figure 9c. d, Within 24 hours, H. pylori infection caused a CagA-dependent two-fold increase in the number of proliferating cells in the hGO epithelium, measured by EdU incorporation. *, p<0.05; two-tailed student’s t-test; n=3 biological replicates per condition, data representative of 4 independent experiments. Scale bars, 100 μm in a, 20 μm in b. Error bars represent s.e.m.

References

    1. Wen S, Moss SF. Helicobacter pylori virulence factors in gastric carcinogenesis. Cancer Lett. 2009;282:1–8. - PMC - PubMed
    1. Yuan Y, Padol IT, Hunt RH. Peptic ulcer disease today. Nat Clin Pract Gastroenterol Hepatol. 2006;3:80–89. - PubMed
    1. Parkin DM. The global health burden of infection-associated cancers in the year 2002. Int J Cancer. 2006;118:3030–3044. - PubMed
    1. Peek RM. Helicobacter pylori infection and disease: from humans to animal models. Dis Model Mech. 2008;1:50–55. - PMC - PubMed
    1. Mills JC, Shivdasani RA. Gastric Epithelial Stem Cells. Gastroenterology. 2011;140:412–424. - PMC - PubMed

Publication types