. 2014 Sep;69(2-3):132-158.
doi: 10.1016/j.surfrep.2014.07.001.

Synthesis and surface functionalization of silica nanoparticles for nanomedicine

Affiliations

Synthesis and surface functionalization of silica nanoparticles for nanomedicine

Alexander Liberman et al. Surf Sci Rep. 2014 Sep.

Abstract

There are a wide variety of silica nanoformulations being investigated for biomedical applications. Silica nanoparticles can be produced using a wide variety of synthetic techniques with precise control over their physical and chemical characteristics. Inorganic nanoformulations are often criticized or neglected for their poor tolerance; however, extensive studies into silica nanoparticle biodistributions and toxicology have shown that silica nanoparticles may be well tolerated, and in some case are excreted or are biodegradable. Robust synthetic techniques have allowed silica nanoparticles to be developed for applications such as biomedical imaging contrast agents, ablative therapy sensitizers, and drug delivery vehicles. This review explores the synthetic techniques used to create and modify an assortment of silica nanoformulations, as well as several of the diagnostic and therapeutic applications.

Keywords: Ablative technology; Biodistribution; Biomedical imaging; Nanoparticles; Silica; Toxicology.


Figures

Fig. 1
Fig. 1
SEM images of solid silica nanoparticles synthesized by the Stöber method with varying rates of TEOS additions [3]: (a) rate of addition: 0.005 ml/min, (b) rate of addition: 0.05 ml/min and (c) rate of addition: 0.5 ml/min. Each order of magnitude increase in rate of TEOS addition resulted in a 33% decrease in particle size from ~ 1800 to 600 nm in diameter.
Fig. 2
Fig. 2
Silica nanoparticles synthesized by the Stöber method with variable methanol/TEOS ratios before and after calcination [6]. The MeOH/TEOS synthesis ratios and calcined vs. noncalcined status are as follows: (a) 300/noncalcined, (b) 750/noncalcined, (c) 1125/noncalcined, (d) 1500/noncalcined, (e) and (f) 1500/calcined, (g) 2250/noncalcined, (h) and (i) 2250/calcined, (j) 3000/noncalcined, and (k) and (1) 3000/calcined. As the ratio of methanol/TEOS increased from 300 to 1125, the particle size increased. However, from 1125 to 6000, the particle size decreased from 1500 nm to 10 nm in diameter.
Fig. 3
Fig. 3
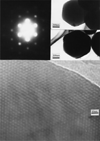
Analysis of mesoporous particles by transmission electron microscopy [8]. Top left image is the electron diffraction pattern of the mesoporous particles clearly displaying a hexagonal pore structure. Top right images are low magnification TEM images. Bottom image is high magnification TEM showing the highly ordered pore structure of the particles.
Fig. 4
Fig. 4
Transmission eletron microscopy of calcined 100 nm hollow silica nanoparticles synthesized from polystyrene templates [22]. Due to the commercial template used for synthesis, the resulting nanoshells are highly uniform with a shell thickness of 10 nm. Scale bar is 100 nm.
Fig. 5
Fig. 5
Transmission electron microscopy of the various shaped silica nanoparticles templated onto metal organic framework tempaltes [26]: (A) and (B) Polyvinylpyrrolidone functionalized MOF with a 2–3 nm layer of silica. (C) Polyvinylpyrrolidone functionalized MOF with a 8–9 nm layer of silica. (D) Hollow silica nanorod resulting from low pH treatment of polyvinylpyrrolidone functionalized MOF with a 8–9 nm layer of silica. Blank scale bars represent 50 nm.
Fig. 6
Fig. 6
TEM images of stepwise synthesis of yolk–shell and multi–shell Au-core–silica nanoparticles [29]. (a) Au–core, (b) Au–core encapsulate in silica with the outer layer hardened with 2-propanol, (c) Au–core–silica yolk–shell particle after etching inner layer of silica, (d) multishell Au–core particle undergoing multiple steps of Stöber growth prior and 2-propanol treatment. (e) Multishell Au–core–silica particles after etching. Scale bar is 50 nm.
Fig. 7
Fig. 7
Biodistribution of variably sized silica nanoparticles in MDA-MB-231 tumor bearing mice by ICP-AES [24]: (A) animals that received a low dose of particles (107 particles/animal) and (B) animals that received a high dose of particles (108 particles/animal). As the dose increased a factor of 10 ×, the accumulation of particles in all sizes increased primarily in RES organs.
Fig. 8
Fig. 8
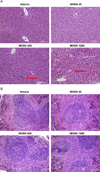
Histology of hematoxylin and eosin stained mouse liver and spleen after variable doses of mesoporous silica nanoparticles.[53]. Doses ranged from 0 to 1280 mg/kg: (A) liver tissues and (B) spleen tissues. Degenerative necrosis and microgranulation (red arrows) is observed in liver tissues in doses exceeding 500 mg/kg. Scale bar is 100 µm.
Fig. 9
Fig. 9
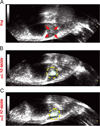
2 µm silica shells injected IP into IGROV-1 ovarian tumor bearing nu/nu mice. Red arrows in all images point to the tumor, the green arrows are the backbone of the mouse, and the blue arrows point to the bottom of the mouse [61]: (A) post mortem examination of mouse reveals large white IGROV-1 tumor mass in the peritoneum. (B) Contrast pulse sequencing (CPS) imaging of the mouse tumor, some particle dependent signal can be seen in the tumor mass. (C) B-mode imaging of the mouse tumor. (D).Integrated heat map of contrast signal derived from CPS imaging overlayed on the B-mode imaging to accentuate the presence of silica shells in the tumor.
Fig. 10
Fig. 10
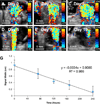
Intratumoral PFC filled iron-silica nanoshell imaging longevity [64]: (A–F) 50 µl of nanoshells were injected directly into Py8119 epithelial breast tumor bearing nu/nu mice and imaged by color Doppler ultrasound intermittenly over 10 days. (G) Color Doppler signal width was plotted against time to show a linear decay of signal over the course of 10 days.
Fig. 11
Fig. 11
MRI cross section of mouse brain with transplanted mesenchymal stem cells loaded with manganese oxide loaded mesoporous silica nanoparticles [80]: (a) Control MSCs into mice with no manganese oxide show no signal under MRI as indicated by the red arrow. (b) Manganese oxide loaded silica particles incubated into the MSCs show strong MRI signal over the course of 14 days indicated by the green arrow.
Fig. 12
Fig. 12
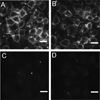
Fluorescent imaging of rat basophilic leukemia mast cells being labeled by silica nanoparticles [83]: (A) and (B) mast cell receptors labeled with IgE functionalized flourescent silica nanoparticles. (C) and (D) Competitive inhibition of FcεRI receptor with free IgE prevented nanoparticle labeling. Scale bar is 10 µm.
Fig. 13
Fig. 13
PET/CT and PET imaging of 4T1 tumor bearing mice 5 h after being dosed with Cu-NOTA-mesoporous silica nanoparticles [87]. The left image contains a PET/CT image to clearly demonstrate the location of the implanted 4T1 tumor also indicated by the yellow triangle in all images. Comparing the PET images, more TRC105 targeted particles are present in the tumor compared to non-targeted and inhibited particles.
Fig. 14
Fig. 14
Gamma scinitigraphy of IV administered 111In-DTPA–Fe–SiO2 and pure SiO2 nanoshells in Py8119 tumor bearing mice [56]: (A)–(D) Gamma scinitigraphy of 111In-DTPA–Fe–SiO2 over the course of 72 h. (E)–(H) Gamma scinitigraphy of 111In-DTPA–SiO2 over the course of 72 h.
Fig. 15
Fig. 15
Examination of venereal tumor in SCID/j mice after photothermal irradiation with intratumorally administered Fe3O4–Au silica nanoparticles [93]: (a) Gross examination reveals a region of discolored damaged tissue on the lower right region of the tissue. (b) Silver staining was applied to the sectioned tissue to determine the location of the particles which are outlined in red. (c) H&E staining of the tissue reveals that the damaged tissue outlined in red overlaps with the location of the particles. (d) Magnetic resonance thermal imaging also displays a region of thermal damage overlapping in the region of the particles.
Fig. 16
Fig. 16
Photodynamic therapy with two-photon excitation of photosensitizer loaded mesoporous silica nanoparticles in HCT-116 tumor bearing mice 30 days after treatment [98]. The top row is control tumors with no treatment or particles (n=3). The middle row received the photosensitizer loaded mesoporous silica nanoparticles but no photodynamic irradiation (n=4). The bottom row received both particles and irradiation (n=4). All the samples in each group are shown from left to right. Scale bars are 2 cm.
Fig. 17
Fig. 17
In vivo analysis of 4T1 murine breast tumor response to CSNT (rare earth core-silica shelled-CuS functionaled nanoparticles) in combination with X-ray radiotherapy and near IR irradiation [103]. ~200 µg of particles were injected intratumorally; NIR was applied at 980 nm with a power of 1.5 W/cm2; radiotherapy was applied at 6 Gy: (a) relative tumor volume response over time with CSNT and/or NIR treatment/X-ray radiotherapy and (b) mouse observation from group which received CSNT+RT+NIR over the course or 120 days post treatment. No tumor growth/recurrence is observed.
Fig. 18
Fig. 18
IV administration of PFH filled MnO functionalized hollow mesoporous silica shells to VX2 tumor bearing rabbits [96]. (A) The MRI T1 signal in the tumor after nanoparticle administration is used to guide when HIFU should be administered. (B) Response to HIFU at 150 W for 5 s in the presence of no particles (PBS), non-loaded particles, and PFH loaded particles. The particles acoustically scatter allowing for increased themal deposition, which is enhanced when PFH is also present.
Fig. 19
Fig. 19
In vivo HIFU of PFH loaded Au–silica mesoporous particles in VX2 tumors in rabbit livers [105]. Particles were administered intravenously and allowed to circulate for 30 min; afterwards, HIFU was applied at 400 W for 2 s. Compred to pre-HIFU (A), each HIFU application ((B) and (C)) could be observed by an echogenic change in the tumor.
Fig. 20
Fig. 20
In vivo HIFU of PFP filled iron silica nanoshells in Py8119 tumors in nu/nu mice: (A) B-mode imagine before HIFU [106]. (B) Bubble cavitation is observed in the focal zone of the HIFU. (C) A black zone is present in the area of bubble cavitation which is filled with liquefied tissue.
Fig. 21
Fig. 21
In vitro HeLa cell response to perovskite loaded silica particles and AMF. All cells stained with Hoechst 33258 [110]: (A) control cells with no particles or AMF, (B) control cells with particles and no AMF. (C)–(F) Cell deformation, detachment and death after incubation with particles and receiving AMF at 100 kHz and 15 mT for 30 min.
Fig. 22
Fig. 22
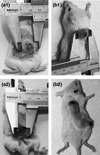
Hyperthermia with Fe–CaS–SiO2 nanoparticles in CT-26 tumor bearing Balb/c mice. Both groups received exposure to AMF for 20 min at 750 kHz and 10 Oe [113]: (a1) initial tumor injected with magnetic nanoparticles. (a2) 15 days after initial treatment, tumor mass is replaced with a black scarred region. (b1) Initial control with no particles. (b2) Control mouse with rapid increase in tumor volume after 15 days.
Fig. 23
Fig. 23
Release of FITC linked gluconic acid-insulin from mesoporous silica nanoparticles in the presence of various saccharides at pH 7.4 [119]. The gluconic acid-insulin cap is preferentially sensitive to fructose and glucose compared to other saccharides.
Fig. 24
Fig. 24
Externally triggered payload release from various silica nanoparticles [121]: (a) camptothecin release from SPION core–silica nanoparticles triggered by alternating magnetic field. For drag release, the AMF was “on” for 10 s and “off for 5 min. (b) Doxorubicin release from SPION core–silica nanoparticles triggered by RF magnetic field. When the AMF is turned off, there is no drug release. (c) Pulsatile payload (safranine O) release from Au nanoparticle capped mesoporous silica nanoparticles by 1064 nm laser excitation [123]. 5 pulses at 4.3 ns/pulse created a burst release which lasted several minutes after which more payload could be released with subsequent pulsing.
Scheme 1
Scheme 1
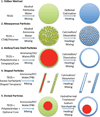
Common techniques in silica nanoparticle synthesis.

References

    1. Stöber W, Fink A, Bohn E. J. Colloid Interface Sci. 1968;26:62–69.
    1. Choi H, Chen IW. J. Colloid Interface Sci. 2003;258:435–437. - PubMed
    1. Nozawa K, Gailhanou H, Raison L, Panizza P, Ushiki H, Sellier E, Delville JP, Delville MH. Langmuir. 2004;21:1516–1523. - PubMed
    1. Wang X-D, Shen Z-X, Sang T, Cheng X-B, Li M-F, Chen L-Y, Wang Z-S. J. Colloid Interface Sci. 2010;341:23–29. - PubMed
    1. van Blaaderen A, Vrij A. J. Colloid Interface Sci. 1993;156:1–18.