Review
. 2015 Jan 21;140(2):386-406.
doi: 10.1039/c4an01079e.

Plasmon-enhanced optical sensors: a review

Affiliations
Review

Plasmon-enhanced optical sensors: a review

Ming Li et al. Analyst. .

Abstract

Surface plasmon resonance (SPR) has found extensive applications in chemi-sensors and biosensors. Plasmons play different roles in different types of optical sensors. SPR transduces a signal in a colorimetric sensor through shifts in the spectral position and intensity in response to external stimuli. SPR can also concentrate the incident electromagnetic field in a nanostructure, modulating fluorescence emission and enabling plasmon-enhanced fluorescence to be used for ultrasensitive detection. Furthermore, plasmons have been extensively used for amplifying a Raman signal in a surface-enhanced Raman scattering sensor. This paper presents a review of recent research progress in plasmon-enhanced optical sensing, giving emphasis on the physical basis of plasmon-enhanced sensors and how these principles guide the design of sensors. In particular, this paper discusses the design strategies for nanomaterials and nanostructures to plasmonically enhance optical sensing signals, also highlighting the applications of plasmon-enhanced optical sensors in healthcare, homeland security, food safety and environmental monitoring.


Figures

Figure 1
Figure 1
Volume, surface and localized surface plasmon resonances. (a) The plasma frequency of a metal describes the frequency below which the conduction electrons oscillate in the incident field. These oscillations lead to a (d) negative real part of the dielectric constant and (e) increased reflection from the metal. (b) On a 2D surface, electron oscillations lead to propagating charge waves known as surface plasmon polaritons (SPPs). These oscillations are coupled to an electromagnetic field which propagates along the interface and with amplitude that exponentially decreases away from the interface. The SPP can only be excited (f) at certain wave vectors and exists as a field that decays evanescently from the surface. The momentum matching condition leads to the SPP resonance (g) only existing at certain incident angles. (c) Localized surface plasmon resonance exists when the metal nanoparticle is smaller than the incident wavelength, making the electron oscillations in phase. The collective oscillations lead to a large absorption and scattering cross section, as well as an amplified local EM field. For small particles less than ~15 nm, (h) the absorption dominates and the absorption cross-section is large. For big nanoparticles greater than ~15 nm, (i) the scattering cross-section dominates. The EM field is taken as polarized in the plane of incidence in the figures.
Figure 2
Figure 2
TEM images and electric field distributions of (a,d) Au nanosphere, (b,e) Au nanorod and (c,f) Au nanostar synthesized by wet-chemistry methods. (Reprinted with permission from ref. , Copyright 2012, IOP Publishing.)
Figure 3
Figure 3
Representative plasmonic nanostructures for plasmon-enhanced sensing. (a) Extinction spectra (top), and optical images of different sized Ag nanospheres in aqueous solutions (a: 3.1 ± 0.6 nm, b: 13.4±5.8 nm, c: 46.4±6.1 nm and d: 91.1±7.6 nm. (Reprinted with permission from ref. , Copyright 2005, the Royal Society of Chemistry). (b) Extinction spectra (top) and optical images of Au nanorods with various aspect ratios (Reprinted with permission from ref. , Copyright 2010, Elsevier B.V.). (c) Size- and shape-tunable localized extinction spectra of various Ag nanosphere and triangle arrays prepared by nanosphere lithography (top), and the representative AFM image of Ag triangle array (Reprinted with permission from ref. , Copyright 2005, Materials Research Society).
Figure 4
Figure 4
Scheme for a plasmonic sensing system based on the Kretschmann configuration. The incident light is reflected by the metal film through a prism, and the reflected beam shows a dark line due to the SPR absorption. This plasmonic sensing system can measure time- and angle-resolved SPR response upon the binding of analytes
Figure 5
Figure 5
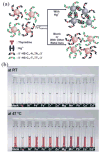
(a) Schematic illustration of the colorimetric detection of Hg2+ using DNA-Au nanoparticles, and (b) color change in the DNA-Au nanoparticle solution in the presence of various representative metal ions (each at 1 μM) upon heating from room temperature (RT) to 47 °C. (Reprinted with permission from ref. , Copyright 2007, Wiley-VCH)
Figure 6
Figure 6
Dependence on distance and sphere radius of plasmon-enhanced fluorescence. (a) If the plasmon overlaps with the absorption of the fluorophore, an excitation enhancement is possible through the near field and FRET or scattering. (b) If the plasmon overlaps with the emission of the fluorophore, an emission enhancement is possible through the Purcell effect or FRET. (c) The excitation enhancement (red line) falls off quickly with distance, while the emission enhancement (blue line) is quenched at short distances but increases rapidly. The combined photoluminescence enhancement, equal to the emission enhancement times the excitation enhancement, peaks at around 10–30 nm. (Adapted from ref. 111). (d) The optimal sphere radius for excitation (red line), emission (green line), and total photoluminescence enhancement (black line) varies with the balance between absorption and scattering. (Reprinted with permission from ref. , Copyright 2009, Optical Society of America).
Figure 7
Figure 7
(a) Schematic illustration of plasmon-enhanced fluorescence detection of prion proteins; (b) distribution of the Ag@SiO2-Cyanine-labeled prion protein after endocytosis in living SK-N-SH cells. (Reprinted with permission from ref. , Copyright 2013, Elsevier).
Figure 7
Figure 7
(a) Schematic illustration of plasmon-enhanced fluorescence detection of prion proteins; (b) distribution of the Ag@SiO2-Cyanine-labeled prion protein after endocytosis in living SK-N-SH cells. (Reprinted with permission from ref. , Copyright 2013, Elsevier).
Figure 8
Figure 8
(a) Schematic illustration of CdSe/ZnS quantum dot-Au nanoparticle energy transfer. The CdSe/ZnS quantum dots with fluorescence emission at 572 nm were used as the energy donor while different sized Au nanoparticles (3, 15 and 80 nm) were used as the energy acceptor. Two complementary single stranded DNA strands with deliberately designed T-T base mismatches are employed to control the separation distance. (b) Normalized fluorescence emission intensity at 572 nm as a function of the Hg2+ ion concentration. (c) Stern-Volmer plots showing the quenching efficiencies by the Au nanoparticles. (Reprinted with permission from ref. , Copyright 2011, American Chemical Society).
Figure 9
Figure 9
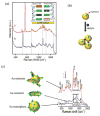
(a) Assay of DNA hybridization using SERS via direct readout of spectral signatures of DNA bases. (Reprinted with permission from ref. , Copyright 2013, American Chemical Society). (b) Analyte-induced SERS enhancement through aggregation of plasmonic nanoparticles where Raman reporters are directly adsorbed on the particle surface. (c) Shape-dependent SERS enhancement. (Reprinted with permission from ref. , Copyright 2005, IOP Publishing.)
Figure 10
Figure 10
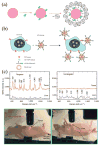
(a) Preparation and schematic structures of Au nanoparticles encoded with a Raman reporter and coated with a layer of thiol-PEG. (b) Preparation of targeted SERS tags by using a mixture of thiol-PEG and a heterofunctional PEG. Covalent conjugation of an EGFR-antibody fragment occurs at the exposed terminal of the hetero-functional PEG. (c) in vivo cancer targeting and SERS detection by using ScFv-antibody conjugated Au nanoparticles that recognize the tumor biomarker EGFR. SERS spectra were obtained from targeted and non-targeted SERS tags. Photographs showed a laser beam focusing on the tumor site or on the anatomical location of liver. (Reprinted with permission from ref. , Copyright 2007, Nature Publishing Group).
Figure 11
Figure 11
Scheme of SERS detection of adenosine through the plasmonic coupling of Raman reporter-labeled Au nanoparticles and a Au film. (Reprinted with permission from ref. , Copyright 2013, American Chemical Society).
Figure 12
Figure 12
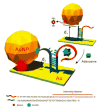
Schemes of sandwich SERS tag-based assays of (a) ATP, (b) cancer biomarkers in blood plasma, and (c) hepatitis B DNA (Reprinted with permission from refs. , and , Copyrights 2012, 2013, American Chemical Society).

Similar articles

Cited by

References

    1. Jones MR, Osberg KD, Macfarlane RJ, Langille MR, Mirkin CA. Chem Rev. 2011;111:3736–3827. - PubMed
    1. Ringe E, Zhang J, Langille MR, Sohn K, Cobley C, Au L, Xia Y, Mirkin CA, Huang J, Marks LD, Van Duyne RP. Mater Res Soc Symp Proc. 2010;1208:O10–02.
    1. Ringe E, Langille MR, Sohn K, Zhang J, Huang J, Mirkin CA, Van Duyne RP, Marks LD. J Phys Chem Lett. 2012;3:1479–1483. - PubMed
    1. Jain PK, El-Sayed MA. J Phys Chem C. 2007;111:17451–17454.
    1. Brandl DW, Mirin NA, Nordlander P. J Phys Chem B. 2006;110:12302–12310. - PubMed

Publication types

MeSH terms