Review
. 2014 Dec;15(12):829-45.
doi: 10.1038/nrg3813. Epub 2014 Nov 4.

A census of human RNA-binding proteins

Affiliations
Review

A census of human RNA-binding proteins

Stefanie Gerstberger et al. Nat Rev Genet. 2014 Dec.

Abstract

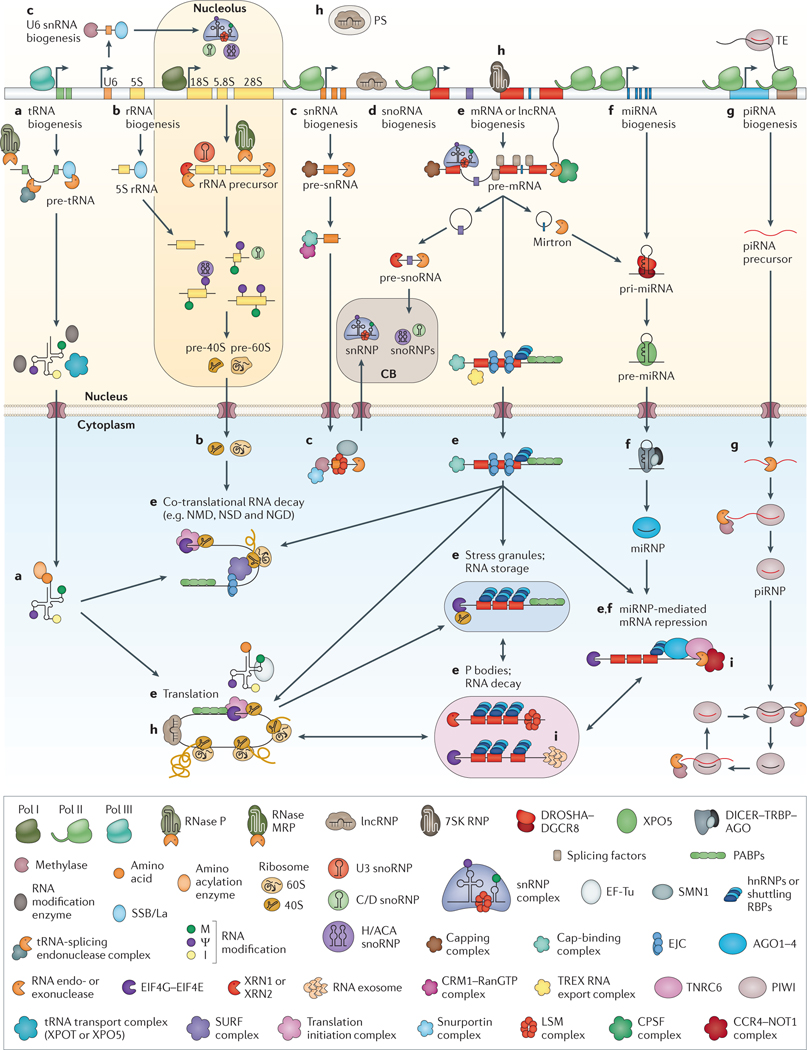
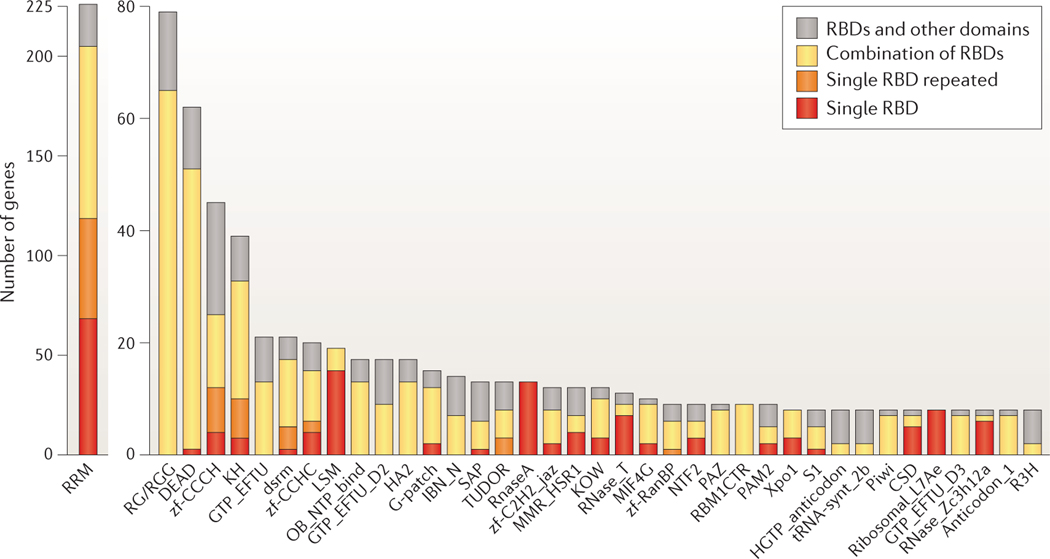
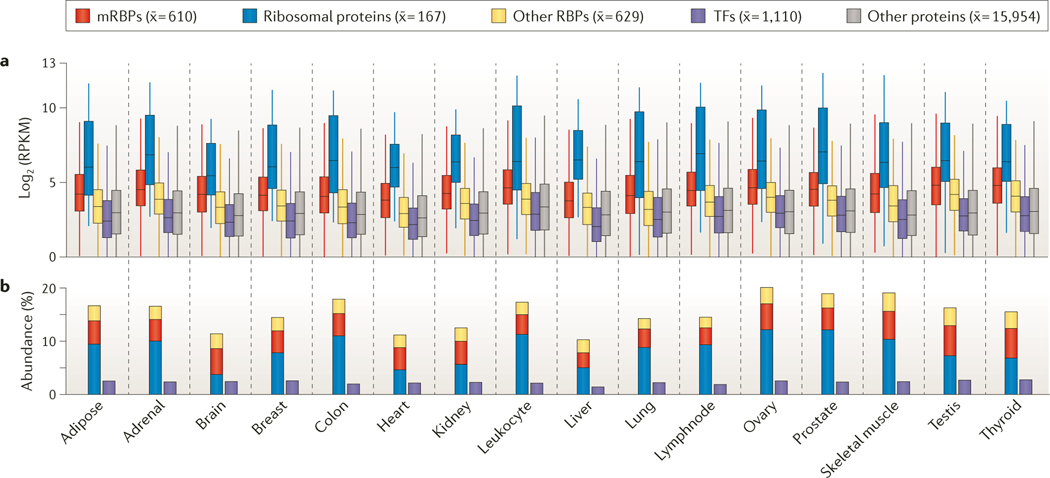
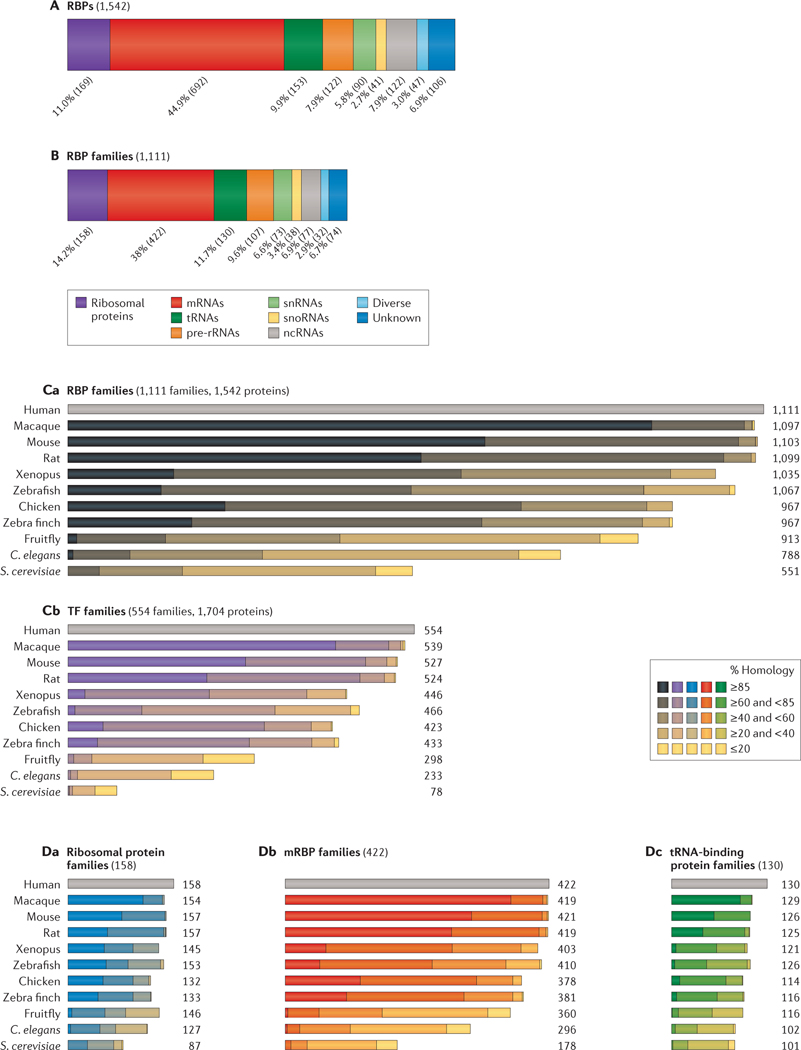
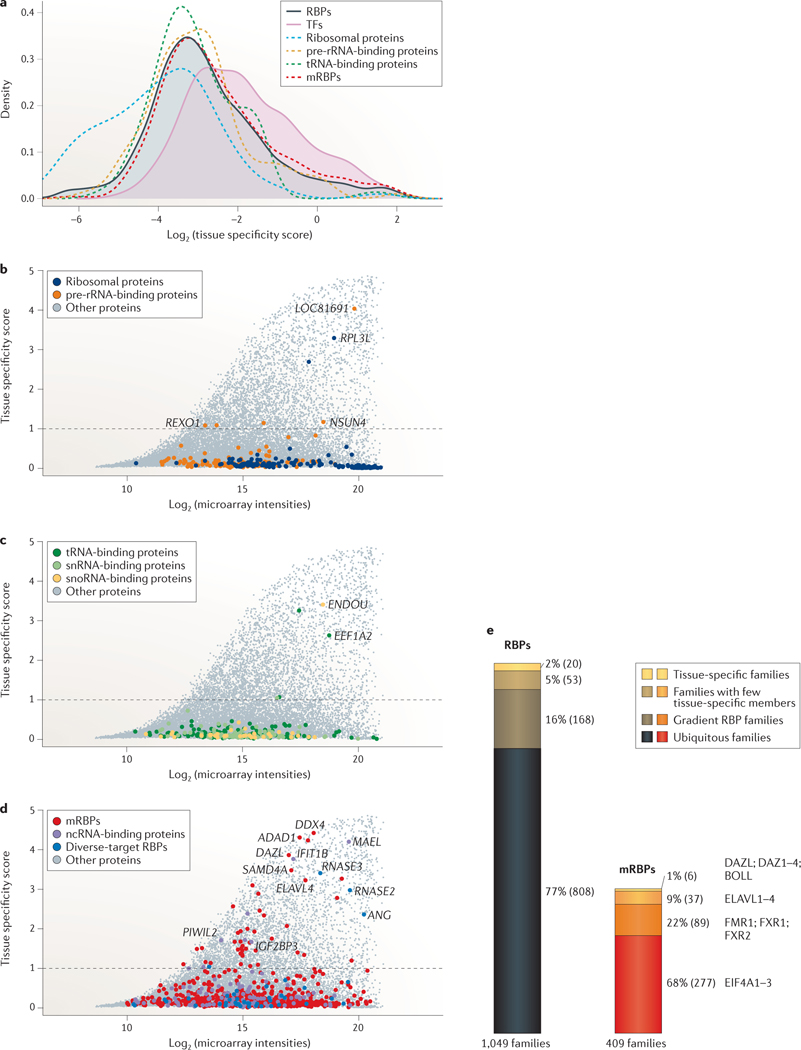
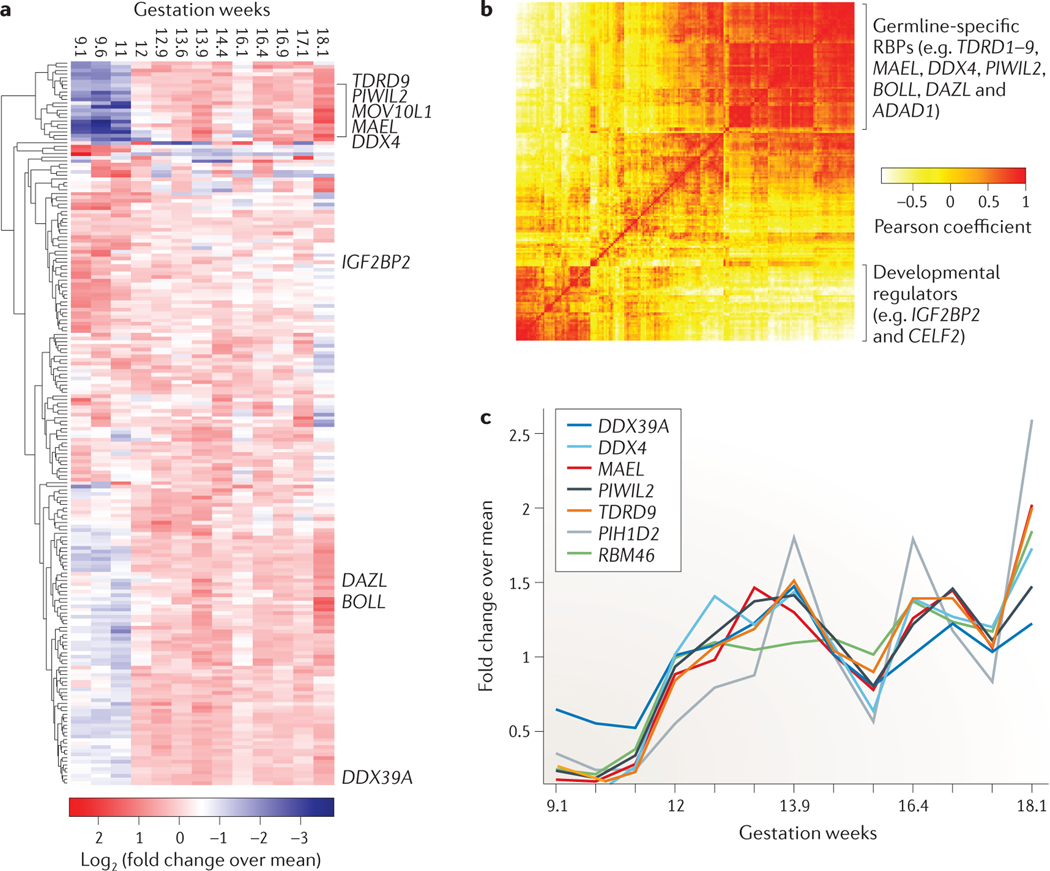
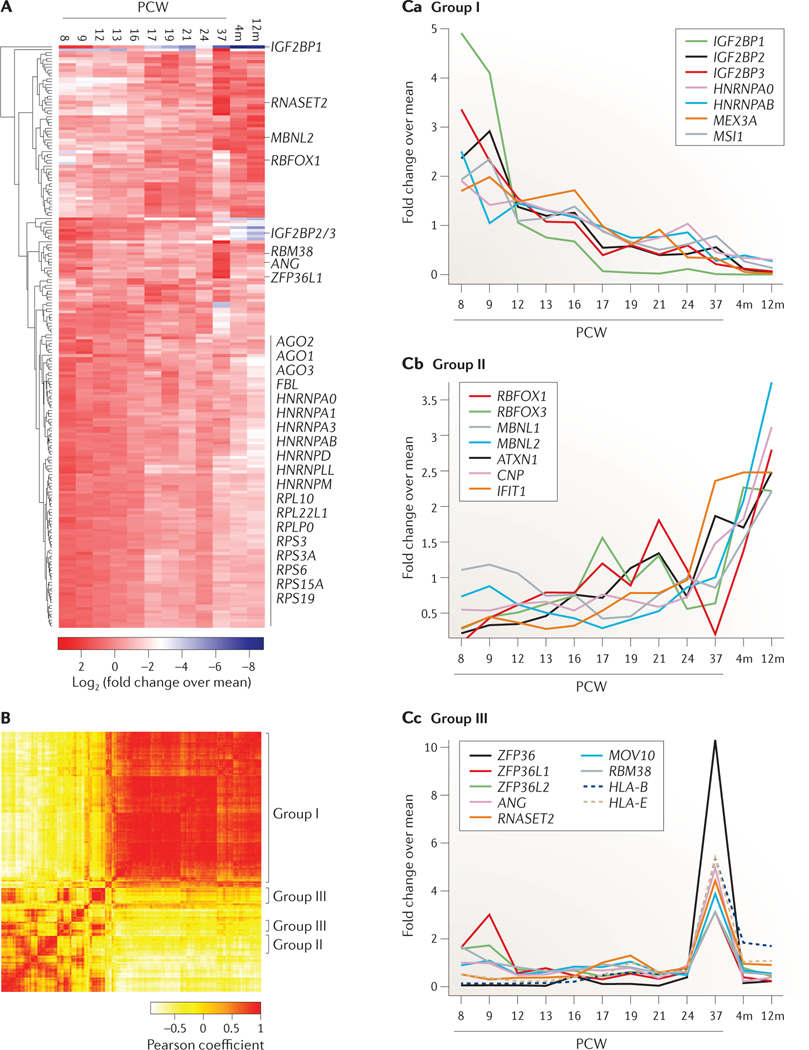
Post-transcriptional gene regulation (PTGR) concerns processes involved in the maturation, transport, stability and translation of coding and non-coding RNAs. RNA-binding proteins (RBPs) and ribonucleoproteins coordinate RNA processing and PTGR. The introduction of large-scale quantitative methods, such as next-generation sequencing and modern protein mass spectrometry, has renewed interest in the investigation of PTGR and the protein factors involved at a systems-biology level. Here, we present a census of 1,542 manually curated RBPs that we have analysed for their interactions with different classes of RNA, their evolutionary conservation, their abundance and their tissue-specific expression. Our analysis is a critical step towards the comprehensive characterization of proteins involved in human RNA metabolism.


Figures

Figure 1 |
Figure 1 |. Overview of the main post-transcriptional gene regulation pathways in eukaryotes.
An overview is given for the biogenesis, decay and function of the most abundant RNAs: tRNAs, ribosomal RNAs, small nuclear RNAs (snRNAs), small nucleolar RNAs (snoRNAs), mRNAs, microRNAs (miRNAs), PIWI-interacting RNAs (piRNAs) and long non-coding RNAs (lncRNAs). Processes are described from left to right. Referenced gene names and complexes in the figure are listed in Supplementary information S3 (table) and within the listed references. a | tRNAs are transcribed by RNA polymerase III (Pol III); the 5′ leader and 3′ trailer sequences are removed, introns are spliced, and the ends are joined. CCA nucleotides are added to 3′ ends, and nucleotide modifications — such as methylation (M), pseudouridylation (ψ) and deamination of adenosines to inosines (I) — are introduced before tRNA aminoacylation. b | The 5S rRNA is transcribed by Pol III, whereas 28S, 18S and 5.8S rRNAs are transcribed as one transcript by Pol I. The precursor is processed by RNA exonucleases, endonucleases and the ribonucleoprotein (RNP) RNase MRP, guided by U3 small nucleolar RNP (snoRNP). Nucleotide modifications are introduced by snoRNPs. rRNAs are assembled together with ribosomal proteins into ribosomal precursor complexes in the nucleus and transported to the cytoplasm, where they mature to functional ribosomes,,. c | Most snRNAs are transcribed by Pol II, capped and processed in the nucleus. When exported to the cytoplasm, they undergo methylation and assemble with LSM proteins into small nuclear ribonucleic particles (snRNPs) in a process aided by the survival motor neuron 1 (SMN1). These snRNPs are re-imported into the Cajal body (CB) within the nucleus, where they undergo final maturation and snRNP assembly. U6 and U6atac snRNAs are transcribed by Pol III and are alternatively processed in the nucleus and the nucleolus. Mature snRNPs form the core of the spliceosome. d | snoRNAs and small Cajal body-specific RNAs (scaRNAs) are processed from mRNA introns, capped and modified before they assemble into snoRNPs or scaRNPs in the CB. snoRNPs and scaRNPs carry out methylation and pseudouridylation of rRNAs, snoRNAs and snRNAs, or function in rRNA processing (for example, processing of U3 snoRNA). e | mRNAs are transcribed by Pol II, capped, spliced, edited and polyadenylated in the nucleus. Correctly matured mRNAs are exported into the cytoplasm. Regulatory RNA-binding proteins (RBPs) control correct translation, monitor stability, decay and localization, and shuttle mRNAs between actively translating ribosomes, stress granules and P bodies,,,–. f | miRNAs are either transcribed from separate genes by Pol II as long primary miRNA (pri-miRNA) transcripts or expressed from mRNA introns (mirtrons) and processed into hairpin pre-miRNAs in the nucleus. After transport into the cytoplasm, they are processed into 21-nucleotide-long double-stranded RNAs. One strand is incorporated into Argonaute (AGO) proteins (forming miRNA-containing RNPs (miRNPs)) and guides them to partially complementary target mRNAs to recruit deadenylases and repress translation. g | piRNAs are ~28-nucleotides-long, germline-specific small RNAs. Primary piRNAs are directly processed and assembled from long, Pol II-transcribed precursor transcripts, whereas secondary piRNAs are generated in the ‘ping pong’ cycle by the cleavage of complementary transcripts by PIWI proteins. Mature piRNAs are 2′-O-methylated and incorporated into PIWI proteins. The piRNA–PIWI complexes (piRNPs) silence transposable elements (TEs) either by endonucleolytic cleavage in the cytoplasm or through transcriptional silencing at their genomic loci in the nucleus. h | Most lncRNAs are transcribed and processed in a similar way to mRNAs. Nuclear lncRNAs play an active part in gene regulation by directing proteins to specific gene loci, where they recruit chromatin modification complexes and induce transcriptional silencing or activation. Other non-coding RNAs (for example, 7SK RNA) regulate transcription elongation rates or induce the formation of paraspeckles (PS). Cytoplasmic non-coding RNAs can modulate mRNA translation. i | Incorrectly processed RNAs are recognized by several complexes in the nucleus and cytoplasm that initiate and execute their degradation,. CPSF, cleavage and polyadenylation specificity factor; EJC, exon junction complex; hnRNP, heterogeneous nuclear RNP; NGD, no-go decay; NMD, nonsense-mediated RNA decay; NSD, non-stop decay; PABP, poly(A)-binding protein.
Figure 2 |
Figure 2 |. Single or repeated presence of frequent RBDs in human genes.
Counts of proteins with RNA-binding domains (RBDs) from the Protein families (Pfam) database with eight or more members in humans. Domain names are listed according to Pfam nomenclature; additional information can be found in Supplementary information S2 (box). In addition, low-complexity RG- or RGG-repeat regions — defined by at least three RG/RGG repeats spaced 10 amino acids or fewer apart — in RNA-binding proteins (RBPs) are shown. Counts are further subdivided to indicate the number of genes containing one RBD as the only structural domain in the encoded protein (red); repeats of the same class of RBD (orange); one or more RBDs in combination with RBDs of different classes (yellow); or combinations of the RBD with one or more domains unrelated to RNA metabolic function (grey), for example, protein kinase domains.
Figure 3 |
Figure 3 |. Transcript abundance of RBPs and TFs across 16 different human tissues.
a | Distribution of gene expression levels of protein-coding genes, measured by RNA sequencing (RNA-seq) with RPKM (reads per kilobase per million mapped reads) expression values ≥1, is displayed. Shown as subgroups are mRNA-binding proteins (mRBPs), ribosomal proteins, the remaining RNA-binding proteins (RBPs), transcription factors (TFs) and the residual protein-coding transcriptome. For each group, the mean number of expressed proteins across the tissues is shown in parentheses. b | Cumulative abundance of RBPs and TFs as percentages of all RNA-seq reads is shown.
Figure 4 |
Figure 4 |. Target RNA classification and evolutionary conservation of RBP and TF paralogous families.
A,B | RNA-binding proteins (RBPs) and RBP families are grouped by their respective targets: ribosomal proteins, mRNA, tRNA, pre-ribosomal RNA, small nuclear RNA (snRNA), small nucleolar RNA (snoRNA), non-coding RNA (ncRNA); diverse targets and unknown targets are also indicated. Percentage and counts (in parentheses) of RBPs in the category are shown. In part B, RBP paralogues are grouped into families defined by 20% sequence identity according to the Ensembl Compara database. C | The number of RBP families conserved across 11 species and their percentage identity score for human RBP families (part Ca) and transcription factor (TF) families (part Cb) are shown. The number of families with different degrees of conservation are grouped into the following five categories: ≥85% homology; ≥60% and <85% homology; ≥40% and <60% homology; ≥20% and <40% homology; and ≤20% homology. D | The number of paralogous families and degree of conservation are shown for human ribosomal proteins (part Da), mRNA-binding proteins (mRBPs; part Db) and tRNA-binding proteins (part Dc). C. elegans, Caenorhabditis elegans; S. cerevisiae, Saccharomyces cerevisiae.
Figure 5 |
Figure 5 |. Tissue specificity of RBPs across 31 human tissues and organs.
A tissue specificity score was calculated from mRNA expression levels of 1,441 RNA-binding proteins (RBPs) and 1,463 transcription factors (TFs) profiled in a human microarray tissue atlas assessing expression across 31 tissues. a | Densities of the log2-transformed tissue specificity scores are shown for RBPs, TFs, ribosomal proteins, mRNA-binding proteins (mRBPs), as well as tRNA- and pre-ribosomal RNA-binding proteins. The densities of RBPs and TFs are filled in shades to highlight their shifts in distribution. b | Log2 maximum expression intensity values of a gene versus tissue specificity scores for ribosomal proteins and pre-rRNA-binding proteins are compared with that of the residual proteome. Tissue-specific genes were defined as genes with scores ≥1 (dashed line). Selected genes are highlighted. c | A similar analysis is shown for tRNA-, small nuclear RNA (snRNA)- and small nucleolar RNA (snoRNA)-binding proteins. d | Same as part b for mRBPs, non-coding RNA (ncRNA)-binding proteins and diverse-target RBPs. e | Expression of 1,049 paralogous RBP families, of which 409 are mRBP families, is profiled in the tissue atlas (scaled to relative size). Families are grouped into different categories of expression. Representative paralogous families are highlighted for mRBPs. A total of 2% of RBPs and 1% of mRBP families displayed tissue-specific expression for all their members; 5% of RBPs and 9% of mRBP families had one or more members with tissue specificity scores ≥1. 16% of RBPs and 22% of mRBP families had members with tissue-specificity scores ranging between 0.3 and 1, classified here as gradient RBP families, and 77% of RBPs and 68% of mRBP families displayed little variation in expression (tissue specificity scores <0.3), which are referred to as ubiquitous RBP and mRBP families, respectively.
Figure 6 |
Figure 6 |. Expression of RBPs across nine gestational stages of human fetal ovarian development.
The top 200 most differentially expressed RNA-binding proteins (RBPs) from a microarray study profiling human fetal gonad development are shown. For each gene microarray, intensity values were normalized to relative fold changes by dividing the expression value by the mean expression value across developmental stages. a | The heatmap shows the log2-transformed relative fold changes of the RBPs sorted by unsupervised clustering. Some gonad-specific RBPs are indicated. b | The Pearson correlation map indicates correlated expression changes of the 200 selected RBPs. Functionally related RBPs in gonad development cluster into a distinct expression group. c | The plot shows the normalized expression changes of selected genes relevant in gonad development.
Figure 7 |
Figure 7 |. Expression of RBPs across human fetal hippocampus development.
The top 200 most differentially expressed RNA-binding proteins (RBPs) are shown across 12 stages of human hippocampus development ranging from post-conception week (PCW) 8 up to 12 months (12m) after birth, as profiled by RNA-sequencing (data from the BrainSpan database). For each gene, RPKM (reads per kilobase per million mapped reads) values were normalized to relative fold changes by dividing the expression value by the mean expression value across developmental stages. A | The heatmap shows the log2-transformed relative fold changes of the RBPs sorted by unsupervised clustering. B | The Pearson correlation map indicates correlated expression changes of the 200 selected RBPs. C | Characteristic expression fold changes across developmental stages are shown for genes in the three different groups. Group I includes genes with high expression levels at early PCWs, which rapidly decrease at later stages (part Ca). Group II includes genes with low expression levels at early PCWs and rapidly increasing levels at late PCWs and postnatal stages (part Cb). Group III includes genes with a single high-expression peak at 37 PCWs (part Cc).

References

    1. Cech TR & Steitz JA The noncoding RNA revolution — trashing old rules to forge new ones. Cell 157, 77–94 (2014).

      This is a concise overview of the different RNA classes in bacteria, archaea and eukaryotes, highlighting their discovery and regulatory roles.

    1. Konig J, Zarnack K, Luscombe NM & Ule J. Protein–RNA interactions: new genomic technologies and perspectives. Nature Rev. Genet. 13, 77–83 (2011). - PubMed
    1. Ascano M, Hafner M, Cekan P, Gerstberger S. & Tuschl T. Identification of RNA–protein interaction networks using PAR-CLIP. Wiley Interdiscip. Rev. RNA3, 159–177 (2011). - PMC - PubMed
    1. Gerstberger S, Hafner M. & Tuschl T. Learning the language of post-transcriptional gene regulation. Genome Biol. 14, 130 (2013). - PMC - PubMed
    1. Mann M. Functional and quantitative proteomics using SILAC. Nature Rev. Mol. Cell. Biol. 7, 952–958 (2006). - PubMed

Publication types