

Quantification of cytosolic interactions identifies Ede1 oligomers as key organizers of endocytosis
- PMID: 25366307
- PMCID: PMC4299599
- DOI: 10.15252/msb.20145422
Quantification of cytosolic interactions identifies Ede1 oligomers as key organizers of endocytosis
Abstract
Clathrin-mediated endocytosis is a highly conserved intracellular trafficking pathway that depends on dynamic protein-protein interactions between up to 60 different proteins. However, little is known about the spatio-temporal regulation of these interactions. Using fluorescence (cross)-correlation spectroscopy in yeast, we tested 41 previously reported interactions in vivo and found 16 to exist in the cytoplasm. These detected cytoplasmic interactions included the self-interaction of Ede1, homolog of mammalian Eps15. Ede1 is the crucial scaffold for the organization of the early stages of endocytosis. We show that oligomerization of Ede1 through its central coiled coil domain is necessary for its localization to the endocytic site and we link the oligomerization of Ede1 to its function in locally concentrating endocytic adaptors and organizing the endocytic machinery. Our study sheds light on the importance of the regulation of protein-protein interactions in the cytoplasm for the assembly of the endocytic machinery in vivo.
Keywords: Ede1; endocytosis; fluorescence (cross‐)correlation spectroscopy.
© 2014 The Authors. Published under the terms of the CC BY 4.0 license.
Figures
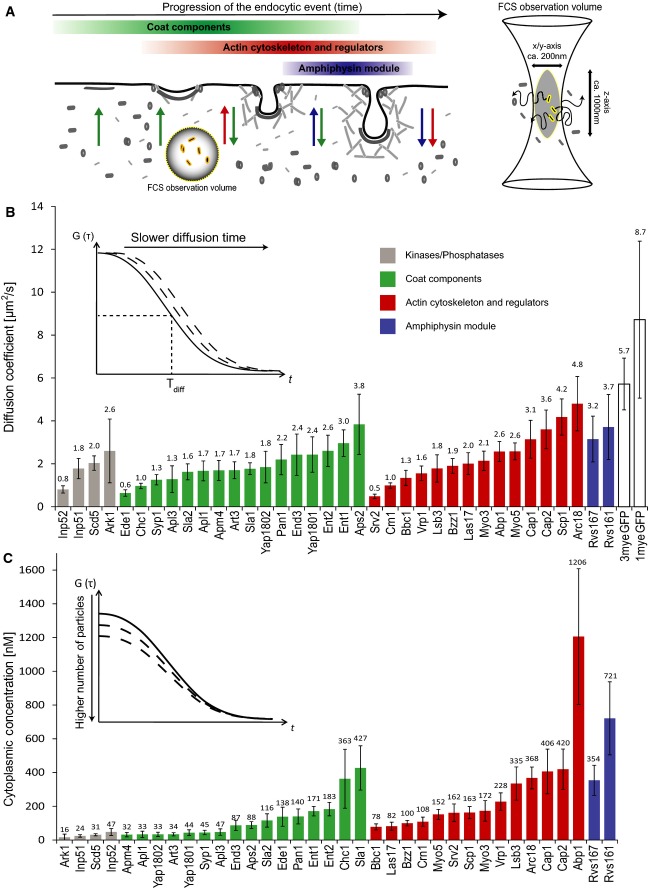
Endocytic proteins are disassembled from the endocytic site or the maturing vesicle, released into the cytoplasm, and subsequently recruited to newly forming endocytic sites. The FCS/FCCS observation volume in this study is positioned in the cytoplasm of living yeast cells so that only the cytoplasmic pool of the fluorescently labeled proteins is investigated.
Plot of the FCS-determined diffusion coefficients of labeled endocytic proteins, 1myeGFP, and 3myeGFP. Error bars represent the standard deviation derived from single cell measurements (Supplementary Table S1). The average diffusion time is calculated using the half-width of the autocorrelation curve. Proteins within a functional module are sorted from left to right according to their diffusion coefficient values. The color of the bars reflects the functional module that the respective protein belongs to (as indicated in A): green = coat components; red = actin cytoskeleton regulators; blue = amphiphysin module.
Plot of the cytoplasmic concentration of endocytic proteins as quantified by FCS. Concentration is calculated using the amplitude of the autocorrelation curve. Error bars represent the standard deviation. Color scheme of the bars is the same as in (B). For details, see also Supplementary Table S1.
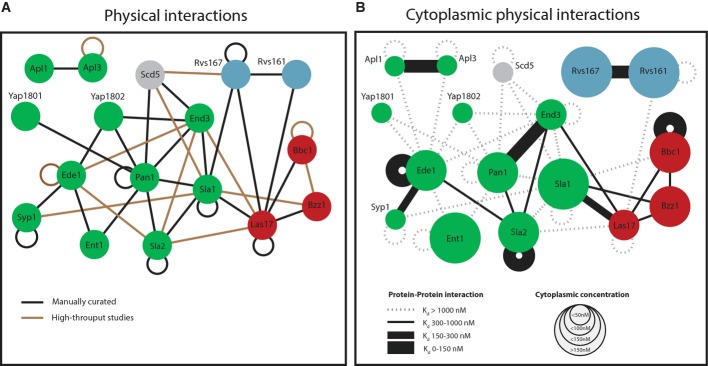
Previously reported protein–protein interactions between selected endocytic proteins (see also Supplementary Table S2). Color code of nodes: green = coat components; red = actin cytoskeleton regulators; and blue = amphiphysin module. Loops indicate self-interactions.
Network of cytoplasmic interactions based on FCCS data. The size of the nodes represents the cytoplasmic concentration of the protein. Lines between the nodes indicate the protein pairs that were measured by FCCS. A dotted line indicates that no interaction was detected. A solid line indicates an interaction, and the thickness of the solid line represents the strength of the interaction. The expression level of Rvs167-3mCherry was highly variable between individual cells. This was not the case for the GFP-labeled version of the protein, so we only used this fluorescently tagged version. Due to the cross talk from the green into the red channel, we did not test the interaction between Rvs167-1myeGFP and proteins with lower expression levels.
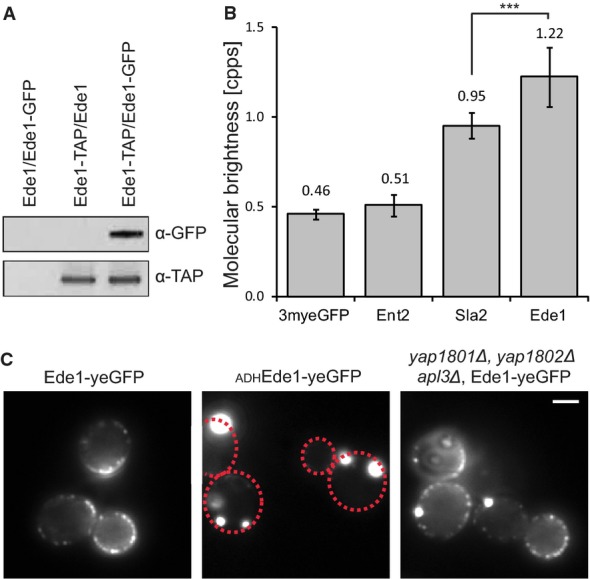
Tandem affinity purification of a diploid Ede1-TAP/Ede1-GFP strain. Purified proteins were subject to SDS–PAGE and were immunoblotted with α-GFP to detect Ede1-GFP and α-TAP to detect Ede1-TAP.
Average photon counts per particle per second, measured in 11–14 individual cells per strain. Error bars represent the standard deviation (***P-value ≤ 0.001).
Fluorescence images of Ede1-yeGFP expressed from its endogenous promoter (left), Ede1-yeGFP expressed from the ADH promoter (middle), and endogenously expressed Ede1-yeGFP in a yap1801, yap1802Δ, and apl3Δ strain (right). Scale bar corresponds to 2 μm. Where needed, dashed red lines were used to outline the cell boundaries.
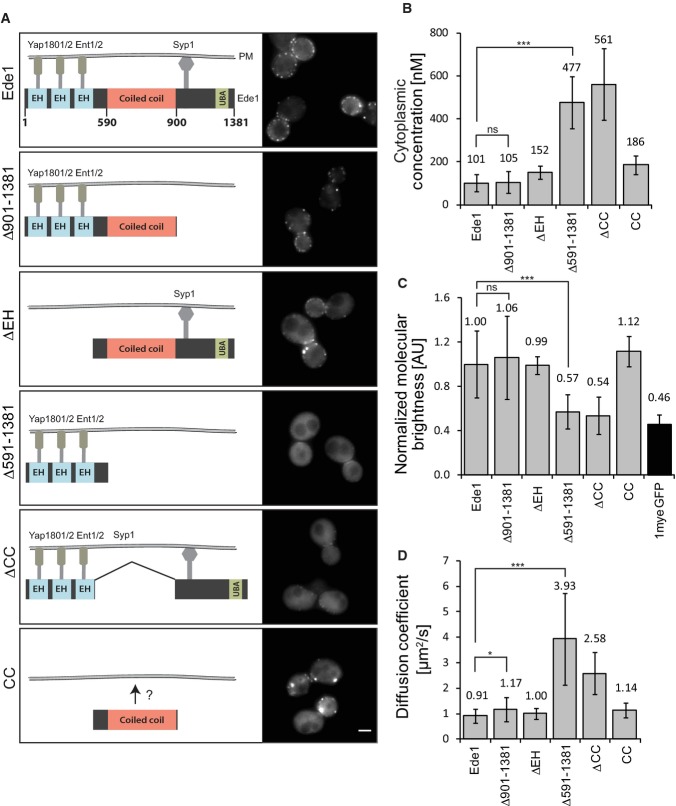
A Schematic overview of the domain structure of Ede1 and ede1 mutants with proposed interaction sites with endocytic adaptors. Domain sizes are schematic and do not exactly match the actual length. The corresponding fluorescence images are shown on the right. Scale bar corresponds to 2 μm.
B–D Comparison of the cytoplasmic concentration (B), the normalized brightness per particle per second (C), and the cytoplasmic diffusion coefficient of Ede1 and its truncation mutants (D). Measurements were performed in 12–44 individual cells. Error bars represent standard deviation (***P-value ≤ 0.001; *P-value ≤ 0.05; ns, not significant).

Average projection of Syp1-3myeGFP in wild-type, ede1ΔCC, and ede1Δ over a 30-s interval. Scale bar corresponds to 2 μm.
FCS measurements of Syp1-3myeGFP in the cytoplasm of wild-type or ede1Δ cells. Measurements were performed in 12–14 individual cells. Error bars represent standard deviation (**P-value ≤ 0.01).
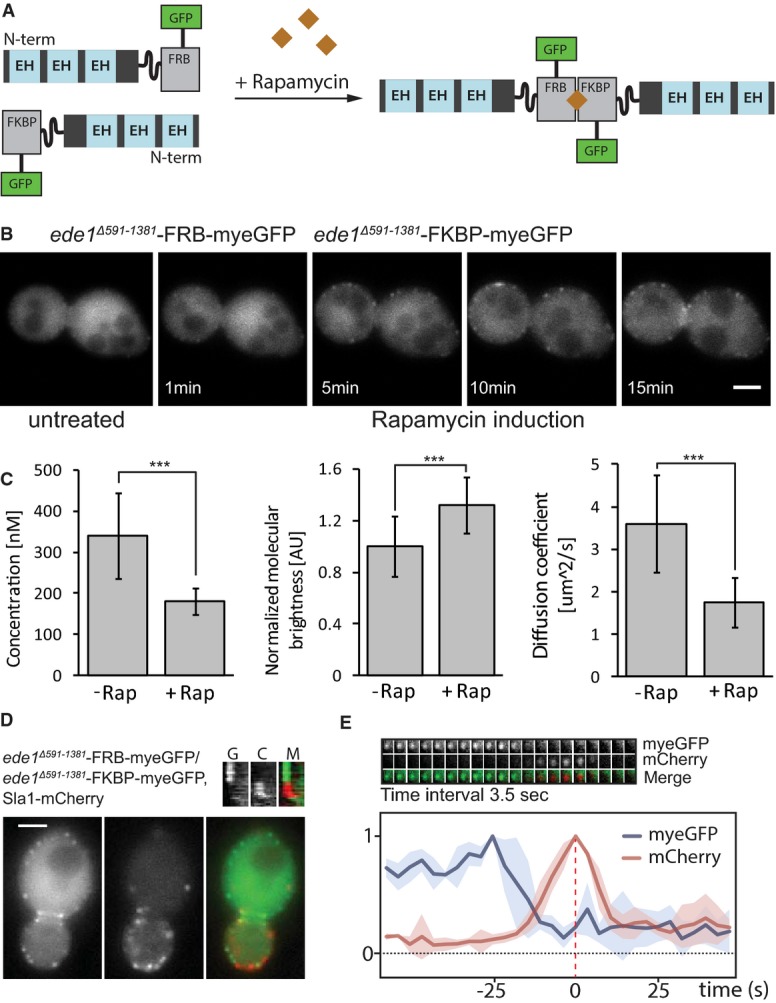
Schematic representation of the artificial dimerization of ede1Δ591–1381 mutants by rapamycin.
Time-lapse microscopy of an ede1Δ591–1381-FRB-myeGFP/ede1Δ591–1381-FKBP-myeGFP strain before and after rapamycin treatment. Scale bar corresponds to 2 μm.
Quantification of the cytoplasmic concentration, normalized brightness per particle per second, and diffusion coefficient for an ede1Δ591–1381-FRB-myeGFP/ede1Δ591–1381-FKBP-myeGFP strain before and 30 min after rapamycin treatment (***P-value ≤ 0.001).
Green (left), red (middle), and merge (right) of ede1Δ591–1381-FRB-myeGFP/ede1Δ591–1381-FKBP-myeGFP, Sla1-1mCherry strain 30 min after rapamycin treatment. Scale bar corresponds to 2 μm.
Top: Time series of a single cortical patch in the same strain 30 min after rapamycin treatment. Time interval between frames is 3.5 s. Bottom: Quantification of the myeGFP and mCherry fluorescence in this strain for four patches plotted as a function of time. Individual intensity curves for myeGFP (blue) and mCherry (red) were normalized independently. For each patch, the myeGFP and mCherry curves were aligned to the peak intensity of Sla1 (= time point 0) in time.
References
-
- Aguilar RC, Watson HA, Wendland B. The yeast Epsin Ent1 is recruited to membranes through multiple independent interactions. J Biol Chem. 2003;278:10737–10743. - PubMed
-
- Bacia K, Kim SA, Schwille P. Fluorescence cross-correlation spectroscopy in living cells. Nat Methods. 2006;3:83–89. - PubMed
-
- Banaszynski LA, Liu CW, Wandless TJ. Characterization of the FKBP.rapamycin.FRB ternary complex. J Am Chem Soc. 2005;127:4715–4721. - PubMed
-
- Brach T, Godlee C, Moeller-Hansen I, Boeke D, Kaksonen M. The initiation of clathrin-mediated endocytosis is mechanistically highly flexible. Curr Biol. 2014;24:548–554. - PubMed
Publication types
MeSH terms
Substances
LinkOut - more resources
Full Text Sources
Other Literature Sources
Molecular Biology Databases
Miscellaneous
