. 2014 Nov 17;211(12):2467-79.
doi: 10.1084/jem.20140283. Epub 2014 Nov 3.

Hrd1-mediated BLIMP-1 ubiquitination promotes dendritic cell MHCII expression for CD4 T cell priming during inflammation

Affiliations

Hrd1-mediated BLIMP-1 ubiquitination promotes dendritic cell MHCII expression for CD4 T cell priming during inflammation

Heeyoung Yang et al. J Exp Med. .

Abstract

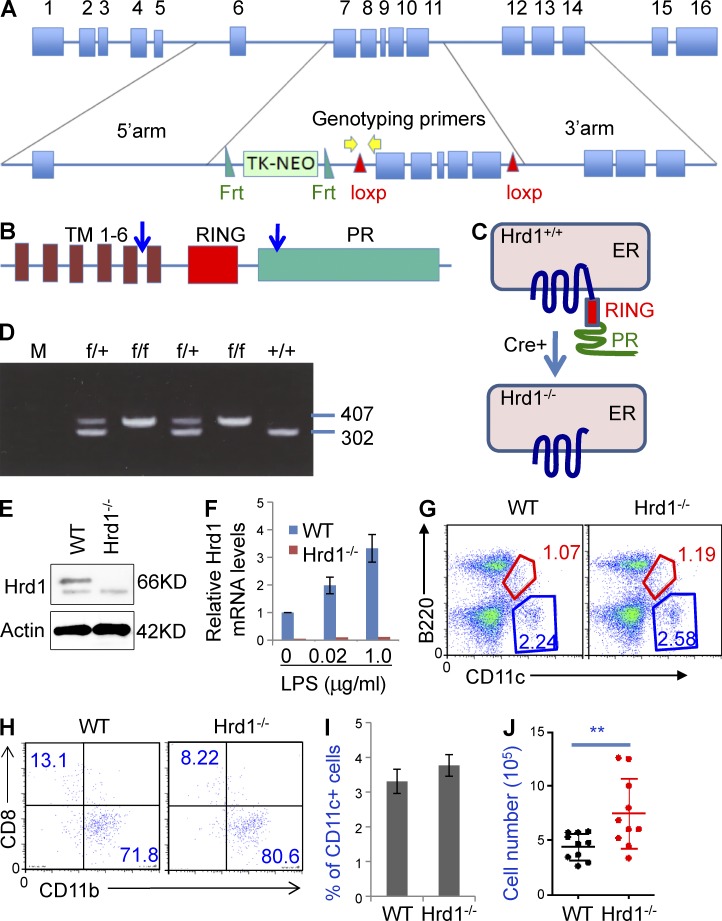
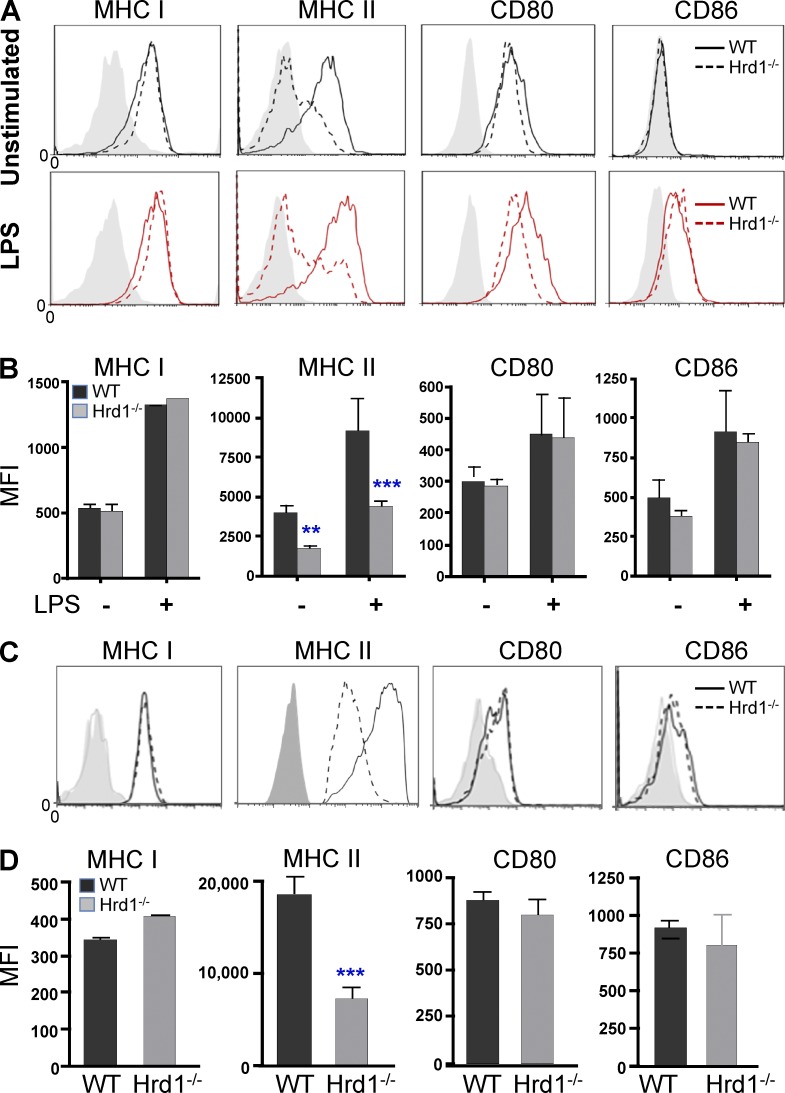
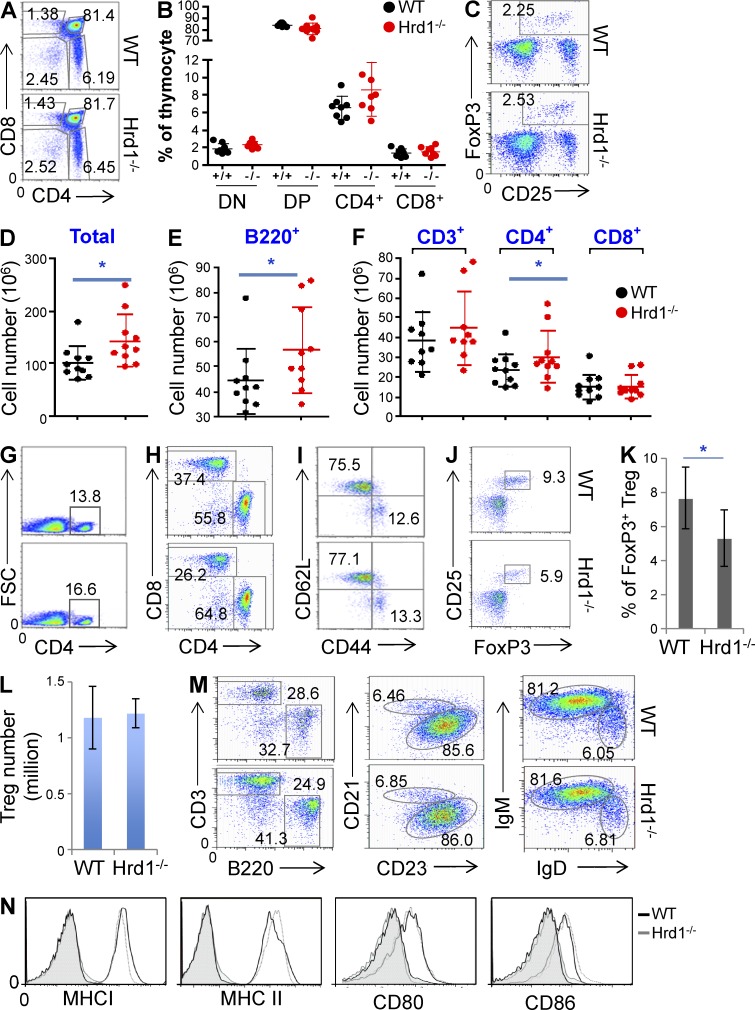
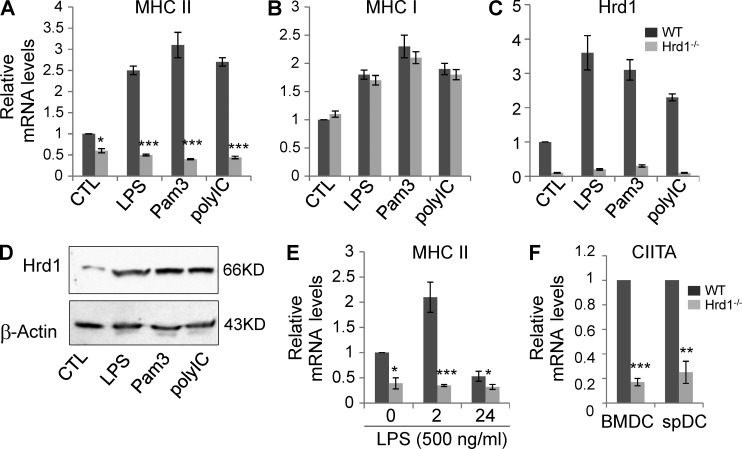
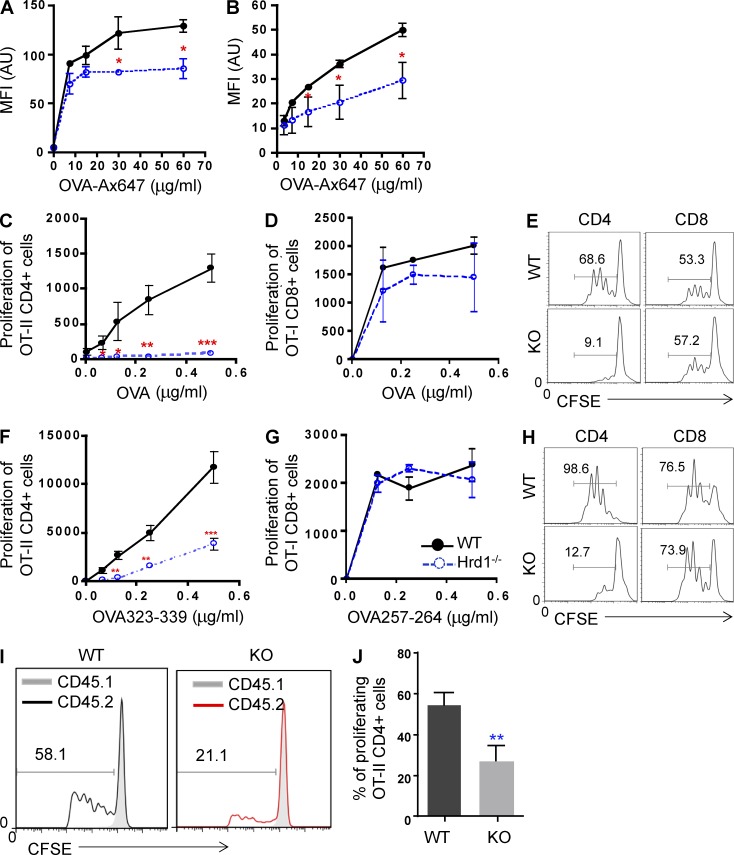
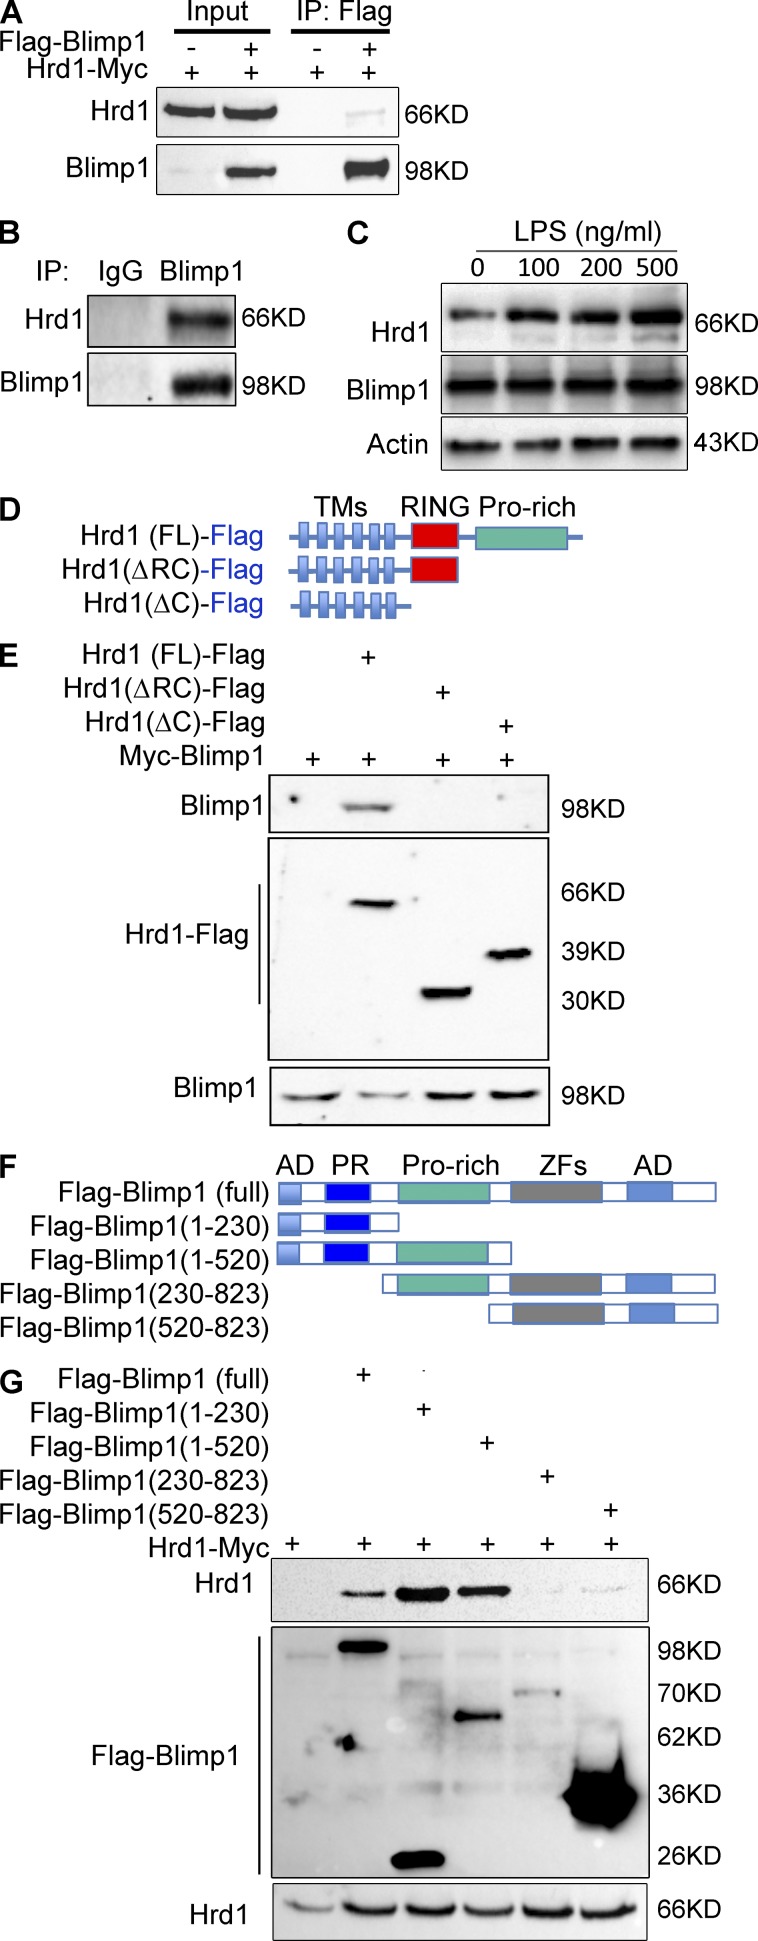
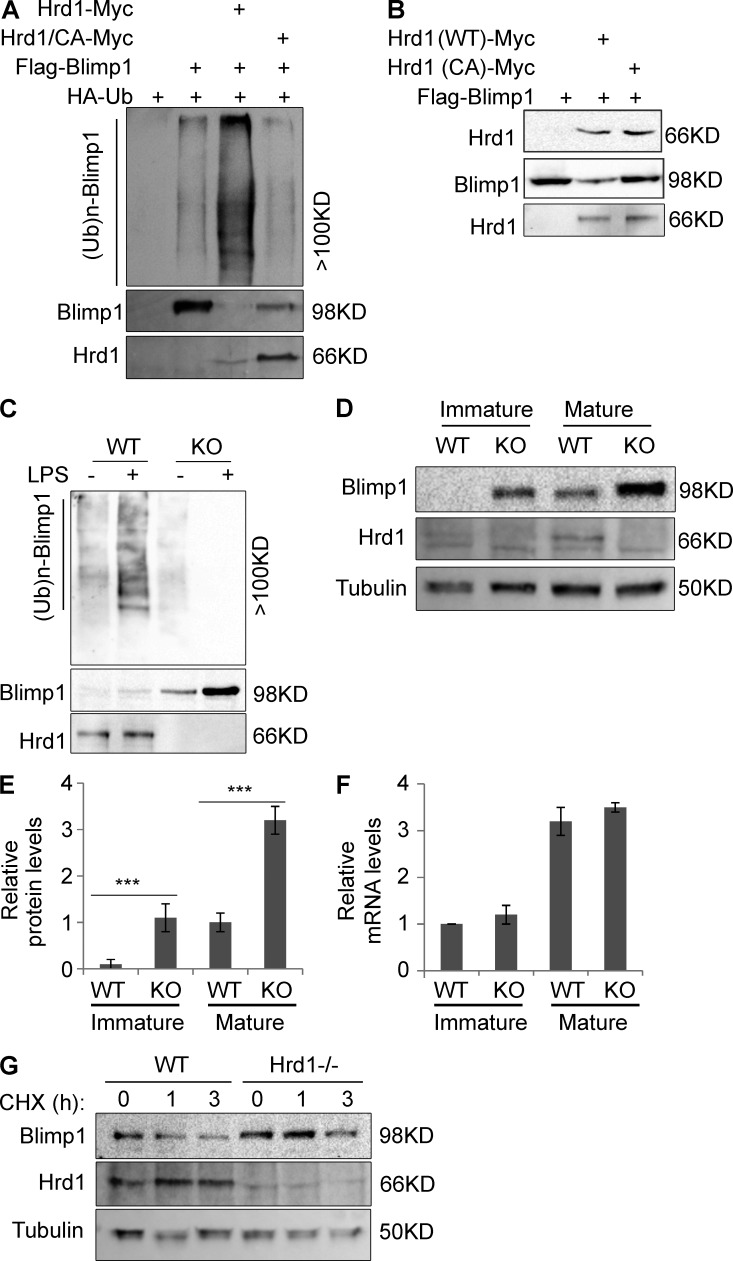
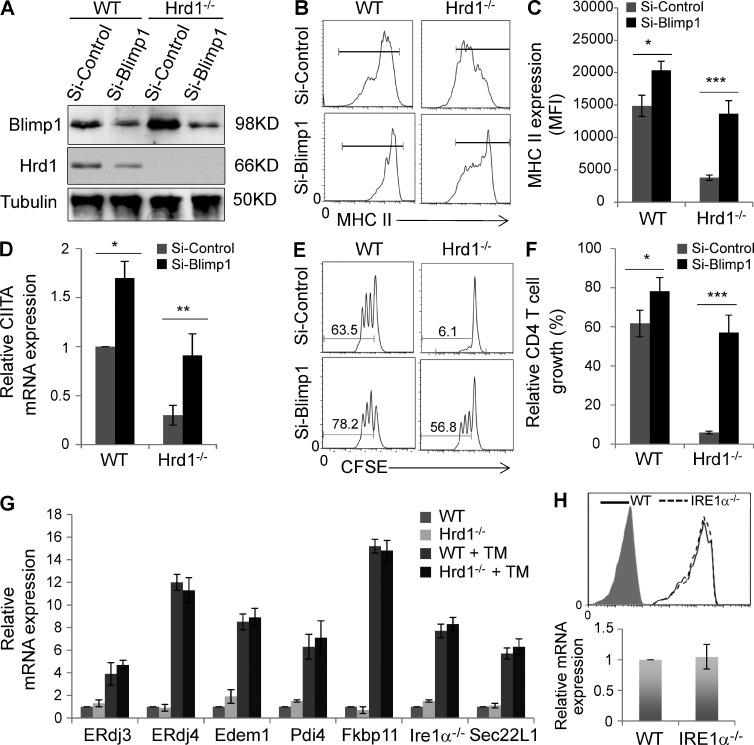
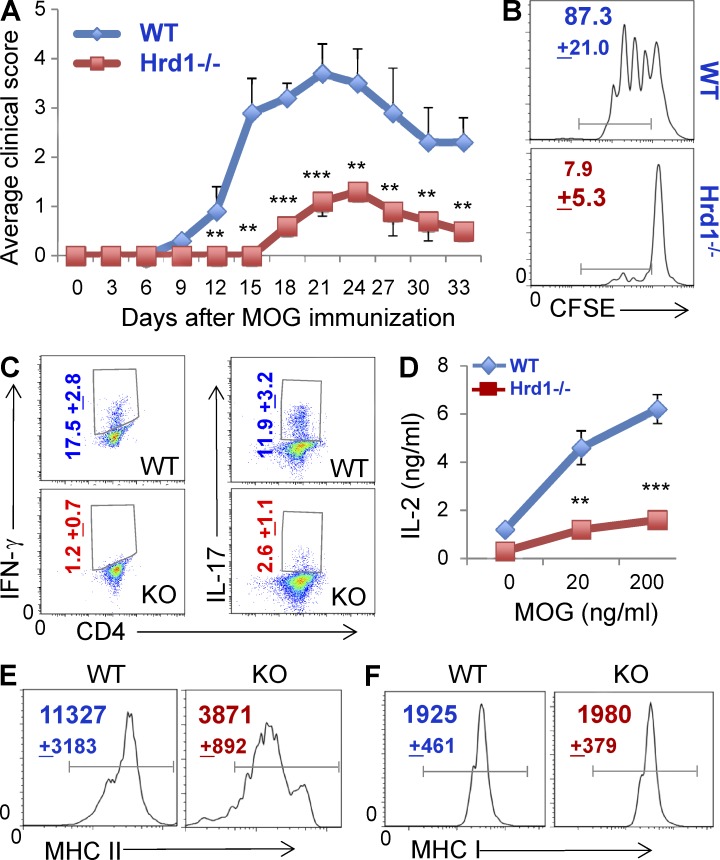
The ubiquitin pathway plays critical roles in antigen presentation. However, the ubiquitin ligases that regulate MHC gene transcription remain unidentified. We showed that the ubiquitin ligase Hrd1, expression of which is induced by Toll-like receptor (TLR) stimulation, is required for MHC-II but not MHC-I transcription in dendritic cells (DCs). Targeted Hrd1 gene deletion in DCs diminished MHC-II expression. As a consequence, Hrd1-null DCs failed to prime CD4(+) T cells without affecting the activation of CD8(+) T cells. Hrd1 catalyzed ubiquitination and degradation of the transcriptional suppressor B lymphocyte-induced maturation protein 1 (BLIMP1) to promote MHC-II expression. Genetic suppression of Hrd1 function in DCs protected mice from myelin oligodendrocyte glycoprotein (MOG)-induced experimental autoimmune encephalomyelitis (EAE). We identified Hrd1-mediated BLIMP1 ubiquitination as a previously unknown mechanism in programming DC for CD4(+) T cell activation during inflammation.


Figures

Figure 1.
Figure 1.
Targeted disruption of the Hrd1 gene in DCs. (A) Structures of the Hrd1 WT and targeted alleles. Exons and the neomycin phosphotransferase gene (Neo) driven by the thymidine kinase (TK) promoter are shown. The TK-NEO cassette is flanked by 2 FRT sites and exons 7–11 are flanked by 2 LoxP sites. (B and C) Domain structure of Hrd1 protein. The ER membrane-anchoring protein Hrd1 carries 6 transmembrane (TM) domains, one RING finger domain, and a C terminus proline-rich domain. The deletion of floxed Hrd1 gene by Cre recombinase destroys Hrd1 protein expression. (D) Genotyping of Hrd1-floxed mice. Tail snips from a litter of Hrd1flox/wt X Hrd1flox/wt offspring were collected for DNA extraction and PCR analysis. The 302-bp PCR product is the WT allele and the 407-bp product is the mutant allele. (E and F) BM cells were isolated from WT and Hrd1 conditional KO (Hrd1−/−) mice and cultured under DC differentiation conditions. (E) Hrd1 protein expression was analyzed by immunoblotting (top) using β-actin as a loading control (bottom). (F) Hrd1 mRNA levels were determined by real-time quantitative RT-PCR. Hrd1 levels in WT DCs increased with LPS treatment. (G) Cell surface expression of B220 and CD11c in total splenocytes from WT and Hrd1−/− mice was analyzed by flow cytometry. (H) CD11c+B220 cells were gated and the expression of CD8 and CD11b was analyzed. (I and J) The mean percentages (I) and absolute numbers (J) of CD11c+ cells in the spleens of 10 pairs of WT and Hrd1−/− mice are shown (n = 10).
Figure 2.
Figure 2.
Hrd1 promotes MHC-II expression in DCs. (A and B) WT and Hrd1−/− BMDCs were cultured overnight with or without LPS (200 ng/ml). Expression levels of MHC-I, MHC-II, CD80, and CD86 were analyzed by flow cytometry. (A and B) Representative images (A) and the mean fluorescence identity (MFI; B) from 7 independent experiments are shown (n = 7). (C and D) The expression levels of MHC-I, MHC-II, CD80, and CD86 on gated CD11c+ DCs in WT and Hrd1−/− splenocytes were analyzed. (C and D) Representative images (C) and the average MFI (D) from nine pairs of mice are shown (n = 9). (B and D) Data are reported as mean ± SD and were analyzed by Student’s t test. **, P < 0.01; ***, P < 0.005.
Figure 3.
Figure 3.
Characterization of T and B lymphocytes in Hrd1f/fCD11c-Cre+ (Hrd1−/−) mice. (A–C) Analysis of T cell development in thymus of Hrd1−/− mice. CD4 and CD8 expression in total thymocytes was analyzed by flow cytometry. (A) Representative images are shown from experiments run using seven pairs of WT and Hrd1−/− mice. (B) The percentages of CD4/CD8 double-negative (DN), double-positive (DP), and single-positive (SP) cells from seven pairs of mice are shown. (C) The FoxP3+CD25+ T reg cells in the gated CD4 SP T cells were analyzed; representative images from seven pairs of mice are shown. (D–N) Cellularity analysis in the spleens of Hrd1−/− mice. The absolute numbers of total splenocytes (D), B220+ B cells (E), and T cells (F) from nine pairs of mice are shown. (G) CD4+ T cells in the spleens of WT and Hrd1−/− mice were analyzed by flow cytometry. (H) The ration of CD4 and CD8 T cells in the gated CD3+ population was analyzed. (I–L) Gated CD4+ T cells were used for the analysis of CD44 and CD62L expression (I) and FoxP3+CD25+ T reg cells (J). (K) Mean percentages (K) and total numbers of T reg cells (L) in nine pairs of mice are shown. Data are reported as means ± SEM and Student’s t test was used for the statistical analysis. *, P < 0.05. (M and N) Analysis of B cells in the spleens of Hrd1−/− mice. (M) The percentages of CD3+ T cells and B220+ B cells in the spleen of WT and Hrd1 conditional KO mice are analyzed (left). The gated B220+ B cells were analyzed for their expression of CD21 and CD23 (middle), and IgM and IgD (right). (N) The expression levels of MHC-I, MHC-II, CD80, and CD86 on the surface of gated B220+ B cells were analyzed. Images are representative for at least nine pairs of mice (n = 9).
Figure 4.
Figure 4.
Hrd1 regulates MHC-II expression at the mRNA level. WT and Hrd1−/− BMDCs were stimulated with the indicated TLR agonists for 2 h. Total mRNA was extracted and levels of MHC-II (A), MHC-I (B), and Hrd1 (C). (D) WT and Hrd1−/− BMDCs were stimulated with each indicated TLR agonist for 24 h. Hrd1 protein expression levels were determined by Western blotting with β-actin as a loading control. (E) WT and Hrd1−/− BMDCs were stimulated with 500 ng/ml LPS for 2 or 24 h. The expression levels of MHC-II were determined by real-time PCR. (F) CIITA expression in BMDCs and sorted CD11c+ splenic DCs without TLR stimulation was quantified by real-time RT-PCR using β-actin as a control. Data are reported as mean ± SD from five independent experiments (n = 5). Student’s t test was used for statistical analysis. *, P < 0.05; **, P < 0.01; **, P < 0.01; ***, P < 0.005.
Figure 5.
Figure 5.
Hrd1 deficiency impairs DC-mediated CD4+ T cell priming. (A and B) BMDCs (A) and sorted CD11c+ cells (B) from the spleen were cultured with Ax647-OVA at the indicated concentrations for 1 h and washed. Fluorescence intensity was analyzed by flow cytometry and data are reported as mean ± SD from five independent experiments. (C–E) BMDCs were stimulated with LPS in the presence of OVA protein overnight, washed, and co-cultured with either CD4+ OT-II T cells or CD8+ OT-II T cells for 3 d. T cell proliferation was analyzed by 3H-thymidine incorporation (C and D) or CFSE dilution (E). (F–H) BMDCs were stimulated with LPS in the presence of either OVA323-339 (F and H [left]) or OVA257-264 (G and H [right]) peptides overnight, washed, and co-cultured with either CD4+ OT-II T cells or CD8+ OT-II T cells for 3 d. T cell proliferation was analyzed by 3H-thymidine incorporation (F and G) or CFSE dilution (H). (I and J) In vivo OVA-specific CD4+ T cell priming was analyzed as described in Materials and methods. (I and J) Representative images (I) and data reported as mean ± SD (J) from five pairs of WT and Hrd1−/− recipients are shown (n = 5). Student’s t test was used for statistical analysis. *, P < 0.05; **, P < 0.01; ***, P < 0.0001.
Figure 6.
Figure 6.
Hrd1 interacts with BLIMP1. (A) A Myc-Hrd1 expression plasmid was transfected with or without Flag-BLIMP1 expression plasmid into HEK293 cells. Expression of Hrd1 and BLIMP1 in whole cell lysates was confirmed by immunoblotting (lanes 1 and 2). Hrd1 interaction with BLIMP1 was determined by immunoprecipitation (IP) with anti-Flag antibody followed by immunoblotting with anti-Myc antibody (top, lanes 3 and 4). The same membrane was reprobed with anti-Flag antibody to confirm BLIMP1 expression (bottom). (B) Interaction between endogenous Hrd1 and BLIMP1 in mouse BMDCs was analyzed by IP with anti-BLIMP1 using normal rabbit IgG as a control, followed by immunoblotting with anti-Hrd1 (top). The same membrane was reprobed with anti-BLIMP1 (bottom). (C) BMDCs were stimulated with different doses of LPS as indicated for 2 h. The interaction between BLIMP1 and Hrd1 was determined as in B. (D and E) Truncation mutants of Hrd1 were generated (D) and their interactions with BLIMP1 in transiently transfected HEK293 cells were determined by IP and immunoblotting (E) as described in A. (F and G) Truncation mutants of BLIMP1 were generated (F) and their interactions with full-length Hrd1 in the transiently transfected HEK293 cells were determined by IP and immunoblotting (G) as described in A. TM, transmembrane; Pro, proline; AD, acidic domain; PR, positive regulatory; ZF, zinc finger.
Figure 7.
Figure 7.
Hrd1 is an E3 ubiquitin ligase of BLIMP1. (A) Flag-BLIMP1 and HA-ubiquitin (Ub) plasmids were cotransfected with WT Hrd1 or its CA mutant. BLIMP1 protein in the lysates of transfected cells was immunoprecipitated (IP) with anti-Flag antibody and polyubiquitination ((Ub)n) of BLIMP1 was analyzed by immunoblotting with anti-HA antibody (top). The same membrane was reblotted with anti-BLIMP1 (middle) and again with anti-Hrd1 to confirm expression in cell lysates (bottom). (B) Interaction of BLIMP1 with WT Hrd1 or its CA mutant in transiently transfected HEK293 cells was determined by IP and immunoblotting as described in A. (C) WT and Hrd1−/− BMDCs were treated with or without LPS (200 ng/ml) for 24 h and lysed. BLIMP1 protein in the lysates was immunoprecipitated with anti-BLIMP1, followed by immunoblotting with anti-Ub antibody (top). The same membrane was reprobed with anti-BLIMP1 (middle) and again with anti-Hrd1 to confirm expression in cell lysates (bottom). (D–F) WT and Hrd1−/− BMDCs were stimulated with (mature) or without (immature) LPS (200 ng/ml) for 24 h. (D) Protein expression levels of BLIMP1 (top), Hrd1 (middle), and Tubulin (bottom) in the whole cell lysates were determined by immunoblotting. (E) Relative levels of BLIMP1 protein expression reported as mean ± SD from three independent experiments. Student’s t test was used for statistical analysis. ***, P < 0.005. (F) Total RNA was extracted from immature and mature DCs and the levels of BLIMP1 mRNA were determined by real-time quantitative PCR. Data represent means ± SD. (G) Mature WT and Hrd1−/− BMDCs were treated with cycloheximide (CHX) for the indicated times. Expression levels of BLIMP1 (top), Hrd1 (middle), and Tubulin (bottom) in the whole cell lysates were determined by immunoblotting. Representative results from 3 independent experiments are shown (n = 3).
Figure 8.
Figure 8.
Hrd1 promotes MHC-II expression through degradation of BLIMP1. WT and Hrd1−/− BMDCs were transfected with control or BLIMP1-specific shRNA. (A) 3 d after transfection, protein expression levels of BLIMP1 (top) and Hrd1 (middle) were determined by immunoblotting, using Tubulin as a loading control (bottom). (B and C) MHC-II expression levels were analyzed by flow cytometry. Representative images (B) and mean fluorescence intensities ± SD (C) from 3 independent experiments are shown. (D) CIITA mRNA expression levels were determined by real-time RT-PCR. (E and F) BLIMP1 knockdown and control BMDCs were stimulated with LPS (200 ng/ml) and OVA323-339 peptide overnight, washed, and co-cultured with CD4+ T cells from OT-II mice. Representative images of CD4+ T cell proliferation (E) and mean percentages of dividing CD4+ cells ± SD (F) from three independent experiments are shown. Student’s t test was used for the statistical analysis of the data in (C, D, and F). *, P < 0.05; **, P < 0.01; ***, P < 0.005. (G) WT and Hrd1−/− splenic DCs were stimulated with or without tunicamycin for 2 h and the mRNA expression levels of each indicated UPR genes were analyzed by real-time PRC. (H) The expression levels of MHC-II on the surface of WT and IRE1a−/− splenic DCs (top) and MHC-II mRNA were analyzed. Error bars represent data from five pairs of mice (n = 5).
Figure 9.
Figure 9.
Genetic deletion of Hrd1 gene in DCs partially protects mice from MOG-induced EAE. (A) CD11c-depleted splenocytes from WT C57/B6 mice were adoptively transferred into 8-wk-old RAG1−/− and Hrd1−/−/RAG1−/− double KO mice. 1 d after transfer, recipients were immunized with MOG35-55 peptide (100 µg per mouse, emulsified with CFA). Mice were also given pertussis toxin (200 ng per mouse) on days 0 and 2 via tail vein injection. All mice were weighed and examined for clinical symptoms. Error bars represent data from six pairs of mice (mean ± SD; n = 6). **, P < 0.01. (B–F) Splenocytes from MOG-immunized mice were isolated, stained with CFSE, and co-cultured with MOG peptide for 3 d. (B) Proliferation of CD4+ T cells was analyzed by flow cytometry. (C) Percentages of IFN-γ–producing Th1 and IL-17–producing Th17 cells were analyzed by intracellular staining. (D) IL-2 production in the culture supernatant was examined by ELISA. Data represent means ± SD from 6 pairs of mice. **, P < 0.01. (E and F) CD11c+ conventional DCs in the draining lymph nodes from mice during disease were analyzed for their expression of MHC-II (E) and MHC-I (F) by flow cytometry. The mean fluorescence identity is indicated (mean + SD).

Similar articles

Cited by

References

    1. Adams E.J., and Luoma A.M.. 2013. The adaptable major histocompatibility complex (MHC) fold: structure and function of nonclassical and MHC class I-like molecules. Annu. Rev. Immunol. 31:529–561 10.1146/annurev-immunol-032712-095912 - DOI - PubMed
    1. Amano T., Yamasaki S., Yagishita N., Tsuchimochi K., Shin H., Kawahara K., Aratani S., Fujita H., Zhang L., Ikeda R., et al. . 2003. Synoviolin/Hrd1, an E3 ubiquitin ligase, as a novel pathogenic factor for arthropathy. Genes Dev. 17:2436–2449 10.1101/gad.1096603 - DOI - PMC - PubMed
    1. Burr M.L., Cano F., Svobodova S., Boyle L.H., Boname J.M., and Lehner P.J.. 2011. HRD1 and UBE2J1 target misfolded MHC class I heavy chains for endoplasmic reticulum-associated degradation. Proc. Natl. Acad. Sci. USA. 108:2034–2039 10.1073/pnas.1016229108 - DOI - PMC - PubMed
    1. Carvalho P., Goder V., and Rapoport T.A.. 2006. Distinct ubiquitin-ligase complexes define convergent pathways for the degradation of ER proteins. Cell. 126:361–373 10.1016/j.cell.2006.05.043 - DOI - PubMed
    1. Casals C., Barrachina M., Serra M., Lloberas J., and Celada A.. 2007. Lipopolysaccharide up-regulates MHC class II expression on dendritic cells through an AP-1 enhancer without affecting the levels of CIITA. J. Immunol. 178:6307–6315 10.4049/jimmunol.178.10.6307 - DOI - PubMed

Publication types

MeSH terms

Substances