

Thalamic alterations in preterm neonates and their relation to ventral striatum disturbances revealed by a combined shape and pose analysis
- PMID: 25366970
- PMCID: PMC4417103
- DOI: 10.1007/s00429-014-0921-7
Thalamic alterations in preterm neonates and their relation to ventral striatum disturbances revealed by a combined shape and pose analysis
Abstract
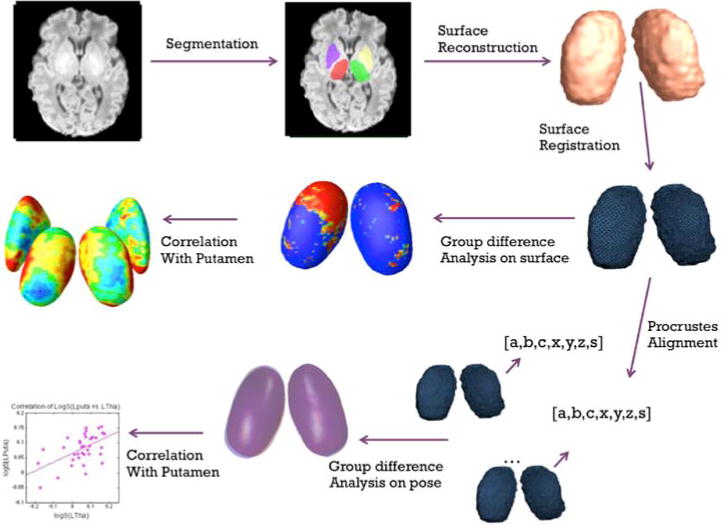
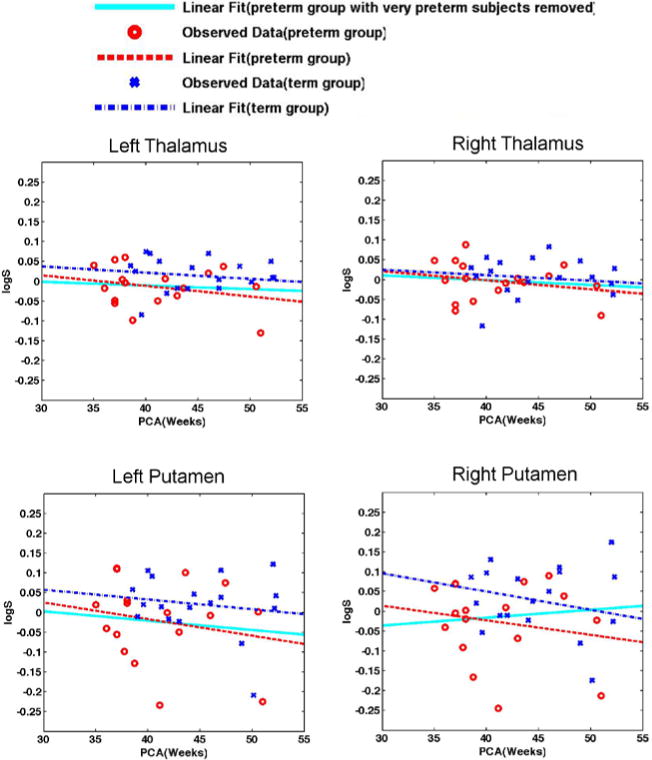
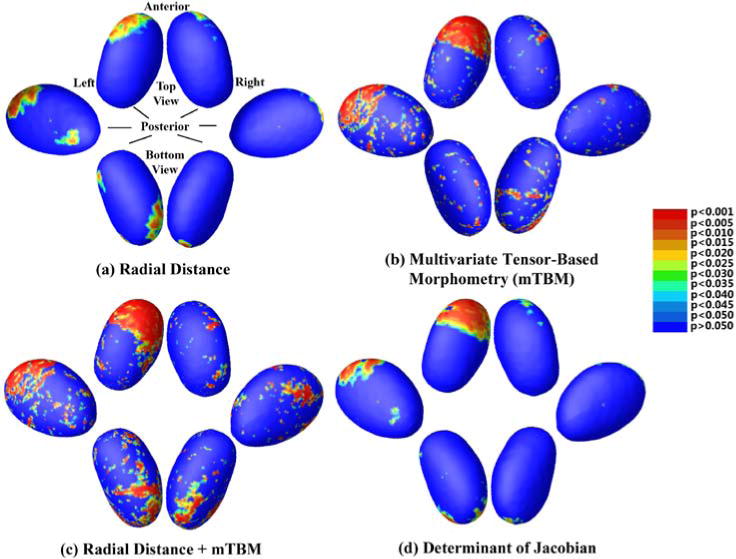
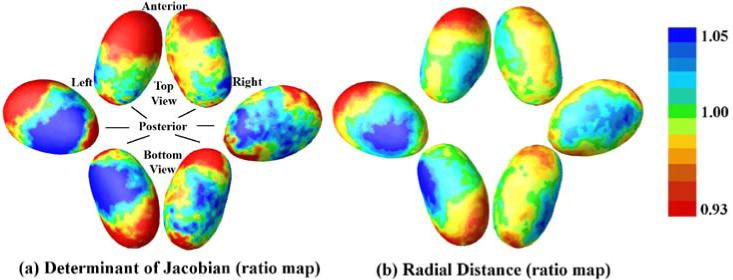
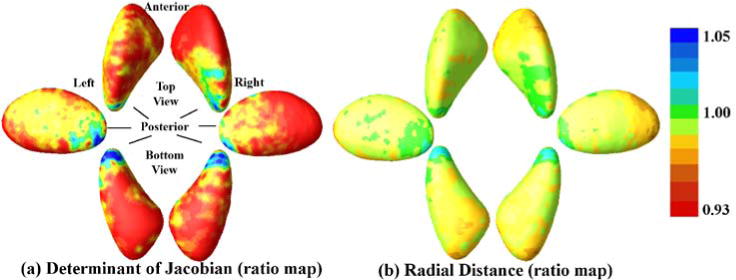
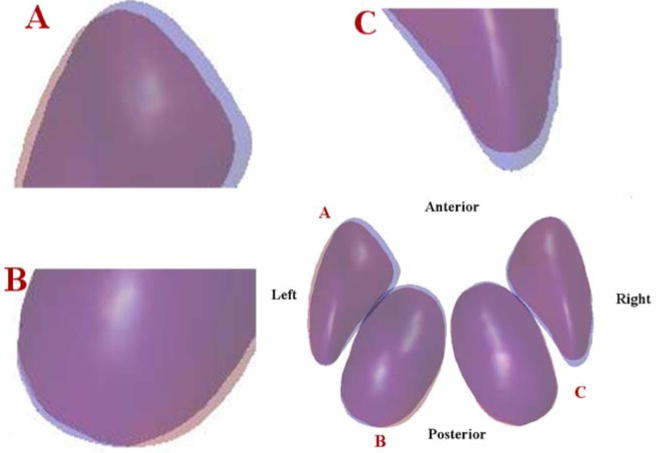
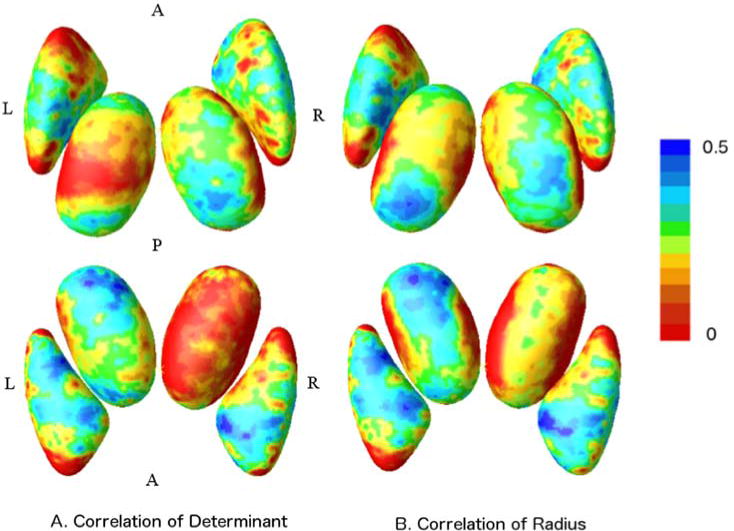
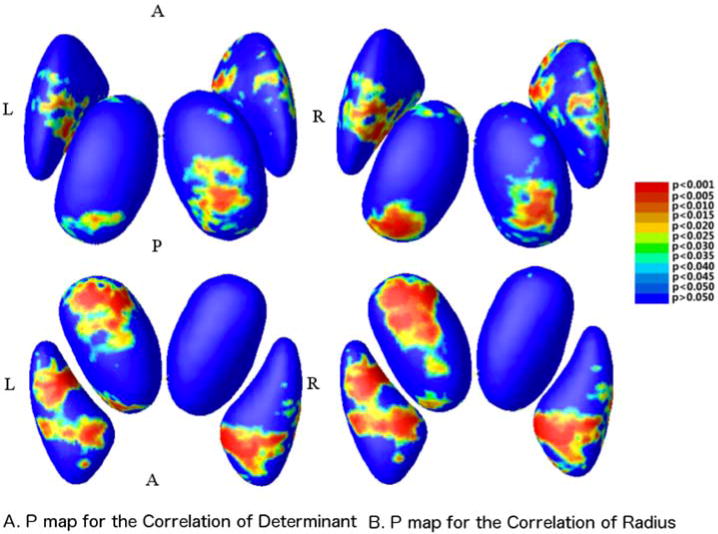
Finding the neuroanatomical correlates of prematurity is vital to understanding which structures are affected, and to designing efficient prevention and treatment strategies. Converging results reveal that thalamic abnormalities are important indicators of prematurity. However, little is known about the localization of the abnormalities within the subnuclei of the thalamus, or on the association of altered thalamic development with other deep gray matter disturbances. Here, we aim to investigate the effect of prematurity on the thalamus and the putamen in the neonatal brain, and further investigate the associated abnormalities between these two structures. Using brain structural magnetic resonance imaging, we perform a novel combined shape and pose analysis of the thalamus and putamen between 17 preterm (41.12 ± 5.08 weeks) and 19 term-born (45.51 ± 5.40 weeks) neonates at term equivalent age. We also perform a set of correlation analyses between the thalamus and the putamen, based on the surface and pose results. We locate significant alterations on specific surface regions such as the anterior and ventral anterior (VA) thalamic nuclei, and significant relative pose changes of the left thalamus and the right putamen. In addition, we detect significant association between the thalamus and the putamen for both surface and pose parameters. The regions that are significantly associated include the VA, and the anterior and inferior putamen. We detect statistically significant surface deformations and pose changes on the thalamus and putamen, and for the first time, demonstrate the feasibility of using relative pose parameters as indicators for prematurity in neonates. Our methods show that regional abnormalities of the thalamus are associated with alterations of the putamen, possibly due to disturbed development of shared pre-frontal connectivity. More specifically, the significantly correlated regions in these two structures point to frontal-subcortical pathways including the dorsolateral prefrontal-subcortical circuit, the lateral orbitofrontal-subcortical circuit, the motor circuit, and the oculomotor circuit. These findings reveal new insight into potential subcortical structural covariates for poor neurodevelopmental outcomes in the preterm population.
Keywords: Frontal-subcortical circuits; Pose; Prematurity; Subcortical structures; Tensor-based morphometry.
Figures
References
-
- Abernethy LJ, Cooke RW, Foulder-Hughes L. Caudate and hippocampal volumes, intelligence, and motor impairment in 7-year-old children who were born preterm. Pediatric research. 2004;55:884–893. - PubMed
-
- Aggleton JP, Brown MW. Episodic memory, amnesia, and the hippocampal-anterior thalamic axis. Behavioral and Brain Sciences. 1999;22:425–444. - PubMed
-
- Alexander GE, Crutcher MD, DeLong MR. Basal ganglia-thalamocortical circuits: parallel substrates for motor, oculomotor, “prefrontal” and “limbic” functions. Progress in brain research. 1991;85:119–146. - PubMed
-
- Allin M, Henderson M, Suckling J, Nosarti C, Rushe T, Fearon P, Stewart AL, Bullmore E, Rifkin L, Murray R. Effects of very low birthweight on brain structure in adulthood. Developmental Medicine & Child Neurology. 2004;46:46–53. - PubMed
Publication types
MeSH terms
Grants and funding
LinkOut - more resources
Full Text Sources
Other Literature Sources
Medical
