. 2015 Jan;138(Pt 1):136-48.
doi: 10.1093/brain/awu306. Epub 2014 Nov 2.

Post-stroke fatigue: a deficit in corticomotor excitability?

Affiliations

Post-stroke fatigue: a deficit in corticomotor excitability?

Annapoorna Kuppuswamy et al. Brain. 2015 Jan.

Abstract

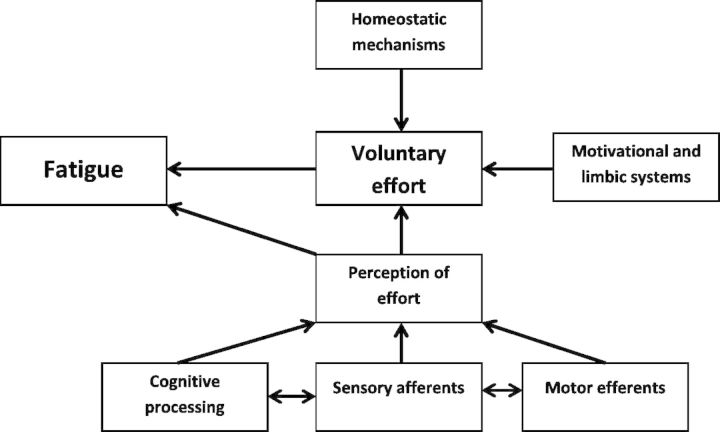
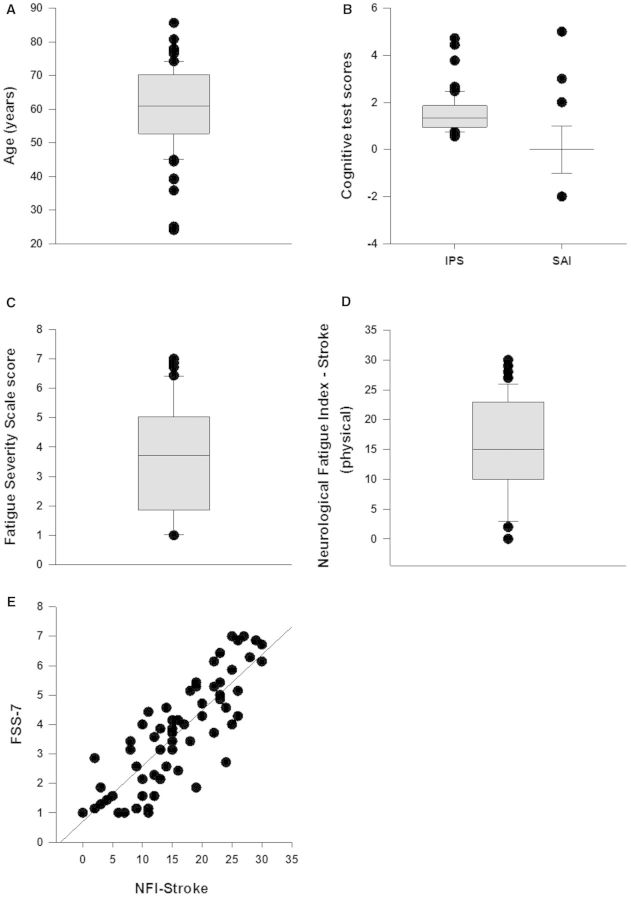
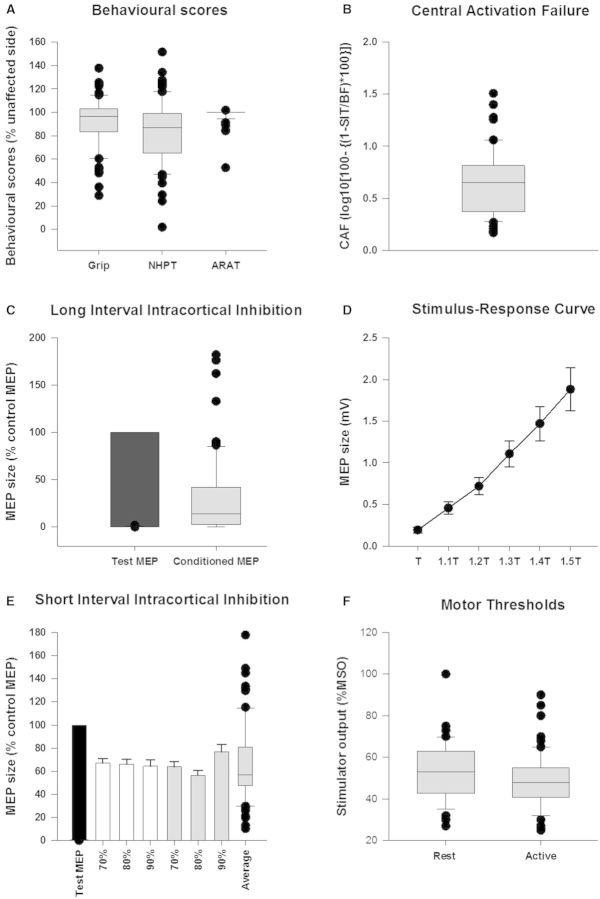
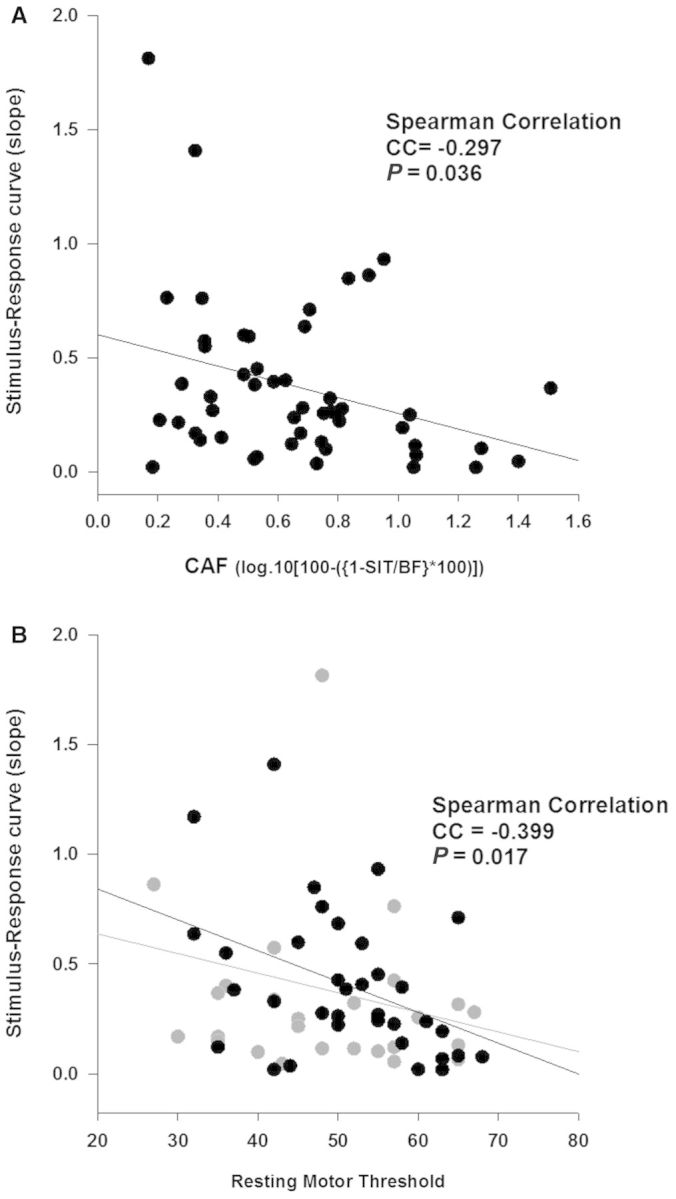
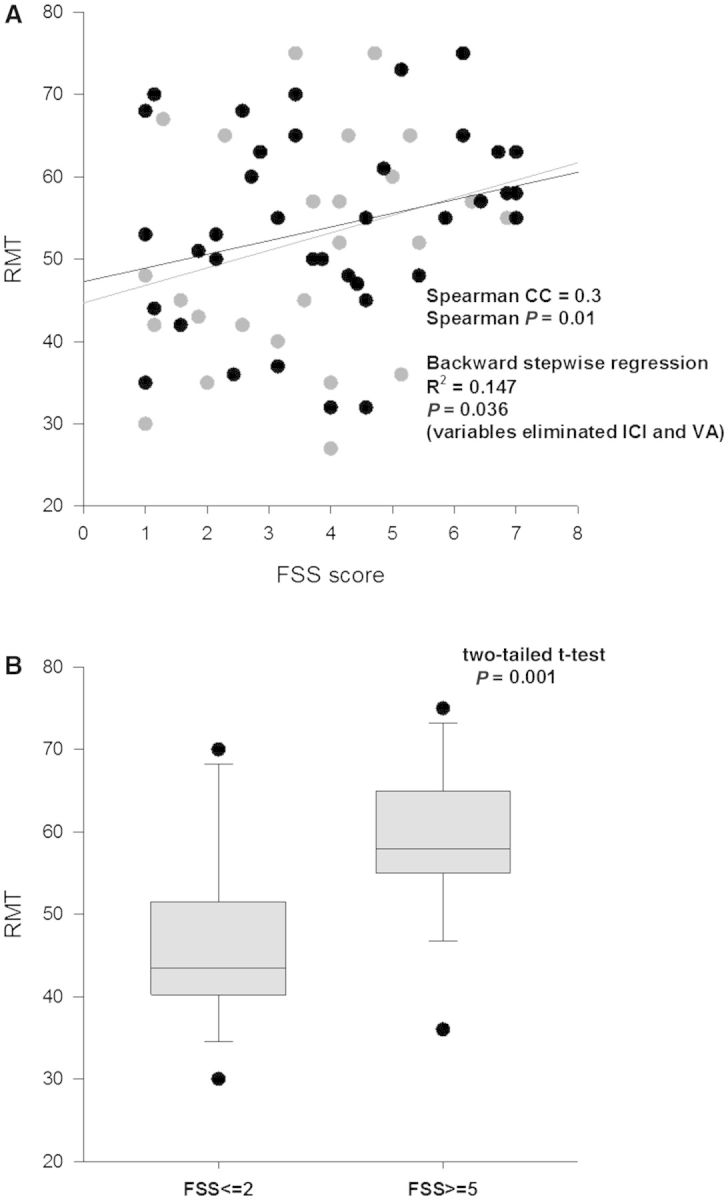
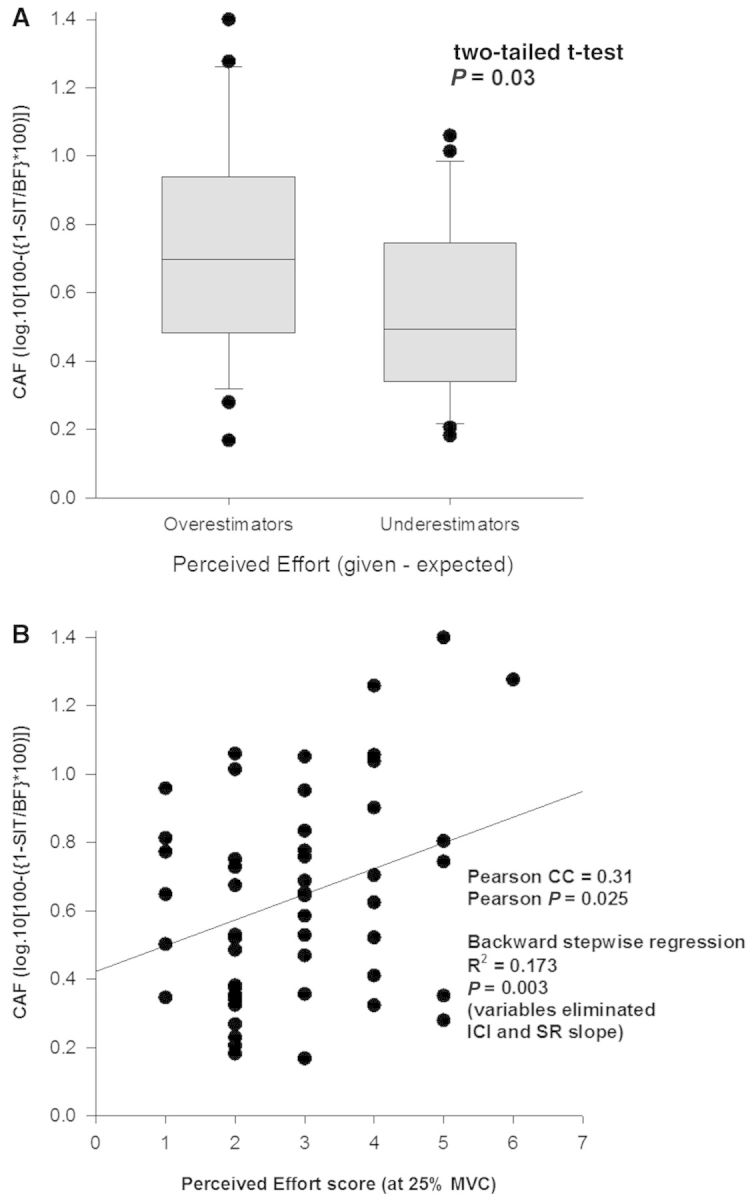
The pathophysiology of post-stroke fatigue is poorly understood although it is thought to be a consequence of central nervous system pathophysiology. In this study we investigate the relationship between corticomotor excitability and self-reported non-exercise related fatigue in chronic stroke population. Seventy first-time non-depressed stroke survivors (60.36 ± 12.4 years, 20 females, 56.81 ± 63 months post-stroke) with minimal motor and cognitive impairment were included in the cross-sectional observational study. Fatigue was measured using two validated questionnaires: Fatigue Severity Scale 7 and Neurological Fatigue Index - Stroke. Perception of effort was measured using a 0-10 numerical rating scale in an isometric biceps hold-task and was used as a secondary measure of fatigue. Neurophysiological measures of corticomotor excitability were performed using transcranial magnetic stimulation. Corticospinal excitability was quantified using resting and active motor thresholds and stimulus-response curves of the first dorsal interosseous muscle. Intracortical M1 excitability was measured using paired pulse paradigms: short and long interval intracortical inhibition in the same hand muscle as above. Excitability of cortical and subcortical inputs that drive M1 output was measured in the biceps muscle using a modified twitch interpolation technique to provide an index of central activation failure. Stepwise regression was performed to determine the explanatory variables that significantly accounted for variance in the fatigue and perception scores. Resting motor threshold (R = 0.384; 95% confidence interval = 0.071; P = 0.036) accounted for 14.7% (R(2)) of the variation in Fatigue Severity Scale 7. Central activation failure (R = 0.416; 95% confidence interval = -1.618; P = 0.003) accounted for 17.3% (R(2)) of the variation in perceived effort score. Thus chronic stroke survivors with high fatigue exhibit high motor thresholds and those who perceive high effort have low excitability of inputs that drive motor cortex output. We suggest that low excitability of both corticospinal output and its facilitatory synaptic inputs from cortical and sub-cortical sites contribute to high levels of fatigue after stroke.

Keywords: behavioural neurology; motor cortex; motor evoked potentials; stroke rehabilitation; transcranial magnetic stimulation.


Figures

Figure 1
Figure 1
Adapted from Chaudhuri and Behan (2004).
Figure 2
Figure 2
Patient demographics. (A) Stroke survivors of wide-ranging ages participated in the study. (B) All participants had good cognitive ability as shown by a relatively high information processing speed (IPS), an average of 1 s per symbol in the Symbol Digit Modalities Test (Coding – Copy) and Sustained Attention Index (SAI). Zero indicates very high attention score and positive scores show progressively poorer attention. Self-reported fatigue was quantified using two questionnaires, FSS (C) and Neurological Fatigue Index – Stroke specific scale (NFI-Stroke, D). The fatigue levels in the current study population included those with both high and low levels of fatigue. (E) FSS and NFI-stroke were significantly correlated.
Figure 3
Figure 3
Behavioural scores. (A) The behavioural scores of the affected upper limb as a percentage of the unaffected side, motor thresholds (F) and CAF (B) in 70 subjects. (C) The black bar represents the test response as a percentage of itself and the box plot is the mean conditioned motor evoked potential (MEP) response sizes in the long interval ICI protocol. In (D) average raw motor evoked potential sizes at various percentages of threshold (x-axis values, T to 1.5 T) are represented by the filled circles. The error bars represent standard errors. In (E), the black bar represents the test response as a percentage of itself, the white bars show responses where interstimulus interval was 2 ms, grey where interstimulus interval was 3 ms and the intensities on the x-axis are the intensities of conditioning pulses. The error bars represent standard error. The box plot in (E) shows the average short interval ICI across all six conditions. In C and E all conditioned responses were significantly smaller than test response (black bar), P < 0.05. The box plots (all grey boxes with horizontal line inside them) show the distribution of the data points with the horizontal line representing the median of the data and the black dots representing the outliers. NHPT = Nine Hole Peg Test; ARAT = Action Research Arm Test; SIT = superimposed twitch; BF = background force; MSO = maximal stimulator output.
Figure 4
Figure 4
M1 excitability and central activation failure. Intracortical M1 excitability as measured by stimulus-response curve was correlated with corticospinal excitability (B, RMT, n = 70) and excitability of inputs to M1 as measured by CAF (A, n = 55). The grey circles in B represent thresholds of those participants (n = 30) who were unable to completely relax their muscle during measurement and thereby might have been an underestimation of RMT. Two data points in (A) and three data points in (B), have been excluded from graphical representation but have been included in statistical analysis. SIT = superimposed twitch; BF = background force.
Figure 5
Figure 5
Corticospinal tract excitability and FSS score. RMT was correlated with FSS. In (A) the grey circles represent resting threshold of all participants (n = 70). In 40 of 70 participants, a true resting state was achieved during threshold measurement (black circles), the remaining 30 patients were unable to relax completely and there may have been a slight underestimation of resting threshold. In (B) the difference between resting thresholds in those with no fatigue (FSS score <2, n = 18) and those with extreme fatigue (FSS score >5, n = 18) is shown.
Figure 6
Figure 6
Perceived effort and CAF. Participants self-reported effort score while performing a 25% MVC, on a scale of 0–10 correlated with the level of ‘extra-M1’ excitability as measured by CAF (B). A significant difference in CAF (s) was seen in those who overestimated the effort required to produce a 25% MVC (≥3) and those who underestimated the required effort (≤2). Fifty-five of 70 participants were able to tolerate the CAF testing. SIT = superimposed twitch; BF = background force.
Figure 7
Figure 7
Example traces from the Central Activation Failure test. Single motor evoked potential (top) and twitch (bottom) responses from an individual subject show a decrease in the size of twitch with increasing voluntary force while the motor evoked potential sizes remain the same.

Similar articles

Cited by

References

    1. Altwegg-Boussac T, Chavez M, Mahon S, Charpier S. Excitability and responsiveness of rat barrel cortex neurons in the presence and absence of spontaneous synaptic activity in vivo. J Physiol. 2014;592:3577–95. - PMC - PubMed
    1. Andersen G, Christensen D, Kirkevold M, Johnsen SP. Post-stroke fatigue and return to work: a 2-year follow-up. Acta Neurol Scand. 2012;125:248–53. - PubMed
    1. Annoni J-M, Staub F, Bogousslavsky J, Brioschi A. Frequency, characterisation and therapies of fatigue after stroke. Neurol Sci. 2008;29(Suppl 2):S244–6. - PubMed
    1. Barbour VL, Mead GE. Fatigue after stroke: the patient’s perspective. Stroke Res Treat. 2012;2012:863031. - PMC - PubMed
    1. Boroojerdi B, Battaglia F, Muellbacher W, Cohen LG. Mechanisms influencing stimulus-response properties of the human corticospinal system. Clin Neurophysiol. 2001;112:931–7. - PubMed

Publication types

MeSH terms