. 2014 Dec;137(Pt 12):3267-83.
doi: 10.1093/brain/awu297. Epub 2014 Nov 2.

Large-scale changes in network interactions as a physiological signature of spatial neglect

Affiliations

Large-scale changes in network interactions as a physiological signature of spatial neglect

Antonello Baldassarre et al. Brain. 2014 Dec.

Abstract

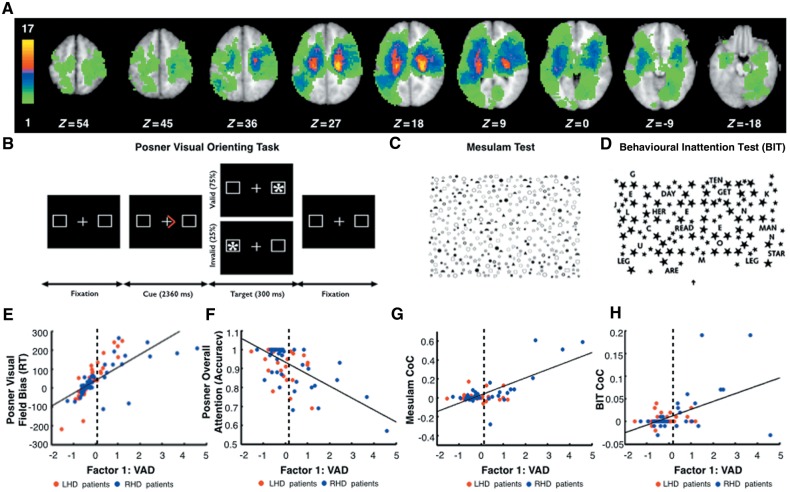
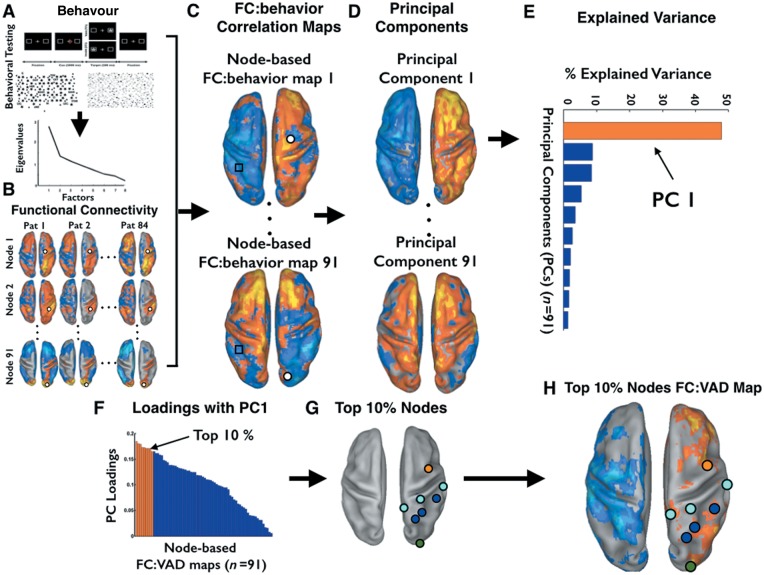
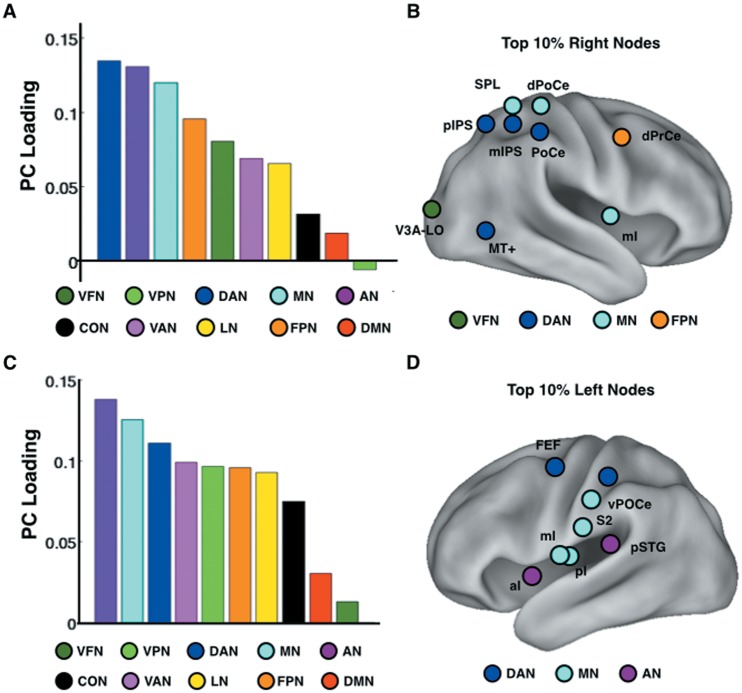
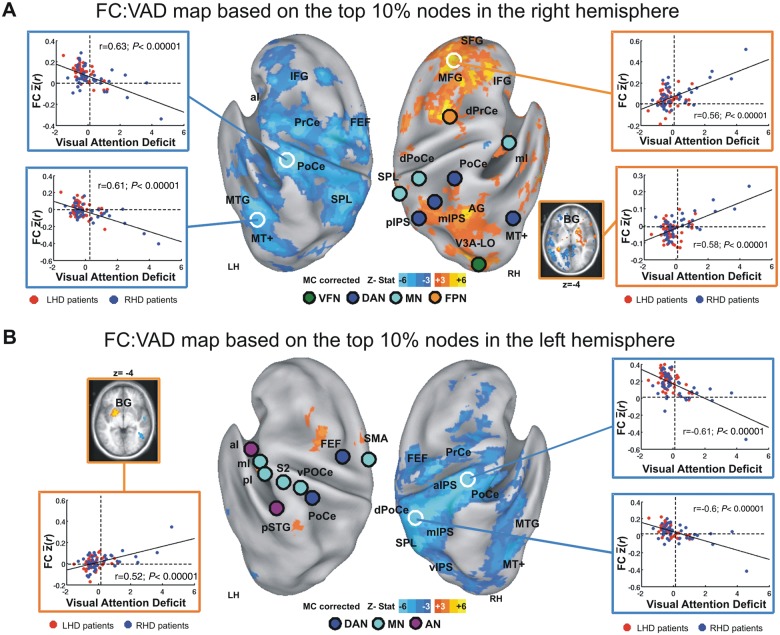
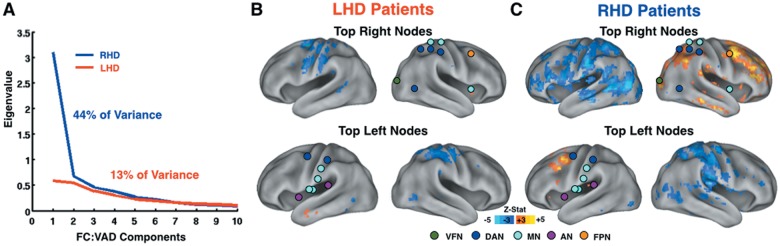
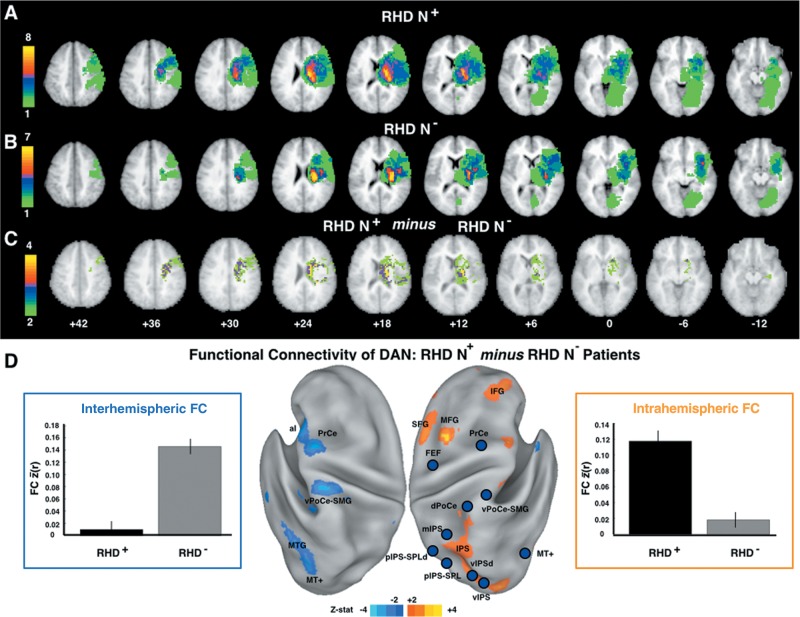
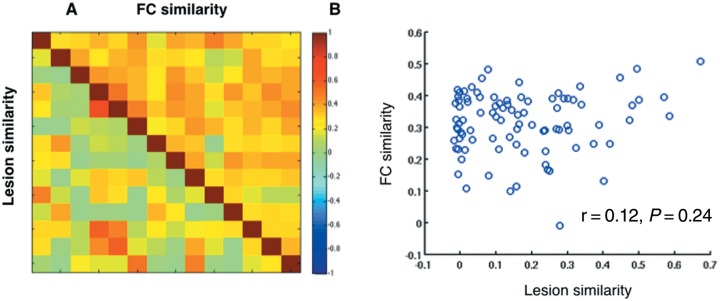
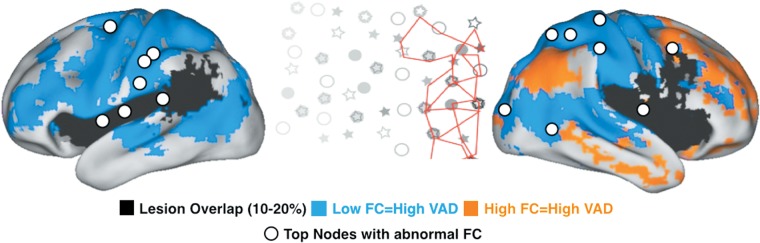
The relationship between spontaneous brain activity and behaviour following focal injury is not well understood. Here, we report a large-scale study of resting state functional connectivity MRI and spatial neglect following stroke in a large (n=84) heterogeneous sample of first-ever stroke patients (within 1-2 weeks). Spatial neglect, which is typically more severe after right than left hemisphere injury, includes deficits of spatial attention and motor actions contralateral to the lesion, and low general attention due to impaired vigilance/arousal. Patients underwent structural and resting state functional MRI scans, and spatial neglect was measured using the Posner spatial cueing task, and Mesulam and Behavioural Inattention Test cancellation tests. A principal component analysis of the behavioural tests revealed a main factor accounting for 34% of variance that captured three correlated behavioural deficits: visual neglect of the contralesional visual field, visuomotor neglect of the contralesional field, and low overall performance. In an independent sample (21 healthy subjects), we defined 10 resting state networks consisting of 169 brain regions: visual-fovea and visual-periphery, sensory-motor, auditory, dorsal attention, ventral attention, language, fronto-parietal control, cingulo-opercular control, and default mode. We correlated the neglect factor score with the strength of resting state functional connectivity within and across the 10 resting state networks. All damaged brain voxels were removed from the functional connectivity:behaviour correlational analysis. We found that the correlated behavioural deficits summarized by the factor score were associated with correlated multi-network patterns of abnormal functional connectivity involving large swaths of cortex. Specifically, dorsal attention and sensory-motor networks showed: (i) reduced interhemispheric functional connectivity; (ii) reduced anti-correlation with fronto-parietal and default mode networks in the right hemisphere; and (iii) increased intrahemispheric connectivity with the basal ganglia. These patterns of functional connectivity:behaviour correlations were stronger in patients with right- as compared to left-hemisphere damage and were independent of lesion volume. Our findings identify large-scale changes in resting state network interactions that are a physiological signature of spatial neglect and may relate to its right hemisphere lateralization.

Keywords: functional MRI; functional connectivity; resting-state; stroke.


Figures

Figure 1
Figure 1
Lesion topography and performance in tests of spatial attention. (A) Lesion density in the sample of patients contributing to the functional connectivity:VAD analyses (n = 84). Colour bar indicates the number of patients with a lesion in a given voxel. (B) Posner Visual Orienting Task. (C) Mesulam Test. (D) Behavioural Inattention Test (BIT) (see ‘Materials and Methods’ section). Scatter plots show the relation between Visual Attention Deficit (VAD) and several performance measures: Posner visual field bias reaction time (RT) (E); Posner overall attention (accuracy) (F); Mesulam centre of cancellation (CoC) (G) and Behavioural Inattention Test centre of cancellation (H). Blue and red dots indicate right (RHD) and left (LHD) hemisphere damaged patients, respectively. Vertical dashed lines indicate the mean plus two standard deviations of VAD scores in age-matched controls. Patients on the right of the dashed line were classified as exhibiting neglect (N+); those on the left of the dashed line were classified as not exhibiting neglect (N).
Figure 2
Figure 2
Analysis flowchart of steps involved in the computation of functional connectivity:behaviour correlation maps. The figure displays the pipeline of the functional connectivity and behaviour correlational analysis. Except panel B, all other panels display maps and bar graphs derived from real data. (A) Behavioural test: Posner Cueing Task, Mesulam and Behavioural Inattention Test, Behavioural Inattention Test (top). See ‘Behavioural Testing’ section in the main text for detailed information. On the bottom, scree plot of the PCA on the behavioural tests. (B) Voxel-wise functional connectivity. Dorsal view of voxel-wise functional connectivity maps projected on the Population-Average, Landmark- and Surface-based atlas (PALS) (Van Essen, 2005). Each row indicates a node, while columns indicate individual patients. Orange-yellow colours indicate voxels with positive functional connectivity with the node; blue-cyan colours indicate negative functional connectivity, see ‘Resting state functional connectivity mapping’ section for details. (C) Functional connectivity (FC):behaviour correlation. Dorsal view of voxel-wise functional connectivity:behaviour maps, projected on the PALS. Blue-cyan colours indicate voxels showing negative correlation between the performance measure (VAD) and the functional connectivity of that voxel (see black square) with the node. Orange-yellow colours indicate positive correlation. (D) PCA of functional connectivity: behaviour maps. Dorsal view of voxel-wise principal component (PC) maps. The PC maps are sorted by the amount of explained variance (from the highest PC #1 to the lowest, PC #91). (E) Explained variance across functional connectivity:behaviour maps. Bar graph displays the amount of explained variance by each principal component derived from the PCA on the 91 functional connectivity:behaviour maps. The first bar (in orange) refers to the PC1 accounting for the largest amount of variance across the nodes. (F) Loadings of the functional connectivity:behaviour maps for each node on the first principal component. The maps are sorted by the absolute value of the loadings. Bars in orange refer to the top 10% node-based functional connectivity:behaviour maps for the PC1. (G) The top 10% nodes with the highest loading on the first principal component. (H) The functional connectivity:behaviour map computed from the top 10% nodes. This map represents the most consistent functional connectivity:behaviour associations. Blue-cyan colours indicate negative functional connectivity:behaviour correlation (low functional connectivity = high deficit), whereas orange-yellow colours indicate positive correlation (high functional connectivity = high deficit).
Figure 3
Figure 3
Spatial PCA of functional connectivity:VAD maps computed separately for nodes in each hemisphere. (A) Results from a PCA conducted on the functional connectivity:VAD maps for right hemisphere nodes. Each bar in the graph shows the loading of the first principal component (PC) on a particular resting state network. (B) The figure displays the 10% of right hemisphere nodes whose functional connectivity:VAD maps showed the highest loading with the first principal component. (C) Same as (A) but for left hemisphere nodes. (D) Same as (B) but for left hemisphere nodes. Networks: VFN = visual foveal representation; VPN = visual peripheral representation; DAN = dorsal attention; MN = motor; AN = auditory; VAN = ventral attention; CON = cingulo-opercular; LN = language; FPN = frontoparietal; DMN = default mode. FEF = frontal eye field; aI = anterior Insula; mI = middle Insula; pSTG = posterior superior temporal gyrus; vPoCe = ventral post-central gyrus; mIPS = middle intraparietal sulcus; SPL = superior parietal lobule; pIPS = posterior intraparietal sulcus; dPrCe = dorsal precentral gyrus; PoCe = post-central gyrus; MT+ = middle temporal area; V3A-LO = visual area 3A-lateral occipital complex.
Figure 4
Figure 4
Behaviourally-relevant functional connectivity. Voxel-wise functional connectivity (FC):VAD maps based on the top 10% of nodes showing the highest loading with the first principal component from the PCA of functional connectivity:VAD maps. (A) Functional connectivity:VAD map derived from the top 10% right hemisphere nodes (n = 9) (illustrated in Fig. 3B). Nodes are displayed as circles whose colour indicates network identity, consistent with Fig. 2. Functional connectivity:VAD correlation maps are thresholded at P < 0.05 (multiple comparisons corrected, cluster size 17 voxels). Blue-cyan hues indicate negative functional connectivity:VAD correlation (low functional connectivity = high VAD); orange-yellow hues indicate positive functional connectivity:VAD correlation (high functional connectivity = high VAD). Inset scatter plots show the relation between VAD and mean functional connectivity between the nine nodes and the region demarcated by white circles. As in Fig. 1, vertical dashed lines indicate the boundary between patients with (N+) and without (N) patients. Blue circles = RHD patients; red circles = LHD patients. Inset in lower right portion of A shows functional connectivity:VAD correlations for regions in right and left putamen (BG). Region labels correspond to Supplementary Table 1. (B) Functional connectivity:VAD map derived from the top 10% left hemisphere nodes (n = 9) (illustrated in Fig. 3D), conventions as in A. VFN = visual foveal network; DAN = dorsal attention network; MN = motor network; VAN = ventral attention network; FPN = fronto-parietal network; FEF = frontal eye field; SMA = supplemental motor area; aI = anterior insula; pI = posterior insula; mI = middle insula; pSTG = posterior superior temporal gyrus; vPoCe = ventral post-central gyrus; mIPS = middle intraparietal sulcus; SPL = superior parietal lobule; pIPS = posterior intraparietal sulcus; dPrCe = dorsal precentral gyrus; PoCe = post-central gyrus; MT+ = middle temporal area; V3A-LO = visual area 3A-lateral occipital complex.
Figure 5
Figure 5
Behaviourally-relevant functional connectivity in right (RHD) and left (LHD) hemisphere damaged patients. (A) Scree plot derived from the spatial principal component analysis of 169 functional connectivity (FC):VAD correlational maps in right (RHD) and left (LHD) hemisphere damaged patients (n = 42 in both groups). Functional connectivity:VAD associations were considerably stronger in right as opposed to left hemisphere damaged patients Blue: RHD; Red: LHD. (B) Voxel-wise functional connectivity:VAD map from top 10% right nodes (n = 9) (top) and from top 10% left nodes (n = 9) (bottom) in the LHD group (n = 42). (C) Same map as in B generated in the RHD group (n = 42). The top 10% nodes were derived from the whole-sample analysis (Fig. 3B and D). (B and C) The nodes and colour scale as in Fig. 4. VFN = visual foveal network; DAN = dorsal attention network; MN = motor network; FPN = fronto-parietal network; AN = auditory network.
Figure 6
Figure 6
Functional connectivity in RHD patients with (N+) and without (N) neglect and patients matched for lesion topography. (A) Lesion density in with neglect group (n = 11). (B) Lesion density in without neglect group (n = 11). (C) Difference in lesion density of the with neglect group minus the without neglect group. (D) With versus without neglect group contrast in functional connectivity (FC) averaged over 12 dorsal attention network (DAN) nodes in the right hemisphere. Surface maps show uncorrected Z-scores (|Z| > 2, P < 0.05). Blue-cyan (orange-yellow) hues indicate lower (higher) functional connectivity in the with neglect group. Left bar graph (outlined in blue) indicates the mean functional connectivity between 12 nodes in the right dorsal attention network (blue circles) and the cyan-blue voxels in the left hemisphere. Right bar graph (outlined in orange) indicates the mean functional connectivity between 12 nodes in the right dorsal attention network (blue circles) and the yellow-orange voxels in the right hemisphere. Region labels correspond to Supplementary Table 1. vIPSd = ventral intraparietal sulcus dorsal portion; MT+ = middle temporal area; MTG = middle temporal gyrus; pIPS-SPL = posterior Intraparietal Sulcus-Superior Parietal Lobule; pIPS-SPLd = posterior Intraparietal Sulcus-Superior Parietal Lobule dorsal portion; mIPS = middle intraparietal sulcus; dPoCe = dorsal post-central gyrus; vPoCe-SMG = ventral post-central gyrus-supramarginal gyrus; PrCe = precentral gyrus; FEF = frontal eye field; MFG = middle frontal gyrus; SFG = superior frontal gyrus; IFG = inferior frontal gyrus; aI = anterior insula.
Figure 7
Figure 7
Behaviourally-relevant functional connectivity is not associated to lesion topography. (A) Lesion similarity and functional connectivity similarity. In the lower half of the matrix, each cell indicates the spatial correlation of the anatomical lesion between each pair of RHD N+ patients with neglect (N+) (n = 14). In the upper half of the matrix, each cell indicates the spatial correlation of the voxel-wise functional connectivity map derived from the right top 10% nodes between each pair of RHD patients with neglect (n = 14). (B) Functional connectivity similarity is not correlated with lesion similarity. The functional connectivity similarity between two patients is defined by the spatial correlation of the voxel-wise functional connectivity maps obtained for each patient by averaging the maps for the 10% of right hemisphere nodes. Each circle in the scatterplot indicates the functional connectivity and lesion similarity values for a pair of RHD patients with neglect (r = 0.12; P = 0.24; n = 91).
Figure 8
Figure 8
Behaviourally-relevant functional connectivity and lesion topography. The map displays a summary of main finding. White circles indicate the top 10% nodes of the left and right hemisphere showing behaviourally-relevant functional connectivity (FC). Blue and orange colours indicate voxels showing negative and positive functional connectivity:VAD correlations with the top nodes, respectively. Black colour indicates voxels damaged in the 10–20% of patients. The central inset illustrates rightward spatial biases in attention typical of neglect patients (from Corbetta and Shulman, 2011).

Similar articles

Cited by

References

    1. Baldassarre A, Lewis CM, Committeri G, Snyder AZ, Romani GL, Corbetta M. Individual variability in functional connectivity predicts performance of a perceptual task. Proc Natl Acad Sci USA. 2012;109:3516–21. - PMC - PubMed
    1. Bartolomeo P, Thiebaut de Schotten M, Chica AB. Brain networks of visuospatial attention and their disruption in visual neglect. Front Hum Neurosci. 2012;6:110. - PMC - PubMed
    1. Bellgrove MA, Dockree PM, Aimola L, Robertson IH. Attenuation of spatial attentional asymmetries with poor sustained attention. Neuroreport. 2004;15:1065–9. - PubMed
    1. Bisiach E, Geminiani G, Berti A, Rusconi ML. Perceptual and premotor factors of unilateral neglect. Neurology. 1990;40:1278–81. - PubMed
    1. Bisley JW, Goldberg ME. Neuronal activity in the lateral intraparietal area and spatial attention. Science. 2003;299:81–6. - PubMed

Publication types