

Vitamin D Status Affects Serum Metabolomic Profiles in Pregnant Adolescents
- PMID: 25367051
- PMCID: PMC4502797
- DOI: 10.1177/1933719114556477
Vitamin D Status Affects Serum Metabolomic Profiles in Pregnant Adolescents
Abstract
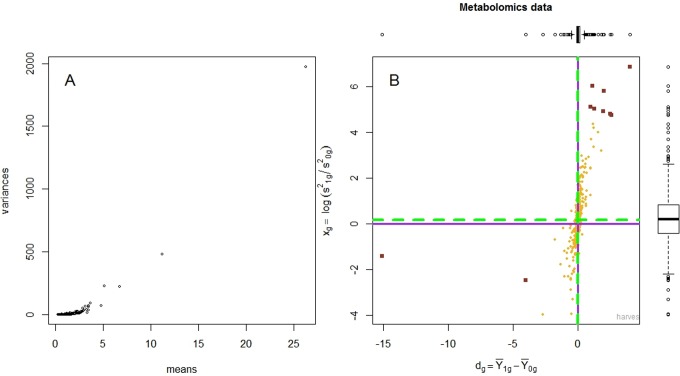
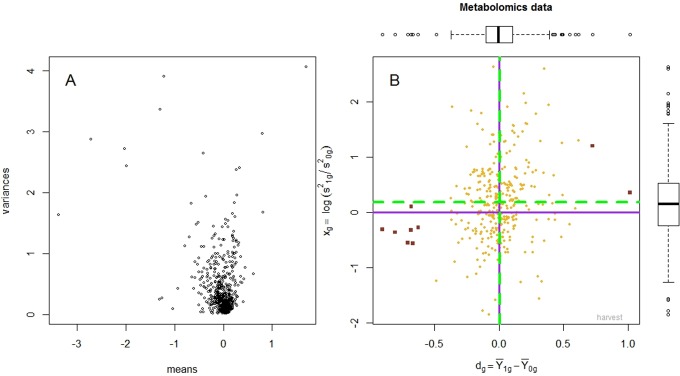
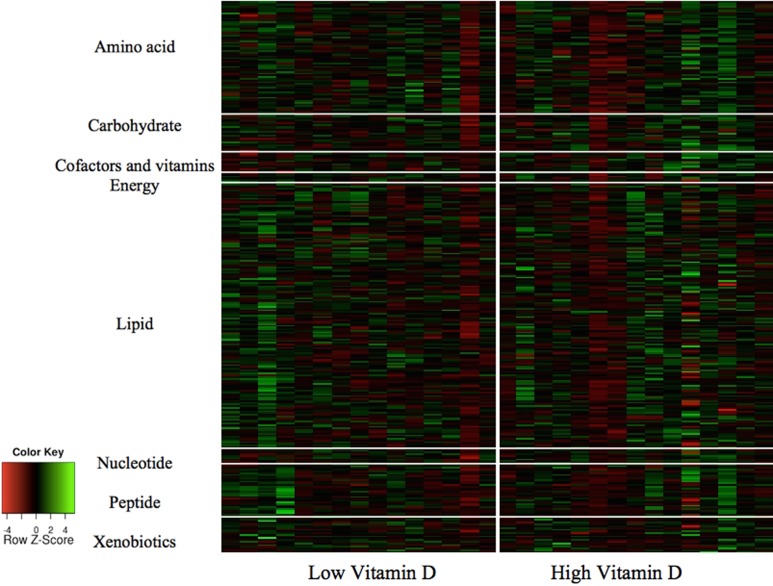
Vitamin D is linked to a number of adverse pregnancy outcomes through largely unknown mechanisms. This study was conducted to examine the role of vitamin D status in metabolomic profiles in a group of 30 pregnant, African American adolescents (17.1 ± 1.1 years) at midgestation (26.8 ± 2.8 weeks), in 15 adolescents with 25-hydroxy vitamin D (25(OH)D) ≥20 ng/mL, and in 15 teens with 25(OH)D <20 ng/mL. Serum metabolomic profiles were examined using gas chromatography-mass spectrometry and liquid chromatography-tandem mass spectrometry. A novel hierarchical mixture model was used to evaluate differences in metabolite profiles between low and high groups. A total of 326 compounds were identified and included in subsequent statistical analyses. Eleven metabolites had significantly different means between the 2 vitamin D groups, after correcting for multiple hypothesis testing: pyridoxate, bilirubin, xylose, and cholate were higher, and leukotrienes, 1,2-propanediol, azelate, undecanedioate, sebacate, inflammation associated complement component 3 peptide (HWESASXX), and piperine were lower in serum from adolescents with 25(OH)D ≥20 ng/mL. Lower maternal vitamin D status at midgestation impacted serum metabolic profiles in pregnant adolescents.
Keywords: adolescent; biomarker; metabolomics; pregnancy; vitamin D.
© The Author(s) 2014.
Conflict of interest statement
Figures
Similar articles
-
Vitamin D deficiency in adolescent pregnancy and obstetric outcomes.Taiwan J Obstet Gynecol. 2019 Nov;58(6):778-783. doi: 10.1016/j.tjog.2019.09.008. Taiwan J Obstet Gynecol. 2019. PMID: 31759526
-
Relationship between 25(OH)D levels and circulating lipids in African American adolescents.J Pediatr Endocrinol Metab. 2016 Oct 1;29(10):1165-1172. doi: 10.1515/jpem-2016-0090. J Pediatr Endocrinol Metab. 2016. PMID: 27658132
-
Treatment of Vitamin D Deficiency in Predominantly Hispanic and Black Adolescents: A Randomized Clinical Trial.J Pediatr. 2016 Mar;170:266-72.e1. doi: 10.1016/j.jpeds.2015.11.025. Epub 2015 Dec 18. J Pediatr. 2016. PMID: 26707619 Free PMC article. Clinical Trial.
-
Early pregnancy maternal vitamin D concentrations and risk of gestational diabetes mellitus.Paediatr Perinat Epidemiol. 2015 May;29(3):200-10. doi: 10.1111/ppe.12182. Epub 2015 Mar 23. Paediatr Perinat Epidemiol. 2015. PMID: 25808081 Free PMC article. Review.
-
Prevalence and predictors of vitamin D deficiency based on maternal mid-gestation and neonatal cord bloods: The Generation R Study.J Steroid Biochem Mol Biol. 2016 Nov;164:161-167. doi: 10.1016/j.jsbmb.2015.09.018. Epub 2015 Sep 15. J Steroid Biochem Mol Biol. 2016. PMID: 26385604 Review.
Cited by
-
Influence of Vitamin D Status and Supplementation on Metabolomic Profiles of Older Adults.Metabolites. 2023 Jan 23;13(2):166. doi: 10.3390/metabo13020166. Metabolites. 2023. PMID: 36837785 Free PMC article.
-
Urinary metabolic profiles after vitamin D2 versus vitamin D3 supplementation in prediabetes.J Clin Transl Endocrinol. 2019 May 8;16:100194. doi: 10.1016/j.jcte.2019.100194. eCollection 2019 Jun. J Clin Transl Endocrinol. 2019. PMID: 31193444 Free PMC article.
-
Metabolomics-based profiles predictive of low bone mass in menopausal women.Bone Rep. 2018 Jun 18;9:11-18. doi: 10.1016/j.bonr.2018.06.004. eCollection 2018 Dec. Bone Rep. 2018. PMID: 29955645 Free PMC article.
-
Plasma 25-Hydroxyvitamin D Concentrations are Associated with Polyunsaturated Fatty Acid Metabolites in Young Children: Results from the Vitamin D Antenatal Asthma Reduction Trial.Metabolites. 2020 Apr 14;10(4):151. doi: 10.3390/metabo10040151. Metabolites. 2020. PMID: 32295265 Free PMC article.
-
Plasma metabolomics in adults with cystic fibrosis during a pulmonary exacerbation: A pilot randomized study of high-dose vitamin D3 administration.Metabolism. 2017 May;70:31-41. doi: 10.1016/j.metabol.2017.02.006. Epub 2017 Feb 11. Metabolism. 2017. PMID: 28403943 Free PMC article. Clinical Trial.
References
-
- Holmes VA, Barnes MS, Alexander HD, McFaul P, Wallace JM. Vitamin D deficiency and insufficiency in pregnant women: a longitudinal study. Br J Nutr. 2009;102 (6):876–881. - PubMed
-
- O'Riordan MN, Kiely M, Higgins JR, Cashman KD. Prevalence of suboptimal vitamin D status during pregnancy. Ir Med J. 2008;101(8):240, 242–243. - PubMed
Publication types
MeSH terms
Substances
LinkOut - more resources
Full Text Sources
Other Literature Sources
Medical
