Visualization of granzyme B-expressing CD8 T cells during primary and secondary immune responses to Listeria monocytogenes
- PMID: 25367158
- PMCID: PMC4405321
- DOI: 10.1111/imm.12420
Visualization of granzyme B-expressing CD8 T cells during primary and secondary immune responses to Listeria monocytogenes
Abstract
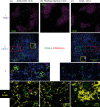
CD8 T cells contribute to long-term protection against Listeria monocytogenes infection by differentiating into memory T cells. These rapidly respond to antigen or inflammation upon secondary infection. In this study we used CD8 T cells from OT1 mice and CD4 T cells from OT2 mice expressing a fluorescent chimeric granzyme (GZMB-Tom) protein to monitor the primary response to infection with ovalbumin-expressing L. monocytogenes (Lm-OVA). We show that, unlike poorly responding CD4 T cells, CD8 T cells readily proliferated and expressed high levels of GZMB-Tom as early as 2 days after infection. FACS analysis showed GZMB-Tom expression in undivided CD8 T cells, with its level increasing over one to four divisions. OT1 T cells were visualized in the T-cell zone by confocal microscopy. This showed GZMB-Tom-containing granules oriented towards MHCII-positive cells. Twenty hours later, most OT1 T cells had divided but their level of GZMB-Tom expression was reduced. Recently divided OT1 cells failed to express GZMB-Tom. Fourteen hours after secondary infection, GZMB-Tom was re-expressed in memory OT1 T cells responding either to Lm-OVA or L. monocytogenes. Differences in the activation phenotype and in the splenic distribution of OT1 T cells were observed, depending on the challenge. Notably, OTI T cells with polarized granules were only observed after challenge with cognate antigen. This work showed that the GZMB-Tom knock-in mice in which GZMB-Tom faithfully reproduced GZMB expression, provide useful tools to dissect mechanisms leading to the development of anti-bacterial effector and memory CD8 T cells and reactivation of the memory response to cognate antigen or inflammatory signals.
Keywords: cytolytic T lymphocyte; fluorescent granzyme B; immune response to bacteria; memory T cells.
© 2014 INSERM and CNRS.
Figures


Similar articles
-
Visualization of cytolytic T cell differentiation and granule exocytosis with T cells from mice expressing active fluorescent granzyme B.PLoS One. 2013 Jun 28;8(6):e67239. doi: 10.1371/journal.pone.0067239. Print 2013. PLoS One. 2013. PMID: 23840635 Free PMC article.
-
Prolonged antigen presentation, APC-, and CD8+ T cell turnover during mycobacterial infection: comparison with Listeria monocytogenes.J Immunol. 2004 Mar 15;172(6):3491-500. doi: 10.4049/jimmunol.172.6.3491. J Immunol. 2004. PMID: 15004149
-
Constitutive expression of IL-7 receptor alpha does not support increased expansion or prevent contraction of antigen-specific CD4 or CD8 T cells following Listeria monocytogenes infection.J Immunol. 2008 Mar 1;180(5):2855-62. doi: 10.4049/jimmunol.180.5.2855. J Immunol. 2008. PMID: 18292507
-
Illuminating the petite picture of T cell memory responses to Listeria monocytogenes.Biomed Res Int. 2013;2013:121684. doi: 10.1155/2013/121684. Epub 2013 Sep 22. Biomed Res Int. 2013. PMID: 24171157 Free PMC article. Review.
-
Primary and secondary immune responses to Listeria monocytogenes.Curr Opin Immunol. 1996 Aug;8(4):526-30. doi: 10.1016/s0952-7915(96)80041-0. Curr Opin Immunol. 1996. PMID: 8794012 Free PMC article. Review.
Cited by
-
Studying the biology of cytotoxic T lymphocytes in vivo with a fluorescent granzyme B-mTFP knock-in mouse.Elife. 2020 Jul 22;9:e58065. doi: 10.7554/eLife.58065. Elife. 2020. PMID: 32696761 Free PMC article.
-
A New In Vivo Model to Study Protective Immunity to Zika Virus Infection in Mice With Intact Type I Interferon Signaling.Front Immunol. 2018 Mar 22;9:593. doi: 10.3389/fimmu.2018.00593. eCollection 2018. Front Immunol. 2018. PMID: 29623081 Free PMC article.
-
A fluorogenic probe for granzyme B enables in-biopsy evaluation and screening of response to anticancer immunotherapies.Nat Commun. 2022 May 2;13(1):2366. doi: 10.1038/s41467-022-29691-w. Nat Commun. 2022. PMID: 35501326 Free PMC article.
-
Phenotypic and functional characterization of T cells in white matter lesions of multiple sclerosis patients.Acta Neuropathol. 2017 Sep;134(3):383-401. doi: 10.1007/s00401-017-1744-4. Epub 2017 Jun 17. Acta Neuropathol. 2017. PMID: 28624961 Free PMC article.
-
Development of an anti-ferret CD4 monoclonal antibody for the characterisation of ferret T lymphocytes.J Immunol Methods. 2017 May;444:29-35. doi: 10.1016/j.jim.2017.02.009. Epub 2017 Feb 16. J Immunol Methods. 2017. PMID: 28216237 Free PMC article.
References
-
- Condotta SA, Richer MJ, Badovinac VP, Harty JT. Probing CD8 T cell responses with Listeria monocytogenes infection. Adv Immunol. 2012;113:51–80. - PubMed
-
- Pamer EG. Immune responses to Listeria monocytogenes. Nat Rev Immunol. 2004;4:812–23. - PubMed
-
- Kagi D, Ledermann B, Burki K, Hengartner H, Zinkernagel RM. CD8+ T cell-mediated protection against an intracellular bacterium by perforin-dependent cytotoxicity. Eur J Immunol. 1994;24:3068–72. - PubMed
-
- Conlan JW. Early pathogenesis of Listeria monocytogenes infection in the mouse spleen. J Med Microbiol. 1996;44:295–302. - PubMed
-
- Aoshi T, Zinselmeyer BH, Konjufca V, Lynch JN, Zhang X, Koide Y, Miller MJ. Bacterial entry to the splenic white pulp initiates antigen presentation to CD8+ T cells. Immunity. 2008;29:476–86. - PubMed
Publication types
MeSH terms
Substances
LinkOut - more resources
Full Text Sources
Other Literature Sources
Medical
Molecular Biology Databases
Research Materials

