Esophageal acid stimulation alters insular cortex functional connectivity in gastroesophageal reflux disease
- PMID: 25367277
- PMCID: PMC4308507
- DOI: 10.1111/nmo.12464
Esophageal acid stimulation alters insular cortex functional connectivity in gastroesophageal reflux disease
Abstract
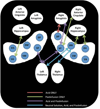
Background: The insula plays a significant role in the interoceptive processing of visceral stimuli. We have previously shown that gastroesophageal reflux disease (GERD) patients have increased insular cortex activity during esophageal stimulation, suggesting a sensitized esophago-cortical neuraxis. However, information regarding the functional connectivity (FC) of the insula during visceral stimulation is lacking. The primary aim of this study was to investigate the FC of insular subregions during esophageal acid stimulation.
Methods: Functional imaging data were obtained from 12 GERD patients and 14 healthy subjects during four steady state conditions: (i) presence of transnasal esophageal catheter (pre-infusion); (ii) neutral solution; (iii) acid infusion; (iv) presence of transnasal esophageal catheter following infusions (post-infusion). The insula was parcellated into six regions of interest. FC maps between each insular ROI and interoceptive regions were created. Differences in FC between GERD patients and healthy subjects were determined across the 4 study conditions.
Key results: All GERD patients experienced heartburn during and after esophageal acidification. Significant differences between GERD patients and healthy subjects were seen in: (i) insula-thalamic FC (neutral solution infusion, acid infusion, post-infusion); (ii) insula-amygdala FC (acid infusion, post-infusion); (iii) insula-hippocampus and insula-cingulate FC (post-infusion).
Conclusions & inferences: Esophageal stimulation in GERD patients revealed significant insular cortex FC differences with regions involved in viscerosensation and interoception. The results of our study provide further evidence that the insula, located at the transition of afferent physiologic information to human feelings, is essential for both visceral homeostasis and the experience of heartburn in GERD patients.
Keywords: heartburn; interoception; viscerosensation.
© 2014 John Wiley & Sons Ltd.
Conflict of interest statement
The authors have no conflict of interest to disclose.
Figures


Similar articles
-
Characterization of the cerebral cortical representation of heartburn in GERD patients.Am J Physiol Gastrointest Liver Physiol. 2004 Jan;286(1):G174-81. doi: 10.1152/ajpgi.00184.2003. Epub 2003 Sep 25. Am J Physiol Gastrointest Liver Physiol. 2004. PMID: 14512287
-
Neurocognitive processing of esophageal central sensitization in the insula and cingulate gyrus.Am J Physiol Gastrointest Liver Physiol. 2008 Mar;294(3):G787-94. doi: 10.1152/ajpgi.00421.2007. Epub 2008 Jan 10. Am J Physiol Gastrointest Liver Physiol. 2008. PMID: 18187518
-
Intrinsic functional connectivity of the brain swallowing network during subliminal esophageal acid stimulation.Neurogastroenterol Motil. 2013 Dec;25(12):992-e779. doi: 10.1111/nmo.12238. Epub 2013 Oct 8. Neurogastroenterol Motil. 2013. PMID: 24251873 Free PMC article.
-
Assessment of clinical severity and investigation of uncomplicated gastroesophageal reflux disease and noncardiac angina-like chest pain.Can J Gastroenterol. 1997 Sep;11 Suppl B:37B-40B. Can J Gastroenterol. 1997. PMID: 9347176 Review.
-
[The role of structural and functional insular cortex abnormalities in body perception disturbance in schizophrenia].Encephale. 2021 Jun;47(3):270-276. doi: 10.1016/j.encep.2020.11.004. Epub 2021 Apr 2. Encephale. 2021. PMID: 33814163 Review. French.
Cited by
-
Interplay of spinal and vagal pathways on esophageal acid-related anterior cingulate cortex functional networks in rats.Am J Physiol Gastrointest Liver Physiol. 2019 May 1;316(5):G615-G622. doi: 10.1152/ajpgi.00228.2018. Epub 2019 Feb 28. Am J Physiol Gastrointest Liver Physiol. 2019. PMID: 30817181 Free PMC article.
-
Electroacupuncture Relieves Visceral Hypersensitivity via Balancing PAR2 and PAR4 in the Descending Pain Modulatory System of Goats.Brain Sci. 2023 Jun 7;13(6):922. doi: 10.3390/brainsci13060922. Brain Sci. 2023. PMID: 37371401 Free PMC article.
-
The brain-esophagus axis in subjects with and without obesity assessed by esophageal acid perfusion and functional brain imaging.Ann Gastroenterol. 2023 Sep-Oct;36(5):504-510. doi: 10.20524/aog.2023.0818. Epub 2023 Jul 3. Ann Gastroenterol. 2023. PMID: 37664237 Free PMC article.
-
Progress on the Mechanism of Visceral Hypersensitivity in Nonerosive Reflux Disease.Gastroenterol Res Pract. 2022 Jan 20;2022:4785077. doi: 10.1155/2022/4785077. eCollection 2022. Gastroenterol Res Pract. 2022. PMID: 35096053 Free PMC article. Review.
References
-
- Sengupta JN. An overview of esophageal sensory receptors. American journal of medicine. 2000;108:87S–89S. - PubMed
-
- Qin C, Farber JP, Foreman RD. Intraesophageal chemicals enhance responsiveness of upper thoracic spinal neurons to mechanical stimulation of esophagus in rats. American journal of physiology Gastrointestinal and liver physiology. 2008;294(3):G708–G716. - PubMed
-
- Randich A, Gebhart GF. Vagal afferent modulation of nociception. Brain research Brain research reviews. 1992;17(2):77–99. - PubMed
Publication types
MeSH terms
Substances
Grants and funding
LinkOut - more resources
Full Text Sources
Other Literature Sources
Medical

