. 2015 Feb;25(2):246-56.
doi: 10.1101/gr.170332.113. Epub 2014 Nov 3.

Genome-wide analysis of local chromatin packing in Arabidopsis thaliana

Affiliations

Genome-wide analysis of local chromatin packing in Arabidopsis thaliana

Congmao Wang et al. Genome Res. 2015 Feb.

Abstract

The spatial arrangement of interphase chromosomes in the nucleus is important for gene expression and genome function in animals and in plants. The recently developed Hi-C technology is an efficacious method to investigate genome packing. Here we present a detailed Hi-C map of the three-dimensional genome organization of the plant Arabidopsis thaliana. We find that local chromatin packing differs from the patterns seen in animals, with kilobasepair-sized segments that have much higher intrachromosome interaction rates than neighboring regions, representing a dominant local structural feature of genome conformation in A. thaliana. These regions, which appear as positive strips on two-dimensional representations of chromatin interaction, are enriched in epigenetic marks H3K27me3, H3.1, and H3.3. We also identify more than 400 insulator-like regions. Furthermore, although topologically associating domains (TADs), which are prominent in animals, are not an obvious feature of A. thaliana genome packing, we found more than 1000 regions that have properties of TAD boundaries, and a similar number of regions analogous to the interior of TADs. The insulator-like, TAD-boundary-like, and TAD-interior-like regions are each enriched for distinct epigenetic marks and are each correlated with different gene expression levels. We conclude that epigenetic modifications, gene density, and transcriptional activity combine to shape the local packing of the A. thaliana nuclear genome.


Figures

Figure 1.
Figure 1.
Genome-wide interaction map of A. thaliana at 20-kb resolution. Elements represent normalized contact strength. Centromeric regions are masked.
Figure 2.
Figure 2.
Classification of the A. thaliana epigenome at 400-bp resolution. (A) Identification of chromatin states (CS). CS1–4 are according to Roudier et al. (2011), who used 12 epigenetic data sets that partially overlap with the 16 data sets used here. CS5 (gray) is related to CS1 (green) and CS6 (purple) to CS3 (red). (B) Enrichment of 16 epigenetic marks and chromatin state classification in 400-bp bins in a region from Chromosome 4. Comparison of CS classification in this study and that by Roudier et al. (2011) is also shown. (C) Visualization of classified bins with the first three principal components. Bins are colored according to their CS groups.
Figure 3.
Figure 3.
Epigenetic marks and contact strength. (A) Comparison of CS and contact strength across 2-kb bins graphed according to the first three principal components for epigenetic marks (similar to Fig. 2C). Contact strength is the sum of contacts of a 2-kb bin with the 10 surrounding bins. “Unclear” indicates no enrichment for any epigenetic mark. (B) Contact strengths of bins according to CS classification. CS3 and CS4 are shaded, as their sequences display biases that might result in lower contact strength values. (C) CS classification of bins ranked by contact strength, from low to high. (D) Contact strength of adjacent bins. In C,D, due to biases, data regarding CS3 and CS4 are not shown, but they are presented in Supplemental Figure 12. In B–D, the few bins of unclear categorization are not shown.
Figure 4.
Figure 4.
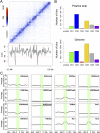
Genomic features associated with local strips. (A) Hi-C map of a genomic region from Chromosome 1. Index used to quantify local contrast is plotted below. Red dashed lines depict thresholds for calling strips. (B) Annotation of bins forming positive strips by CS. (C) Epigenetic marks around positive strips. Average enrichment means the percentage of each 400-bp region claimed as enriched for the respective epigenetic mark.
Figure 5.
Figure 5.
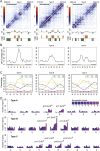
Insulator-like regions in the A. thaliana genome. (A) Examples of each type of insulator-like region, which are placed at the center of the Hi-C map details. Directionality index (DI) and HMM state are shown at the bottom. Positive and negative DI values indicate bins with stronger-than-expected interactions with downstream and upstream regions. Orange indicates downstream and green upstream bias, and the dashed boxes insulator-like regions. (B) DNase I hypersensitive sites (DH) around insulator-like regions. Coverage means the average percentage of each 500-bp bin annotated with such a feature. “U” and “D” bins have biased interactions with upstream and downstream regions, while “N” bins have no directionality bias. “X” indicates bins with any type of HMM state. (C) CS annotation of bins around insulator-like regions. (D) Distribution of genes by expression level around insulator-like regions. For bins from insulator-like regions, the P-values indicate the significance of change in expression level distribution from Cramér-von Mises tests. For C and D, the HMM state of bins are labeled as in B. See Supplemental Figure 18B for categorization of expression levels.
Figure 6.
Figure 6.
TAD-boundary-like and TAD-interior-like regions in the A. thaliana genome. (A) DNase I hypersensitive sites and CS. The cartoon on the left shows how a stretch of bins marked “U” or “D” is aligned with respect to the one marking either the start or the end of the pattern (highlighted with a vertical dotted line). (B) Genes ranked by expression level around TAD-boundary-like (top two rows) and TAD-interior-like regions (bottom two rows). Each row represents regions with bins of specific HMM state sequence. See figure legend of Figure 5B–D for other labels.

Similar articles

Cited by

References

    1. Becker C, Hagmann J, Muller J, Koenig D, Stegle O, Borgwardt K, Weigel D. 2011. Spontaneous epigenetic variation in the Arabidopsis thaliana methylome. Nature 480: 245–249. - PubMed
    1. Belton JM, McCord RP, Gibcus JH, Naumova N, Zhan Y, Dekker J. 2012. Hi-C: a comprehensive technique to capture the conformation of genomes. Methods 58: 268–276. - PMC - PubMed
    1. Costas C, de la Paz Sanchez M, Stroud H, Yu Y, Oliveros JC, Feng S, Benguria A, Lopez-Vidriero I, Zhang X, Solano R, et al. . 2011. Genome-wide mapping of Arabidopsis thaliana origins of DNA replication and their associated epigenetic marks. Nat Struct Mol Biol 18: 395–400. - PMC - PubMed
    1. de Wit E, de Laat W. 2012. A decade of 3C technologies: insights into nuclear organization. Genes Dev 26: 11–24. - PMC - PubMed
    1. Dekker J, Rippe K, Dekker M, Kleckner N. 2002. Capturing chromosome conformation. Science 295: 1306–1311. - PubMed

Publication types

Associated data