. 2014 Oct 16;41(4):567-78.
doi: 10.1016/j.immuni.2014.09.016.

The necroptosis adaptor RIPK3 promotes injury-induced cytokine expression and tissue repair

Affiliations

The necroptosis adaptor RIPK3 promotes injury-induced cytokine expression and tissue repair

Kenta Moriwaki et al. Immunity. .

Abstract

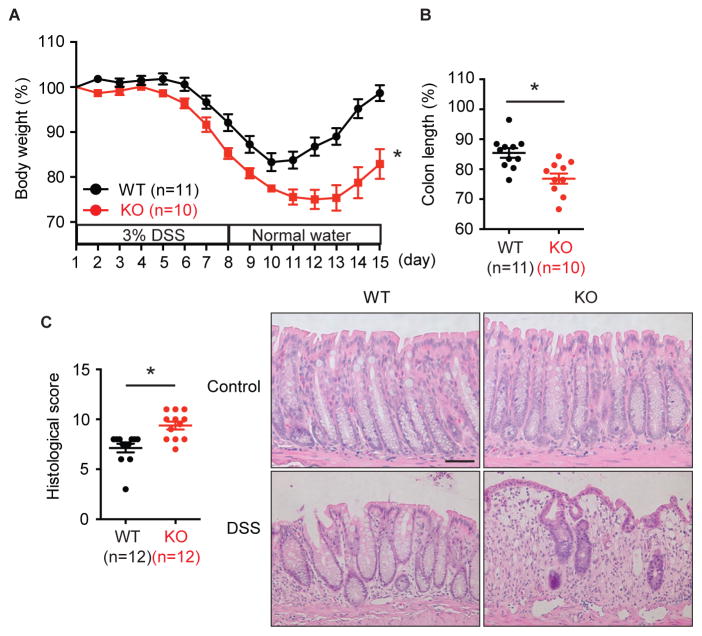
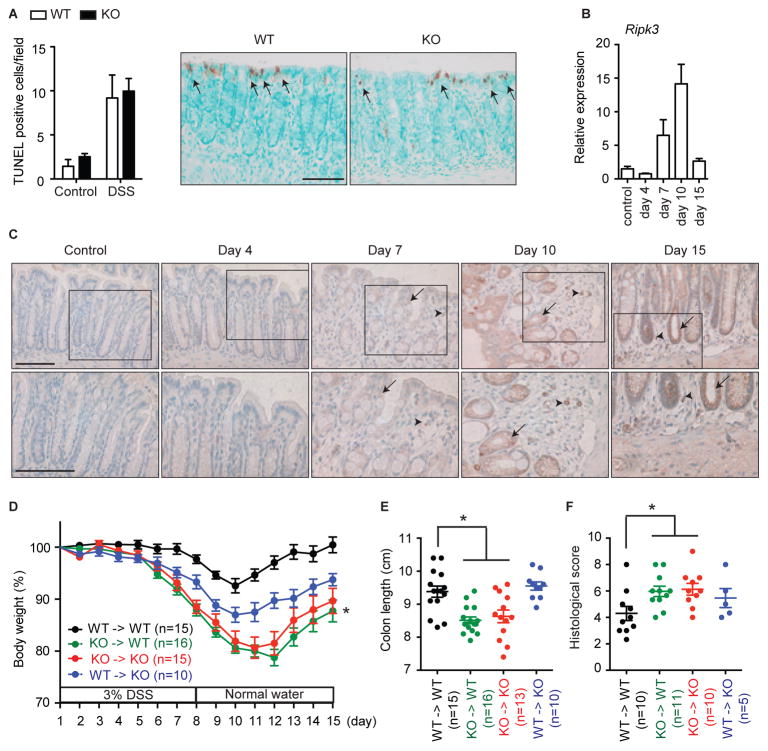
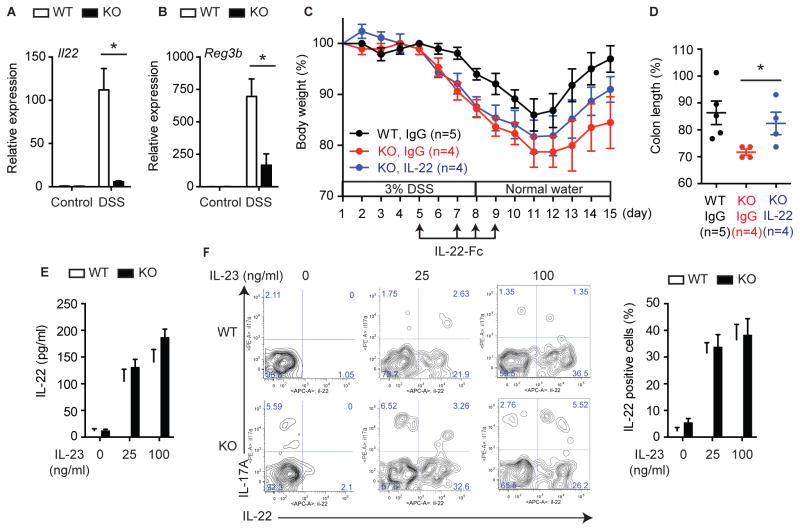
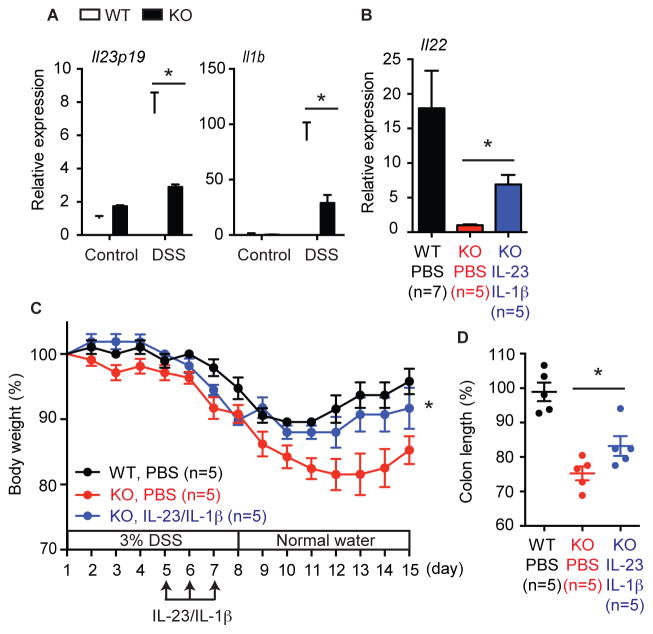
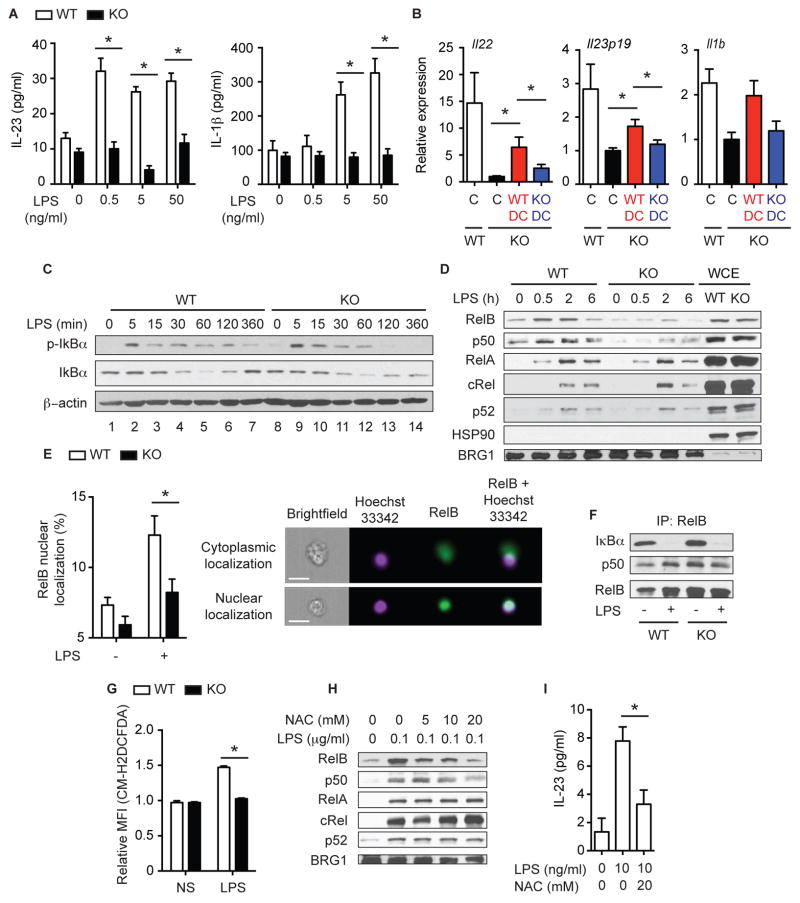
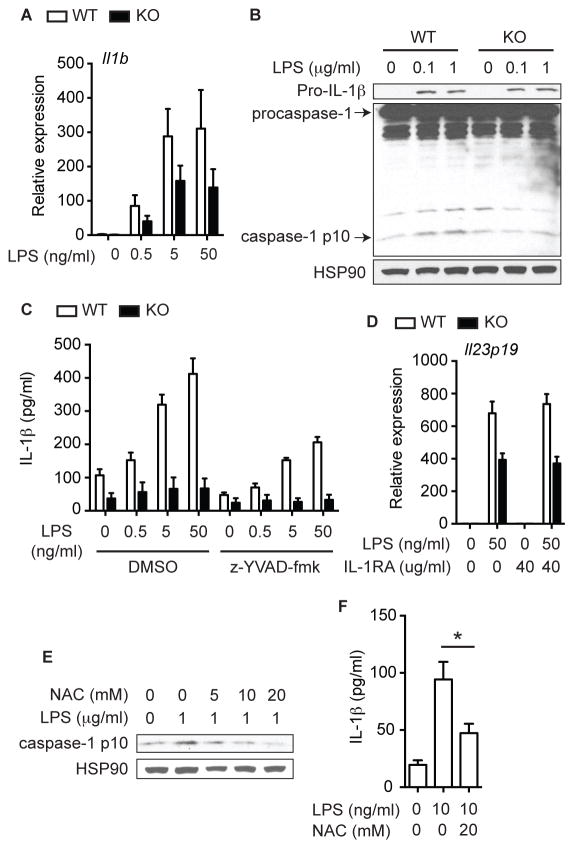
Programmed necrosis or necroptosis is an inflammatory form of cell death that critically requires the receptor-interacting protein kinase 3 (RIPK3). Here we showed that RIPK3 controls a separate, necrosis-independent pathway of inflammation by regulating cytokine expression in dendritic cells (DCs). Ripk3(-/-) bone-marrow-derived dendritic cells (BMDCs) were highly defective in lipopolysaccharide (LPS)-induced expression of inflammatory cytokines. These effects were caused by impaired NF-κB subunit RelB and p50 activation and by impaired caspase 1-mediated processing of interleukin-1β (IL-1β). This DC-specific function of RIPK3 was critical for injury-induced inflammation and tissue repair in response to dextran sodium sulfate (DSS). Ripk3(-/-) mice exhibited an impaired axis of injury-induced IL-1β, IL-23, and IL-22 cytokine cascade, which was partially corrected by adoptive transfer of wild-type DCs, but not Ripk3(-/-) DCs. These results reveal an unexpected function of RIPK3 in NF-κB activation, DC biology, innate inflammatory-cytokine expression, and injury-induced tissue repair.


Conflict of interest statement

The authors declare no competing financial interests.

Figures

Fig. 1
Fig. 1. RIPK3 protects against DSS-induced colitis
(A) Body weight and (B) colon length on day 15 of 3% DSS-treated Ripk3−/− (KO) and their littermate Ripk3+/+ (WT) mice. (C) Histological score of distal colon of 3% DSS-treated mice on day 15 were measured. Representative microscopic pictures of H&E stained colon from control mice and the mice treated with DSS for 15 days are shown on the right. Scale bar = 75 μm. The number in parentheses represents the number of mice used in each group. Results shown are mean ± SEM. Asterisks: p < 0.05. Three independent experiments. See also Figure S1.
Fig. 2
Fig. 2. RIPK3 in hematopoietic cells are required for the protection against DSS-induced colitis
(A) The number of TUNEL+ cells/visual field in colons from control mice and the mice treated with DSS for 4 days was enumerated. Representative pictures of TUNEL staining are shown. Arrows indicate TUNEL-positive cells. (B) Relative mRNA expression of Ripk3 in colon tissues of DSS-treated Ripk3+/+ mice (n=4–8). (C) RIPK3 expression in colon sections. Arrows and arrowheads indicate RIPK3+ colon epithelial cells and mononuclear cells in lamina propria, respectively. Magnified views of the marked areas are shown in lower panels. (DF) Bone marrow chimeras of the indicated genotypes were fed 3% DSS water and (D) body weight, (E) colon length and (F) histological score were measured. The numbers in parentheses represent the number of mice used in each group. White and black bars show Ripk3+/+ (WT) and Ripk3−/− (KO) mice, respectively. Scale bars = 75 μm. Results shown are mean ± SEM. Asterisks: p < 0.05 (D, green vs black or blue). Three independent experiments. See also Figure S2.
Fig. 3
Fig. 3. RIPK3 promotes repair of the intestinal epithelium
(A) The number of Ki67+ cells/colon crypt from control mice and the mice treated with DSS for 7 days was enumerated. Representative pictures of Ki67 staining are shown on the right. Scale bars = 75 μm. (B) Relative mRNA (n=5–12) and (C) protein expression (n=3–6) in DSS-treated Ripk3+/+ (WT) and Ripk3−/− (KO) colon on day 7. (D) T cell and macrophage recruitment to the colon after DSS treatment (day 7). (E) T cell, macrophage, and DC populations in the colonic lamina after DSS treatment (day 7). CD3+ cells and CD3CD19CD11cCD103CD11b+ cells were defined as T cells and macrophages, respectively. CD11c+ cells were defined as DCs. The various DC subsets defined by cell surface markers are also shown. Data were obtained from 4 mice for each genotype; 2 mice were pooled. Results shown are mean ± SEM. Asterisks: p < 0.05. See also Figure S3.
Fig. 4
Fig. 4. RIPK3 protects against DSS-induced colitis through IL-22 expression
(AB) Relative mRNA expression of (A) Il22 and (B) Reg3b in colon tissues of DSS-treated Ripk3+/+ (WT) and Ripk3−/− (KO) mice (day 7, n=5–12). (C) Body weight and (D) colon length on day 15 in the mice treated with 50 μg IL-22-Fc or isotype control IgG. The number in parentheses represents the number of mice used in each group. (EF) Splenocytes were stimulated with IL-23 in the presence of PMA and Ionomycin. (E) IL-22 expression was determined by ELISA (n=4). (F) Representative FACS plots showing IL-22 expression in splenic ILCs (CD3CD19CD11bIL-7R+CD4+CD25+ cells). The percentage of IL-22+ cells in splenic ILCs is shown on the right (n=4). Results shown are mean ± SEM. Asterisks: p < 0.05. See also Figure S4.
Fig. 5
Fig. 5. RIPK3 controls IL-22 expression through IL-23 and IL-1β induction
(A) Relative mRNA expression of Il23p19 and Il1b in colon tissues of DSS-treated Ripk3+/+ (WT) and Ripk3−/− (KO) mice (day 7, n=5–12). (B) Il22 expression on day 7, (C) body weight, and (D) colon length on day 15 in the mice treated with PBS or IL-1β and IL-23. The number in parentheses represents the number of mice used in each group. Results shown are mean ± SEM. Asterisks: p < 0.05 (C, blue vs red). See also Figure S5.
Fig. 6
Fig. 6. RIPK3 controls cytokine production in DCs by regulating RelB and p50 nuclear translocation
(A) IL-23 and IL-1β secretion by BMDCs treated with LPS for 6 hours (n=4). (B) Ripk3+/+ (WT: n=10) or Ripk3−/− (KO: n=8) BMDCs were injected to Ripk3−/− mice on day 5. PBS was injected into control mice (Ripk3+/+: n=14, Ripk3−/−: n=8). Cytokine expression in the colon on day7 is shown. Gene expression in Ripk3−/− PBS control was defined as 1. C: control. The results were pooled from two independent experiments. (C) Whole cell extracts (WCE) and (D) nuclear extracts from BMDCs treated with 100 ng/ml LPS were subjected to western blot analyses. p-IκBα = phopho IκBα. (E) BMDCs stimulated with 100 ng/ml LPS for 2 hours were subjected to intracellular staining for RelB (n=8). Representative pictures of cytoplasmic (top) and nuclear (bottom) RelB localization is shown on the right. Scale bars = 20 μm. (F) WCEs from Ripk3+/+ and Ripk3−/− BMDCs treated with 100 ng/ml LPS for 2 hours were subjected to immunoprecipitation with anti-RelB antibody followed by western blot analyses. (G) Relative mean fluorescence intensity (MFI) of the ROS reactive dye CM-H2DCFDA was measured in BMDCs treated with 100 ng/ml LPS for 6 hours (n=4). (H) NF-κB nuclear translocation (2 hours) and (I) IL-23 secretion (3 hours, n=4) by Ripk3+/+ BMDCs treated with LPS in the presence of NAC. Results shown are mean ± SEM. Asterisks: p < 0.05. See also Figure S6.
Fig. 7
Fig. 7. RIPK3 controls IL-1β secretion in DCs through inflammasome activation
(A) Relative mRNA expression of Il1b in Ripk3+/+ (WT) and Ripk3−/− (KO) BMDCs treated with LPS for 6 hours (n=4). (B) WCE from BMDCs treated with LPS for an hour was tested by western blot analysis. (C) Cytokine expression in BMDCs pretreated with 5 μM z-YVAD-fmk and then stimulated with LPS for 6 hours (n=2). (D) Relative Il23p19 expression in BMDCs pretreated with IL-1RA for an hour and then stimulated with LPS for 6 hours (n=3). (E) Caspase 1 activation (1 hour) and (F) IL-1β secretion (3 hours, n=4) in Ripk3+/+ BMDCs treated with LPS in the presence of NAC. Results shown are mean ± SEM. Asterisks: p < 0.05. See also Figure S7.

References

    1. Allam R, Lawlor KE, Yu EC, Mildenhall AL, Moujalled DM, Lewis RS, Ke F, Mason KD, White MJ, Stacey KJ, et al. Mitochondrial apoptosis is dispensable for NLRP3 inflammasome activation but non-apoptotic caspase-8 is required for inflammasome priming. EMBO Rep. 2014;15:982–990. - PMC - PubMed
    1. Allen IC, TeKippe EM, Woodford RM, Uronis JM, Holl EK, Rogers AB, Herfarth HH, Jobin C, Ting JP. The NLRP3 inflammasome functions as a negative regulator of tumorigenesis during colitis-associated cancer. J Exp Med. 2010;207:1045–1056. - PMC - PubMed
    1. Batinic-Haberle I, Cuzzocrea S, Reboucas JS, Ferrer-Sueta G, Mazzon E, Di Paola R, Radi R, Spasojevic I, Benov L, Salvemini D. Pure MnTBAP selectively scavenges peroxynitrite over superoxide: comparison of pure and commercial MnTBAP samples to MnTE-2-PyP in two models of oxidative stress injury, an SOD-specific Escherichia coli model and carrageenan-induced pleurisy. Free Radic Biol Med. 2009;46:192–201. - PMC - PubMed
    1. Becker C, Dornhoff H, Neufert C, Fantini MC, Wirtz S, Huebner S, Nikolaev A, Lehr HA, Murphy AJ, Valenzuela DM, et al. Cutting edge: IL-23 cross-regulates IL-12 production in T cell-dependent experimental colitis. J Immunol. 2006;177:2760–2764. - PubMed
    1. Bersudsky M, Luski L, Fishman D, White RM, Ziv-Sokolovskaya N, Dotan S, Rider P, Kaplanov I, Aychek T, Dinarello CA, et al. Non-redundant properties of IL-1alpha and IL-1beta during acute colon inflammation in mice. Gut. 2014;63:598–609. - PubMed

Publication types

MeSH terms