. 2014 Oct 16;41(4):605-19.
doi: 10.1016/j.immuni.2014.09.015.

miR-155 promotes T follicular helper cell accumulation during chronic, low-grade inflammation

Affiliations

miR-155 promotes T follicular helper cell accumulation during chronic, low-grade inflammation

Ruozhen Hu et al. Immunity. .

Abstract

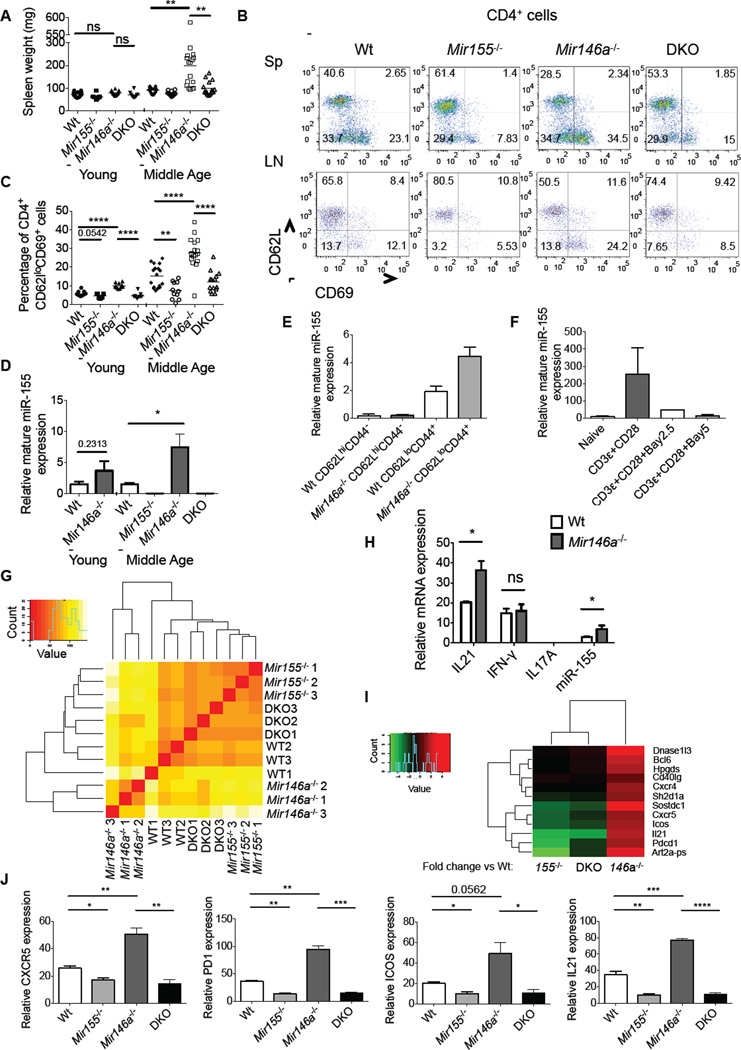
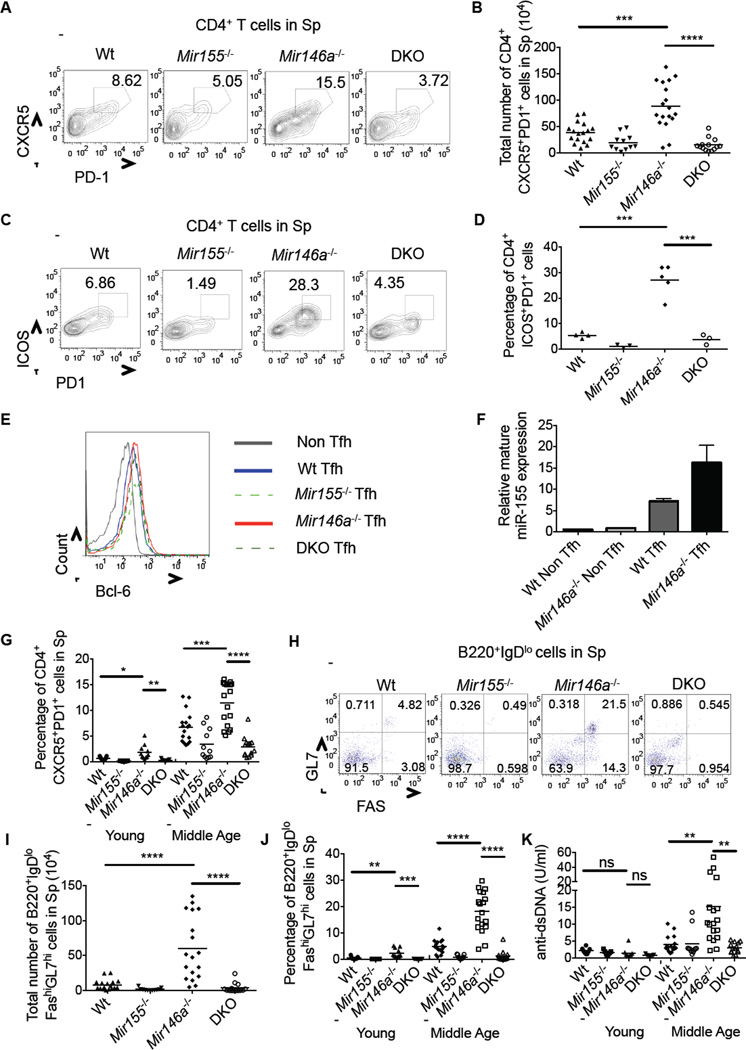
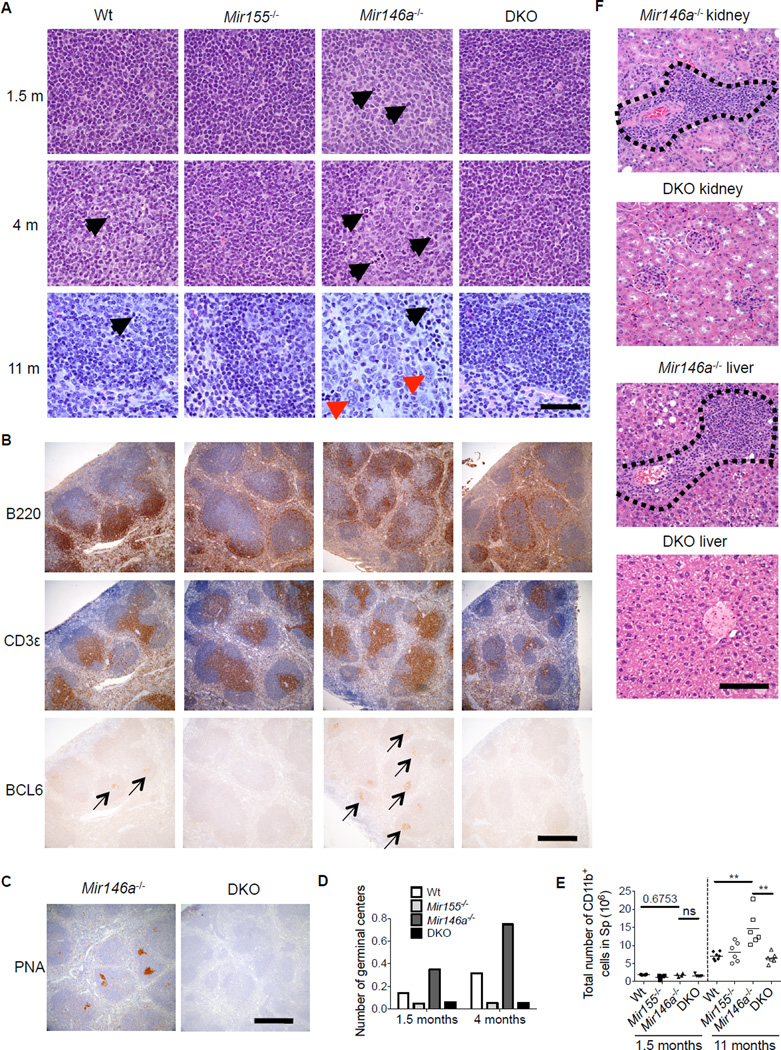
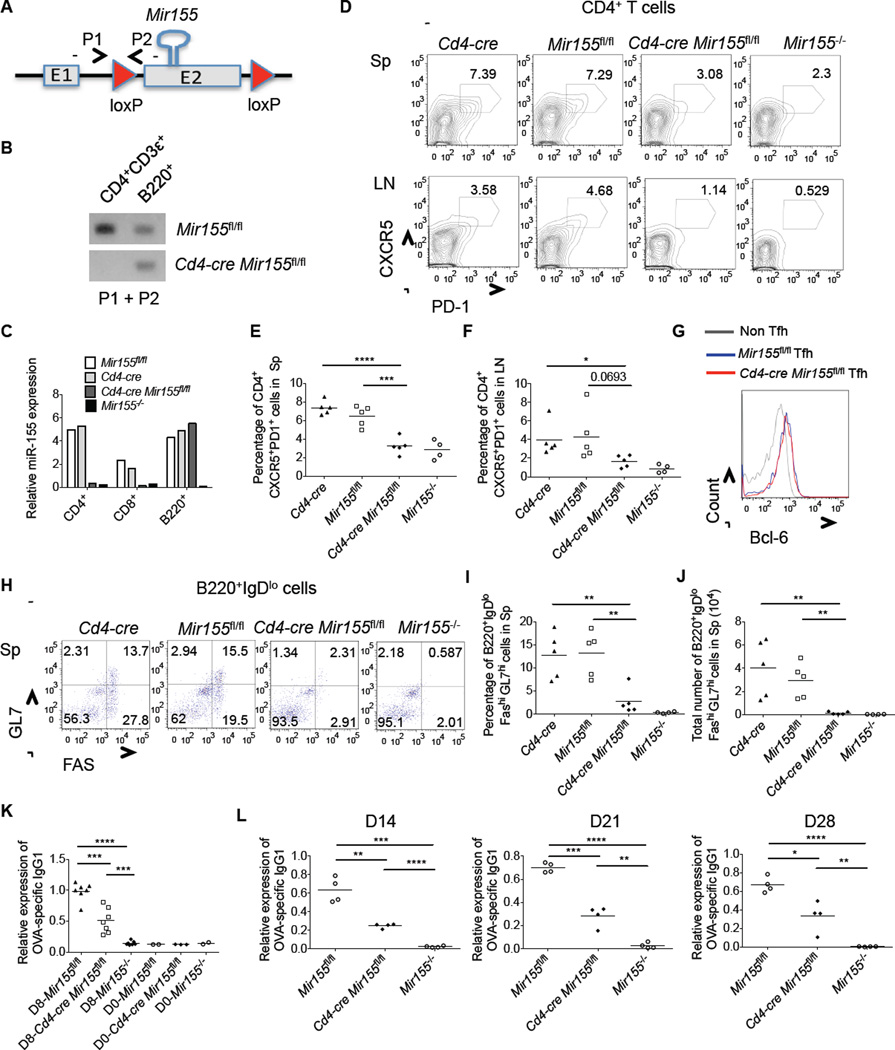
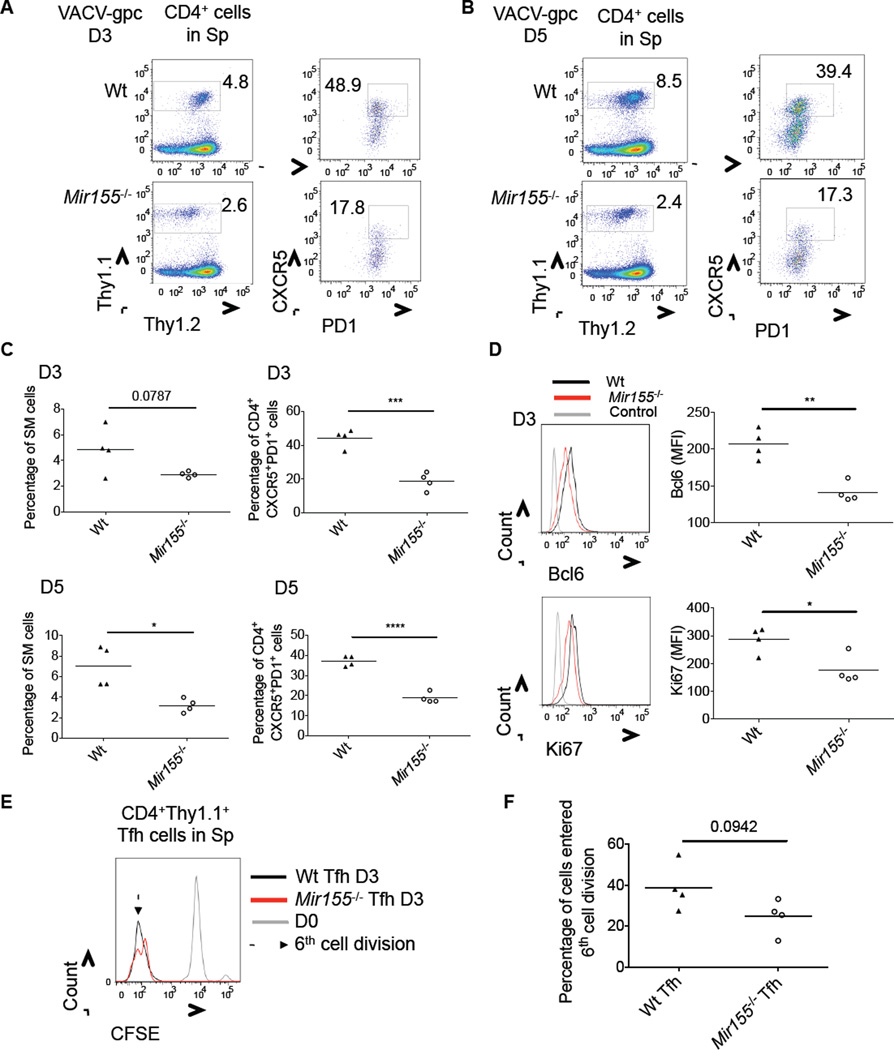
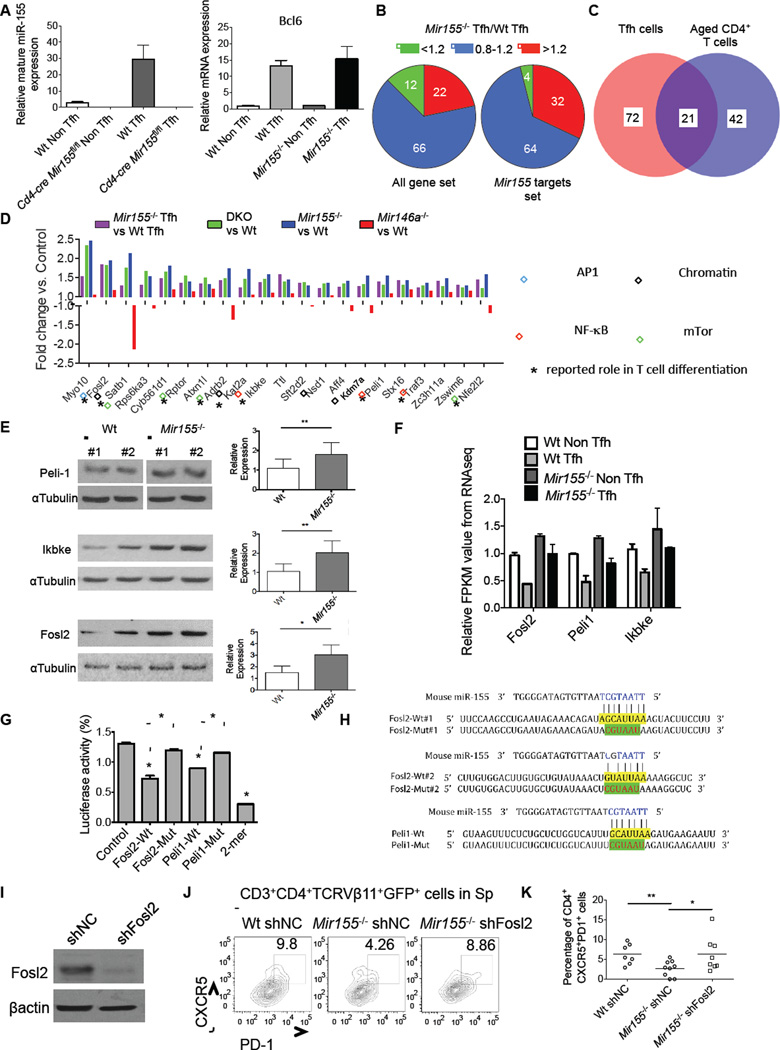
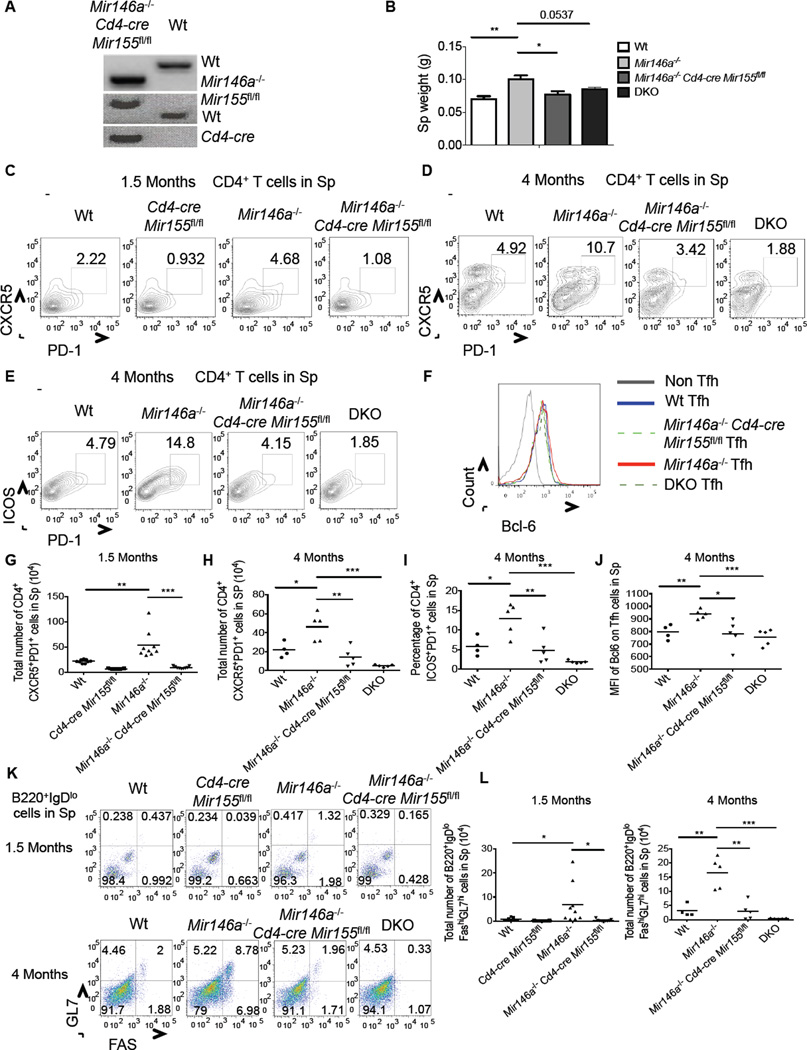
Chronic inflammation is a contributing factor to most life-shortening human diseases. However, the molecular and cellular mechanisms that sustain chronic inflammatory responses remain poorly understood, making it difficult to treat this deleterious condition. Using a mouse model of age-dependent inflammation that results from a deficiency in miR-146a, we demonstrate that miR-155 contributed to the progressive inflammatory disease that emerged as Mir146a(-/-) mice grew older. Upon analyzing lymphocytes from inflamed versus healthy middle-aged mice, we found elevated numbers of T follicular helper (Tfh) cells, germinal center (GC) B cells, and autoantibodies, all occurring in a miR-155-dependent manner. Further, Cd4-cre Mir155(fl/fl) mice were generated and demonstrated that miR-155 functions in T cells, in addition to its established role in B cells, to promote humoral immunity in a variety of contexts. Taken together, our study discovers that miR-146a and miR-155 counterregulate Tfh cell development that drives aberrant GC reactions during chronic inflammation.


Figures

Figure 1
Figure 1. miR-155 is required for expansion of CD4+ T cells with a Tfh cell gene expression profile in middle-aged Mir146a−/− mice
(A) Spleen weights from 2 (young) and 10 (middle-age) month-old age- and sex-matched Wt, miR155−/−, Mir146a−/− and Mir155−/− Mir146a−/− (DKO) mice. (B) Representative FACS analysis of activated (CD69+CD62L) CD4+ T cells in the spleens and lymph nodes of 10-months old mice. (C) Spleen data from multiple young and middle-aged mice in (B). (D) miR-155 expression in young and middle-aged CD4+ T cells of the indicated genotypes (n=3). (E) CD4+CD3+CD62lloCD44+ (activated) and CD4+CD3+CD62lhiCD44 (naïve) cells were sorted from 10-month old mouse spleens and miR-155 expression was assayed. (F) miR-155 expression in activated CD4+ T cells cultured with or without an NF-κB inhibitor (Bay 11-7082) at the indicated concentration (2.5 or 5 µM) for 24 hours. (G) Total RNA was extracted from splenic CD4+ T cells taken from 10-month old mice of the indicated genotypes and subjected to an RNA-Seq analysis (n=3). Gene clustering of RNA-Seq data is shown. The magnitude of the gene expression differences between any two groups is indicated by color, and the scale is shown. (H) Relative mRNA expression of IL21, IFN-γ, IL17A and miR-155 in CD4+ T cells from middle-aged Wt and Mir146a−/− mice. (I) Heat map indicating the fold change in Tfh cell gene expression between Mir146a−/−, Mir155−/− or Mir155−/− Mir146a−/− compared to Wt cells. The color key is shown. (J) QPCR analyses of Tfh-related genes in aged CD4+ T cells. The values have been normalized to L32. * denotes a p value of <0.05 using a Student’s t test. Dashed line indicates that young and middle-aged mice were harvested on different days, and each dot represents an individual mouse. See also Figure S1.
Figure 2
Figure 2. miR-155-dependent accumulation of Tfh cells, GC B cells and autoantibodies in Mir146a−/− mice
(A) Flow cytometry plots showing CD4+CXCR5+PD1+ Tfh cells in the spleens of middle-aged mice. (B) Average total number of Tfh cells in the spleens of middle-aged mice 7–10 months old. (C) Flow cytometry plots showing CD4+ICOS+PD1+ Tfh cells in the spleens of middle-aged mice. (D) Average percentage of CD4+ICOS+PD1+ Tfh cells in the spleens of middle-aged mice. (E) Bcl6 expression in Tfh and non-Tfh cells in the spleens of middle-aged mice. (F) CD4+CXCR5+PD1+ Tfh or CD4+CXCR5PD1 non-Tfh cells were sorted from the spleens of middle-aged mice and miR-155 expression was tested. (G) Average percentage of Tfh cells in the spleens of young and middle-aged mice. (H) Flow cytometry plots showing B220+IgDloGL7hiFAShi GC B cells in the spleens of middle-aged mice. (I) Average total number of GC B cells in the spleens of middle-aged mice. (J) Average percentage of GC B cells in the spleens of young and middle-aged mice. (K) ELISA of anti-dsDNA autoantibodies in the serum of young and middle-aged mice. Error bars represent +/− SEM. * denotes a p value of <0.05 using a Student’s T test. Dashed line indicates that young and middle-aged mice were harvested on different days, and each dot represents an individual mouse. Data represent at least two independent experiments. See also Figure S2.
Figure 3
Figure 3. Histological assessment of miR-155-dependent, spontaneous GC formation and chronic inflammatory disease in Mir146a−/− mice
(A) Representative H&E stained sections of Wt, Mir155−/−Mir146a−/− and Mir155−/−Mir146a−/− (DKO) male mouse spleens from the indicate ages. Black arrows represent examples of germinal center elements including large centroblasts, mitotic figures and apoptotic bodies. Red arrowheads represent myeloid cells. Scale bar: 40 microns. B. Spleen sections from 1.5 month-old mice were also subjected to IHC to detect T cells (CD3), B cells (B220) and BCL6+ cells. Arrows indicate regions with BCL6 positive cells. Scale bar: 400 microns. (C) Representative PNA staining of spleens from Mir146a−/− and Mir155−/−Mir146a−/− mice at 1.5 months of age. Scale bar: 100 microns. (D) The number of GCs per splenic lymphoid follicle was determined at 1.5 and 4 months of age. (E) CD11b+ myeloid cell numbers were measured using flow cytometry. (F) Representative H&E staining of kidneys and livers from Mir146a−/− and Mir155−/− Mir146a−/− mice at 12 months of age. Scale bar: 100 microns. Inflammatory infiltrate is located within the dashed boarder. * denotes a p value of <0.05 using a Student’s T test. See also Figure 3S.
Figure 4
Figure 4. T cell-intrinsic role for miR-155 during Tfh cell development and T-dependent humoral responses
(A) Schematic diagram showing the loxP sites flanking the miR-155 hairpin sequence in miR-155fl/fl mice, and location of genotyping primers. (B) Genomic DNAs were isolated from flow cytometry sorted CD4+CD3ε+ T and B220+ cells from the indicated mouse spleens and the primers that flank the 5’ loxP site were used for PCR. A representative agarose gel is shown to demonstrate T cell specific deletion of miR-155. (C) CD4+ T, CD8+ T and B220+ B cells were isolated from the indicated mouse spleens by flow cytometry sorting and expression of mature miR-155 by each cell type was assayed by QPCR. (D-L) The indicated mice were immunized with Ova in CFA. Following 8 days, spleens and LNs were isolated and subjected to staining with the indicated antibodies and analyzed by flow cytometry. (D) Representative FACS plots showing CD4+CXCR5+PD1+ Tfh cells in the spleens (upper panel) and LNs (lower panel). (E and F) Average percentage of Tfh cells in spleens (E) and LNs (F). (G) Bcl6 expression in Tfh and non-Tfh cells in the spleens of the indicated mice. (H) Flow cytometry plots showing GC B cells in the spleens. (I and J) Average percentage (I) or total number (J) of B220+IgDloFashiGL7hi GC B cells in the spleens. (K and L) Relative serum amounts of Ova-specific IgG1 antibodies in OVA immunized mice from the indicated time points and genotypes (D=Day). Error bars represent +/− SEM. * denotes a p value of <0.05 using a Student’s t test. Data represent at least three independent experiments. See also Figures 4S and 5S.
Figure 5
Figure 5. Robust Tfh cell differentiation by naïve antigen specific CD4+ T cells in response to VACV-gpc infection requires miR-155
8×10⁴ (D3) or 2×10⁴ (D5) Wt or Mir155−/− SM cells were transferred into B6 Wt mice which were infected with VACV-gpc the following day. Mice were analyzed at D3 or D5 post-infection. (A-B) Representative flow cytometry plots showing the percentage of Wt and Mir155−/−CD4+Thy1.1+ SM cells (left panel) and percentage of CXCR5+PD1+ Tfh cells within this population (right panel), in the spleens at the indicated time point. (C) Average percentage of SM T cells, or Tfh cells within this population, in the spleens at the indicated time points post-infection. (D) Representative histogram of Bcl6 or Ki67 staining of Wt or Mir155−/− SM cells at the 3-day time point. The average MFI of each stain is shown to the right. (E) Representative histogram showing CFSE expression by Wt or Mir155−/− SM Tfh cells at 3 days post infection. (F) The average percentage of Tfh cells having entered the 6th cell division. * denotes a p value of <0.05 using a Student’s t test. Data represent at least two independent experiments. See also Figure 5S.
Figure 6
Figure 6. Identification of Tfh cell-relevant miR-155 target genes in CD4+ T cells from middle-aged mice
(A) QPCR analyses of mature miR-155 and BCL6 mRNA expression in sorted Tfh and non-Tfh cells from the indicated mouse spleens following immunization. (B) Pie charts indicating the percentage of genes that are upregulated (>1.2) or downregulated (<0.8) in Mir155−/− vs. Wt Tfh cells based on all genes in the dataset or specifically miR-155 targets genes. (C) Venn diagram showing the number of common miR-155 targets in purified Tfh cells and CD4+ T cells from middle-aged mice. (D) Genes targeted by miR-155 according to the overlap in (C). Bars represent relative fold change of gene expression in the mutant cells compared to Wt controls based on RNA-Seq data. Boxes indicate different pathways in which these genes function, and * denotes that a role for the gene has been described in T cell differentiation. (E) Representative Western blot analysis of Peli1, Ikbke, Fosl2 and αTubulin expression in activated Wt and Mir155−/− CD4+ T cells (left). Quantification of Peli1 (n=9), Ikbke (n=6) and Fosl2 (n=4) expression in T cells from multiple mice normalized to αTubulin (right). (F) Relative expression of Fosl2, Peli1 and Ikbke in sorted CD4+ non Tfh and Tfh cells from OVA immunized Wt and Mir155−/− mice based on RNA-Seq. (G) Luciferase reporter assays demonstrating direct repression of the 3’ UTRs by miR-155. For Fosl2, the mutant 3’ UTR has both sites disrupted. (H) Schematic layout of the 3’ UTR sequence of mouse Fosl2 and Peli1 and the seed region (yellow) where miR-155 is predicted to bind. Mutant sequence is shown in green. (I) Representative Western blot analysis of Fosl2 expression in activated Wt CD4+ T cells after silencing with a shFosl2 expressing retroviral vector. (J) Representative flow cytometry plots showing the percentage of CXCR5+PD1+ Tfh cells among CD3+CD4+Vβ11+GFP+ cells in the spleens following 7 days of immunization with MOG35–55. (K) Average percentage of Tfh cells among CD3+CD4+Vβ11+GFP+ cells from (I). Error bars represent +/− SEM. * denotes a p value of <0.05 using a Student’s t test. See also Figure 6S.
Figure 7
Figure 7. T cell-intrinsic miR-155 is required for Tfh cell expansion in Mir146a−/− mice
(A) Genotyping gel confirming the creation of Mir146a−/− CD4-Cre: miR-155fl/fl mice. (B) Spleen weights from 4 month old mice of the indicated genotypes. (C) Flow cytomtery plots showing CD3+CD4+CXCR5+PD1+ Tfh cells in the spleens of 1.5-month or (D) 4-month old mice. (E) Representative flow cytomtery plots of CD3+CD4+ICOS+PD1+ Tfh cells from 4-month old spleens (F) Histogram showing Bcl6 expression by Tfh and non-Tfh cells in the spleens of the indicated genotypes at 4 months of age. (G-J) Average values for multiple mice from (C-F). (K) Flow cytometry plots showing B220+IgDloFashiGL7hi GC B cells in the spleens of the indicated mice at the 1.5 and 4 month time points. (L) Average total number of GC B cells in the spleens from (K). Error bars represent +/− SEM. * denotes a p value of <0.05 using a Student’s t test. Data represent two independent experiments. See also Figure 7S.

Comment in

References

    1. Agrawal A, Su H, Chen J, Osann K, Agrawal S, Gupta S. Increased IL-21 secretion by aged CD4+T cells is associated with prolonged STAT-4 activation and CMV seropositivity. Aging (Albany NY) 2012;4:648–659. - PMC - PubMed
    1. Akbaraly TN, Hamer M, Ferrie JE, Lowe G, Batty GD, Hagger-Johnson G, Singh-Manoux A, Shipley MJ, Kavimaki M. Chronic inflammation as a determinant of future aging phenotypes. CMAJ : Canadian Medical Association journal = journal de l'Association medicale canadienne. 2013 - PMC - PubMed
    1. Baumjohann D, Kageyama R, Clingan JM, Morar MM, Patel S, de Kouchkovsky D, Bannard O, Bluestone JA, Matloubian M, Ansel KM, Jeker LT. The microRNA cluster miR-17 approximately 92 promotes TFH cell differentiation and represses subset-inappropriate gene expression. Nat Immunol. 2013;14:840–848. - PMC - PubMed
    1. Betz BC, Jordan-Williams KL, Wang C, Kang SG, Liao J, Logan MR, Kim CH, Taparowsky EJ. Batf coordinates multiple aspects of B and T cell function required for normal antibody responses. J Exp Med. 2010;207:933–942. - PMC - PubMed
    1. Boldin MP, Taganov KD, Rao DS, Yang L, Zhao JL, Kalwani M, Garcia-Flores Y, Luong M, Devrekanli A, Xu J, et al. miR-146a is a significant brake on autoimmunity, myeloproliferation, and cancer in mice. J Exp Med. 2011;208:1189–1201. - PMC - PubMed

Publication types

MeSH terms

Associated data