

Recent climate and air pollution impacts on Indian agriculture
- PMID: 25368149
- PMCID: PMC4246269
- DOI: 10.1073/pnas.1317275111
Recent climate and air pollution impacts on Indian agriculture
Abstract
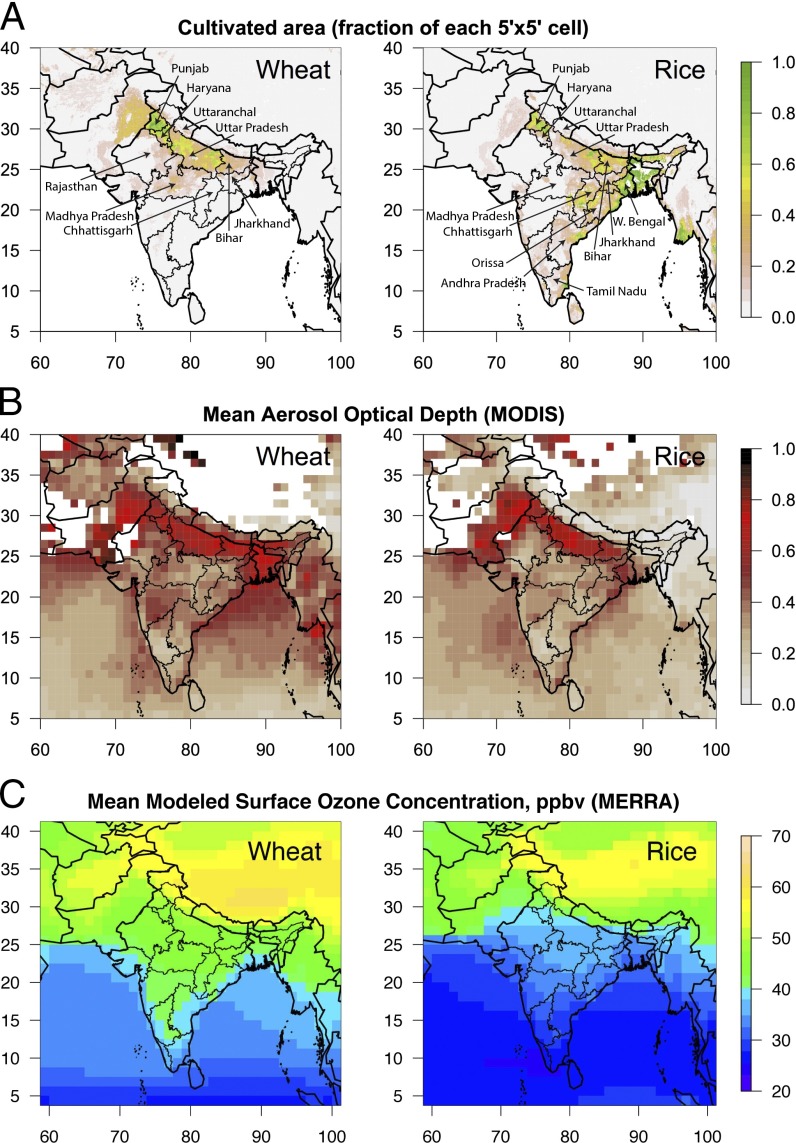
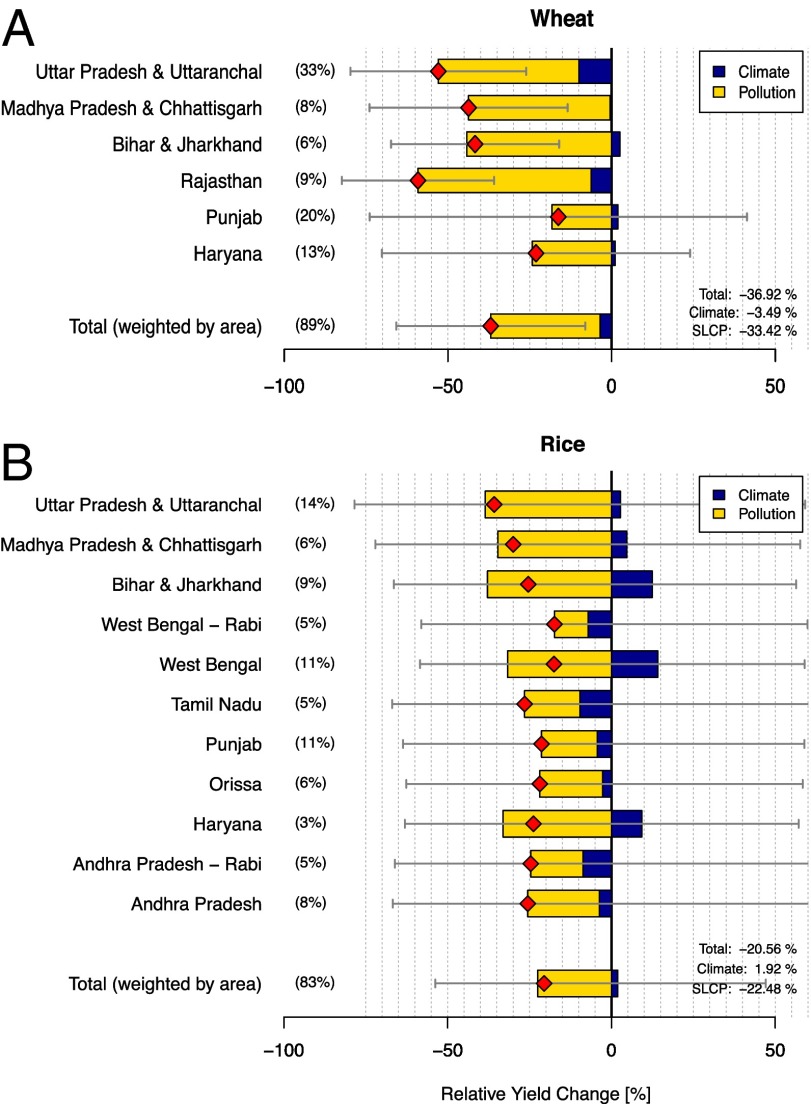
Recent research on the agricultural impacts of climate change has primarily focused on the roles of temperature and precipitation. These studies show that India has already been negatively affected by recent climate trends. However, anthropogenic climate changes are a result of both global emissions of long-lived greenhouse gases (LLGHGs) and other short-lived climate pollutants (SLCPs). Two potent SLCPs, tropospheric ozone and black carbon, have direct effects on crop yields beyond their indirect effects through climate; emissions of black carbon and ozone precursors have risen dramatically in India over the past three decades. Here, to our knowledge for the first time, we present results of the combined effects of climate change and the direct effects of SLCPs on wheat and rice yields in India from 1980 to 2010. Our statistical model suggests that, averaged over India, yields in 2010 were up to 36% lower for wheat than they otherwise would have been, absent climate and pollutant emissions trends, with some densely populated states experiencing 50% relative yield losses. [Our point estimates for rice (-20%) are similarly large, but not statistically significant.] Upper-bound estimates suggest that an overwhelming fraction (90%) of these losses is due to the direct effects of SLCPs. Gains from addressing regional air pollution could thus counter expected future yield losses resulting from direct climate change effects of LLGHGs.
Keywords: India; aerosols; agriculture; climate impacts; ozone.
Conflict of interest statement
The authors declare no conflict of interest.
Figures
References
-
- Food and Agriculture Organization of the United Nations, Food and Agriculture Organization of the United Nations Statistical Database (FAOSTAT). Available at www.faostat.org. Accessed June 5, 2014.
-
- Lin M, Huybers P. Reckoning wheat yield trends. Environ Res Lett. 2012;7(2):024016.
-
- Lobell DB, Schlenker W, Costa-Roberts J. Climate trends and global crop production since 1980. Science. 2011;333(6042):616–620. - PubMed
-
- Auffhammer M, Ramanathan V, Vincent J. Climate change, the monsoon, and rice yield in India. Clim Change. 2012;111(2):411–424.
-
- Lobell DB, et al. Prioritizing climate change adaptation needs for food security in 2030. Science. 2008;319(5863):607–610. - PubMed
Publication types
MeSH terms
Substances
LinkOut - more resources
Full Text Sources
Other Literature Sources
Medical
Miscellaneous
