. 2014 Nov 18;111(46):16484-9.
doi: 10.1073/pnas.1417215111. Epub 2014 Nov 3.

EGR2 is critical for peripheral naïve T-cell differentiation and the T-cell response to influenza

Affiliations

EGR2 is critical for peripheral naïve T-cell differentiation and the T-cell response to influenza

Ning Du et al. Proc Natl Acad Sci U S A. .

Abstract

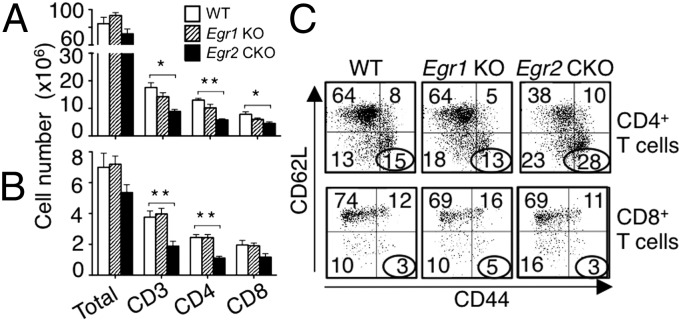
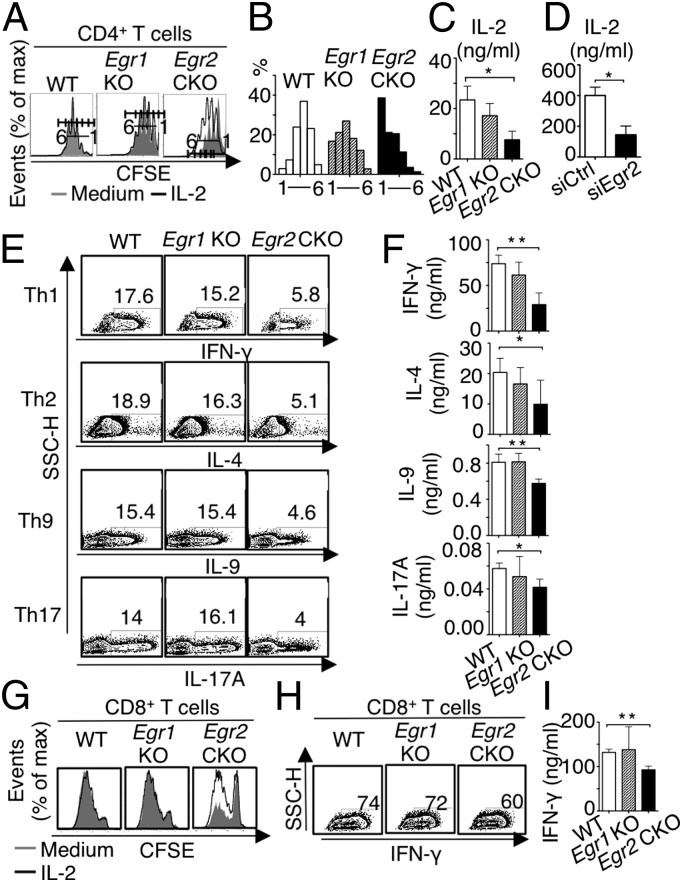
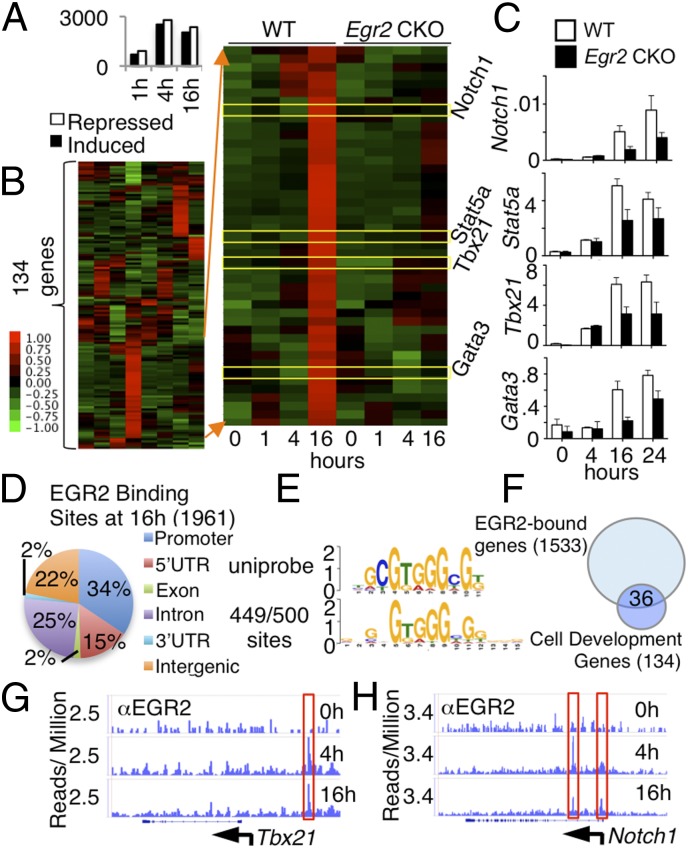
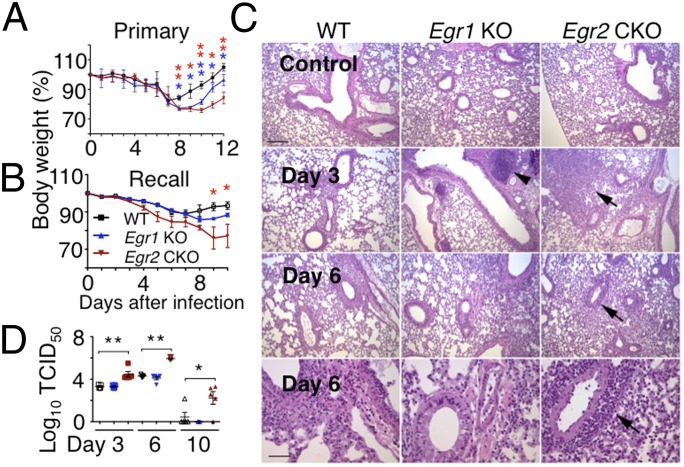
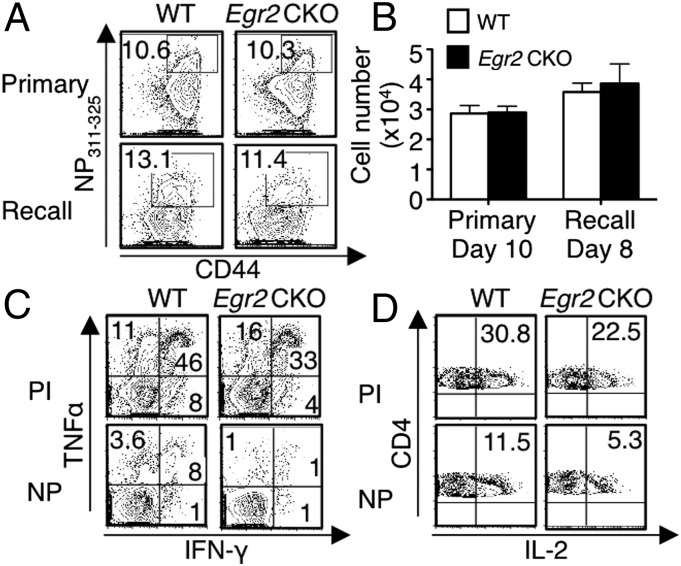
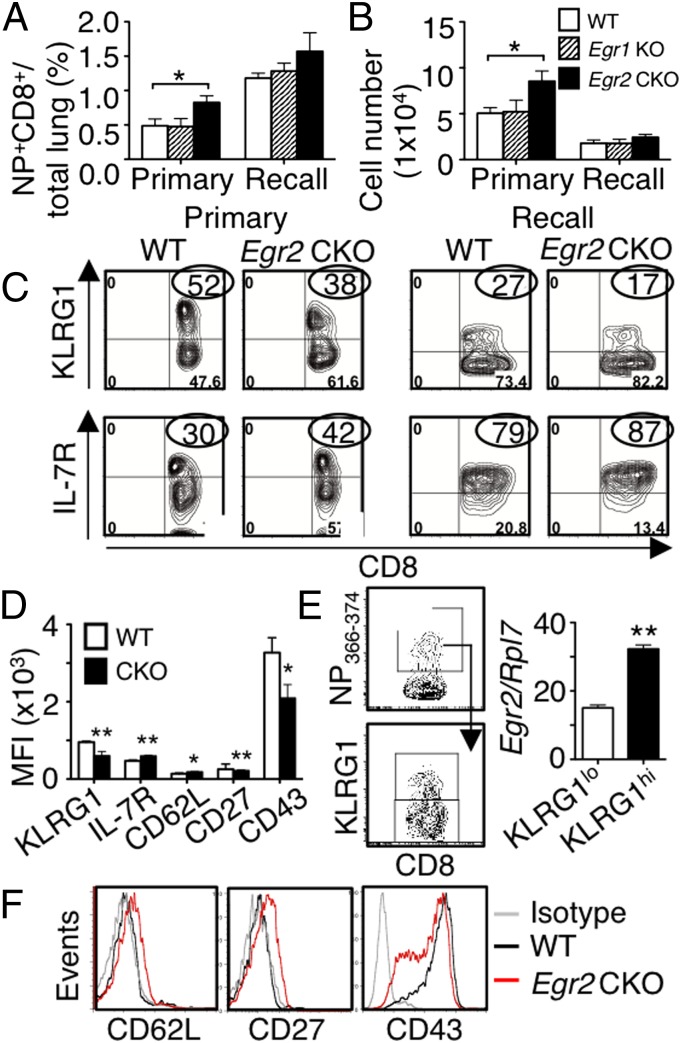
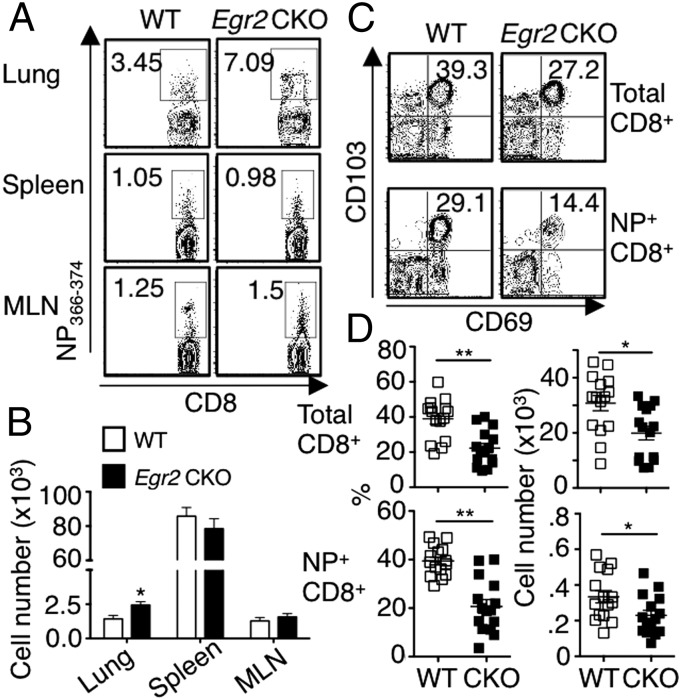
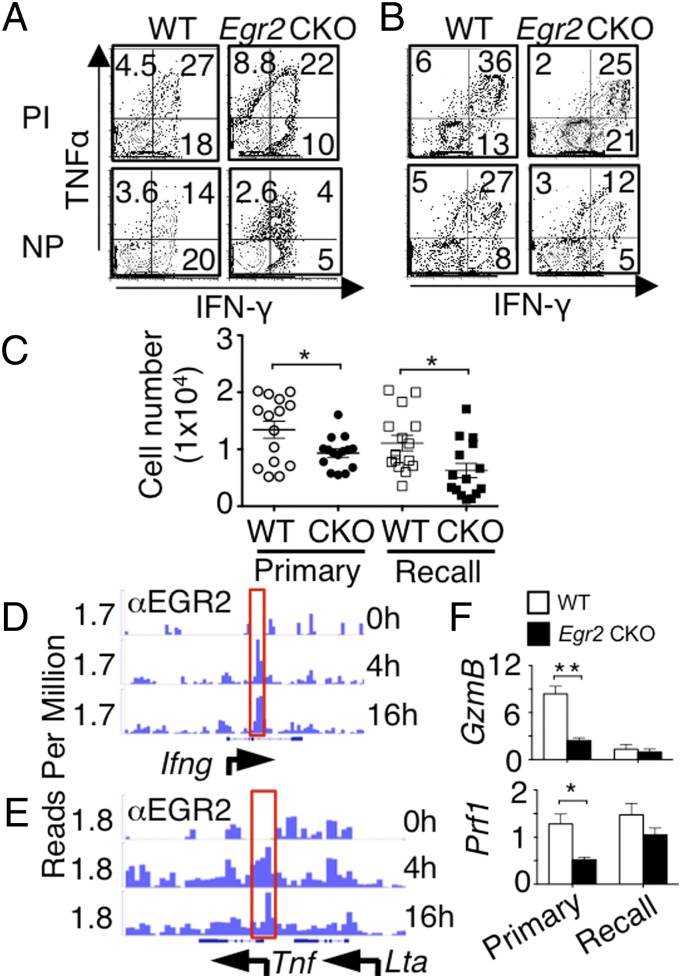
Early growth response 2 (EGR2) transcription factor negatively regulates T-cell activation, in contrast to the positive regulation of this process by EGR1. Here, we unexpectedly found that EGR2 promotes peripheral naïve T-cell differentiation, with delayed T-cell receptor-induced proliferation in naïve T cells from Egr2 conditional knockout (CKO) mice and decreased production of IFN-γ, IL-4, IL-9, and IL-17A in cells subjected to T-helper differentiation. Moreover, genes that promote T-cell activation, including Tbx21 and Notch1, had decreased expression in Egr2 CKO T cells and are direct EGR2 target genes. Following influenza infection, Egr2 CKO mice had delayed viral clearance, more weight loss, and more severe pathological changes in the lung than did WT and Egr1 KO mice, with decreased production of effector cytokines, increased infiltration of antigen-specific memory-precursor CD8(+) T cells, and lower numbers of lung-resident memory CD8(+) T cells. Thus, unexpectedly, EGR2 can function as a positive regulator that is essential for naïve T-cell differentiation and in vivo T-cell responses to a viral infection.

Keywords: EGR2; RNA-Seq; T cells; differentiation; influenza.


Conflict of interest statement

The authors declare no conflict of interest.

Figures

Fig. 1.
Fig. 1.
Decreased T cells in Egr2 CKO mice. (A and B) Spleen (A) and lymph node (B) cells were stained as indicated and analyzed by flow cytometry. Shown are cell numbers from 12 mice per group. (C) CD44 and CD62L expression on splenic CD4+ T cells (Upper) and CD8+ T cells (Lower). Data are from one representative of three experiments with 4 mice per group in each (C) and from three experiments (mean ± SD) (A and B).
Fig. 2.
Fig. 2.
Defective proliferation and differentiation of naïve CD4+ and CD8+ Egr2 CKO T cells. (A) Naïve splenic and lymph node CD4+ T cells were cultured for 3 d with anti-CD3 + anti-CD28 with or without IL-2, and cell divisions were analyzed by carboxyfluorescein succinimidyl ester (CFSE) dilution and flow cytometry. (B) Frequency of CFSE-positive cells at each division. (C) After 3-d stimulation, 1 × 10⁶ cells were washed twice in PBS, restimulated with anti-CD3 + anti-CD28 overnight, supernatant was collected, and IL-2 production determined by ELISA. (D) IL-2 production by ELISA from WT naïve CD4+ T cells stimulated with TCR for 72 h in the presence of Egr2 siRNA or control siRNA. (E) Naïve CD4+ T cells were differentiated under Th1, Th2, Th9, and Th17 conditions, and indicated cytokines were detected by intracellular staining and flow cytometry. (F) After 3-d polarization, 1 × 10⁶ cells were washed twice in PBS, restimulated with anti-CD3 + anti-CD28 overnight, supernatant was collected, and IFN-γ, IL-4, IL-9, and IL-17A were measured by ELISA. (G) Analysis of CD8+ T-cell division. (H and I) Cells were differentiated under Tc conditions and IFN-γ expression was determined by intracellular staining and flow cytometry (H) or by ELISA (I). Data are from one of four similar experiments with three mice per group in A, B, E, G, and H, or combined data from three experiments (mean ± SD) in C, F, and I, or representative of three independent experiments in D. In A and G, the shaded area is medium alone, and the black line corresponds to IL-2 treated cells.
Fig. 3.
Fig. 3.
Gene expression in TCR-induced Egr2 CKO T cells was altered. (AC) RNA-Seq was performed in WT and Egr2 CKO naïve CD4+ T cells not stimulated or stimulated with anti-CD3 + anti-CD28 for 1, 4, and 16 h. (A) Number of genes induced and repressed in Egr2 CKO T cells stimulated as indicated (the genes differentially expressed in Egr2 CKO T cells are listed in Dataset S1). (B) Heat map of RNA-Seq data for 134 genes that are differentially expressed (≥1.5-fold difference) in Egr2 CKO T cells compared with WT T cells (genes are listed in Dataset S2A). (C) RT-PCR analysis of expression of Notch1, Stat5a, Tbx21, and Gata3. (D) Genome-wide distribution of EGR2 binding sites based on ChIP-Seq performed in WT T cells not stimulated or stimulated with anti-CD3 + anti-CD28 for 4 and 16 h. The 5′ UTR, 3′ UTR, introns, exons, and intergenic regions were defined according to RefSeq, and promoter regions were defined as regions extending 15 kb 5′ of the transcription start site. Peaks up to 5 kb 3′ of the transcription stop site were considered as binding within the gene body. (E) Consensus motif for EGR2. We used TOMTOM to compare the derived motif with the UniPROBE Database. (F) The 36 genes related to cell development, growth, and proliferation that exhibited EGR2 binding by ChIP-Seq (genes are listed in Dataset S2B). (G and H) ChIP-Seq analysis of the binding of EGR2 at the Tbx21 (G) and Notch1 (H) loci. Data are representative of two independent experiments.
Fig. 4.
Fig. 4.
Egr2 CKO mice exhibit greater pathology than WT mice after influenza virus infection. (A and B) Body weight in WT, Egr1 KO, or Egr2 CKO mice in primary (A) and recall (B) infection models. (C) Histological examination on days 0, 3, and 6 after primary infection. (Scale bar in Top Left, 200 μm for the Top three rows; scale bar in Lower Left, 50 μm for the higher magnification view in the Bottom row.) Arrowhead, enlarged lymph node; arrows, perivascular lymphocyte infiltration. (D) Viral titers (50% tissue culture infectious dose, TCID50) from lungs on days 3, 6, and 10 after primary influenza infection. Data are representative of three experiments each with five mice per group (mean ± SD) in A and B, from representative experiments in C, or from one of three similar experiments (mean ± SD) in D.
Fig. 5.
Fig. 5.
IFN-γ, TNFα, and IL-2 production is lower in Egr2 CKO CD4+ than in WT CD4+ T cells after influenza infection. (A and B) Lung cells were isolated and stained with NP311–325 tetramer. Frequency (A) and absolute NP311–325+CD4+ T-cell numbers (B) at the primary and recall infection peak time points. (C and D) Lung cells were stimulated with PMA + ionomycin (PI) or influenza NP peptide for 5 h, with Golgi-stop added during the last 3 h. Flow cytometric profiles for IFN-γ and TNFα (C), and IL-2 (D) expression at the peak response for primary infection. Data are from one of three experiments in A, C, and D or from three experiments each with five mice per group (mean ± SD) in B.
Fig. 6.
Fig. 6.
A higher percentage of antigen-specific CD8+ T cells have a memory phenotype in Egr2 CKO mice than in WT mice after influenza infection. (A and B) Lung cells were stained with NP366–374 pentamer. Frequency (A) and absolute NP+CD8+ cell numbers (B) at peak primary and recall infection time points. (C) Flow cytometric profile of KLRG1hi and IL-7Rhi antigen-specific CD8+ T cells in primary (Left) or recall (Right) infection models. (D) Mean fluorescent intensity (MFI) of KLRG1, IL-7R, CD62L, CD27, and CD43 from antigen-specific CD8+ T cells after primary infection. (E) Antigen-specific KLRG1lo and KLRG1hi CD8+ T cells were sorted and Egr2 RNA expression on the two populations. (F) FACS profile of CD62L, CD27, and CD43 expression in antigen-specific CD8+ T cells. Data are for 24 mice per group, combined from four experiments (mean ± SD) in A, B, and D or from representative experiments in C, E, and F.
Fig. 7.
Fig. 7.
Fewer CD103+CD69+ lung-resident memory CD8+ T cells in lungs of Egr2 CKO than in WT mice, 6 wk after influenza infection. (A and B) Cells from lung, spleen, and MLN were isolated and stained with NP366–374 pentamer. Frequency (A) and absolute NP+CD8+ cell numbers (B) after 6-wk infection. (C) Expression of CD103 and CD69 on both total CD8+ (Upper) and antigen-specific CD8+ (Lower) T cells. (D) Frequency (Left) and absolute numbers (Right) of CD103+CD69+ T cells. Data are from one representative of three experiments in A and C or from three experiments each with five mice per group (mean ± SD) in B and D.
Fig. 8.
Fig. 8.
IFN-γ and TNFα production and CD8 effector function are lower in Egr2 CKO than in WT mice after influenza infection. (AC) Lung cells were stimulated with PMA + ionomycin (PI) or influenza NP peptide for 5 h, with Golgi-stop added during the last 3 h. Representative flow cytometric profiles for TNFα and IFN-γ expression at the peak response for primary (A) and recall (B) infection models. (C) Absolute number of TNFα+IFN-γ+CD8+ T cells with NP peptide stimulation. (D and E) ChIP-Seq analysis of the EGR2 binding at the Ifng (D) and Tnf (E) loci. (F) mRNA expression (RT-PCR) of Gzmb and Prf1 in CD8+ T cells purified after primary or recall infection models. Data are from one representative of three experiments in A and B, from three experiments with 15 mice combined (mean ± SD) in C, representative of two independent experiments in D and E or from three experiments each with five mice per group (F).

Similar articles

Cited by

References

    1. Dias S, Xu W, McGregor S, Kee B. Transcriptional regulation of lymphocyte development. Curr Opin Genet Dev. 2008;18(5):441–448. - PMC - PubMed
    1. Carleton M, et al. Early growth response transcription factors are required for development of CD4(-)CD8(-) thymocytes to the CD4(+)CD8(+) stage. J Immunol. 2002;168(4):1649–1658. - PubMed
    1. Bettini M, Xi H, Milbrandt J, Kersh GJ. Thymocyte development in early growth response gene 1-deficient mice. J Immunol. 2002;169(4):1713–1720. - PubMed
    1. Topilko P, et al. Krox-20 controls myelination in the peripheral nervous system. Nature. 1994;371(6500):796–799. - PubMed
    1. Li S, et al. Early growth response gene-2 (Egr-2) regulates the development of B and T cells. PLoS One. 2011;6(4):e18498. - PMC - PubMed

Publication types

MeSH terms

Associated data