. 2015 Mar;77(3):381-98.
doi: 10.1002/ana.24293. Epub 2015 Jan 29.

Cellular plasticity induced by anti-α-amino-3-hydroxy-5-methyl-4-isoxazolepropionic acid (AMPA) receptor encephalitis antibodies

Affiliations

Cellular plasticity induced by anti-α-amino-3-hydroxy-5-methyl-4-isoxazolepropionic acid (AMPA) receptor encephalitis antibodies

Xiaoyu Peng et al. Ann Neurol. 2015 Mar.

Abstract

Objective: Autoimmune-mediated anti-α-amino-3-hydroxy-5-methyl-4-isoxazolepropionic acid receptor (AMPAR) encephalitis is a severe but treatment-responsive disorder with prominent short-term memory loss and seizures. The mechanisms by which patient antibodies affect synapses and neurons leading to symptoms are poorly understood.

Methods: The effects of patient antibodies on cultures of live rat hippocampal neurons were determined with immunostaining, Western blot, and electrophysiological analyses.

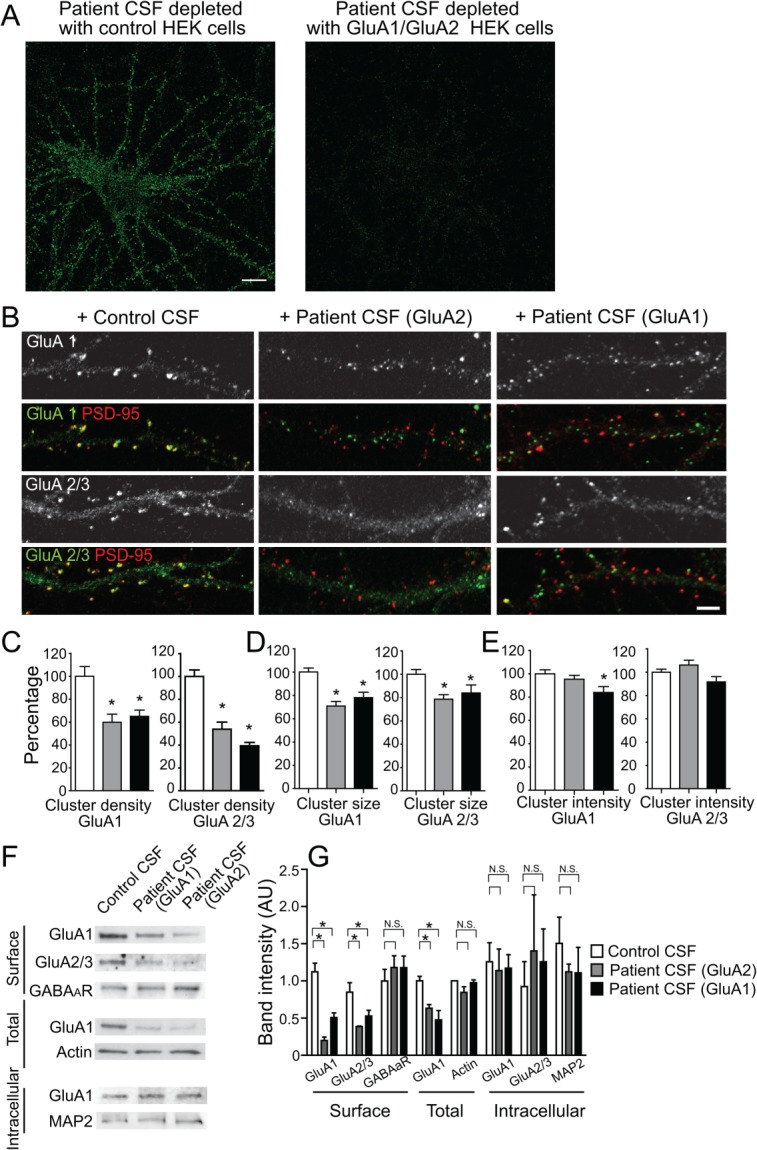
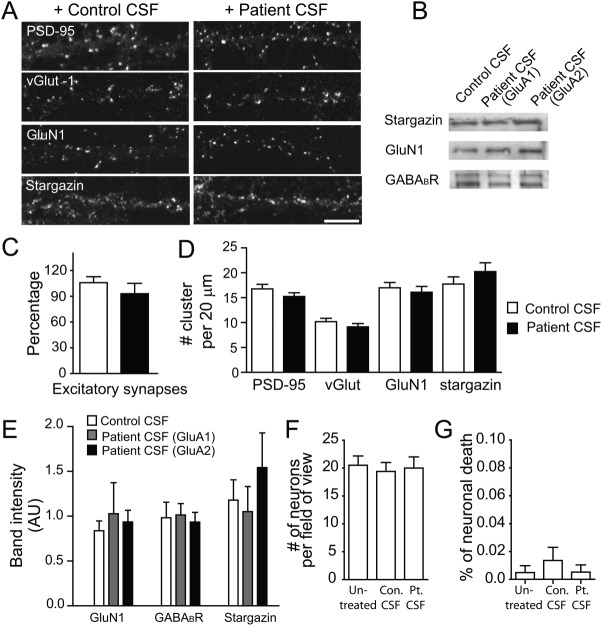
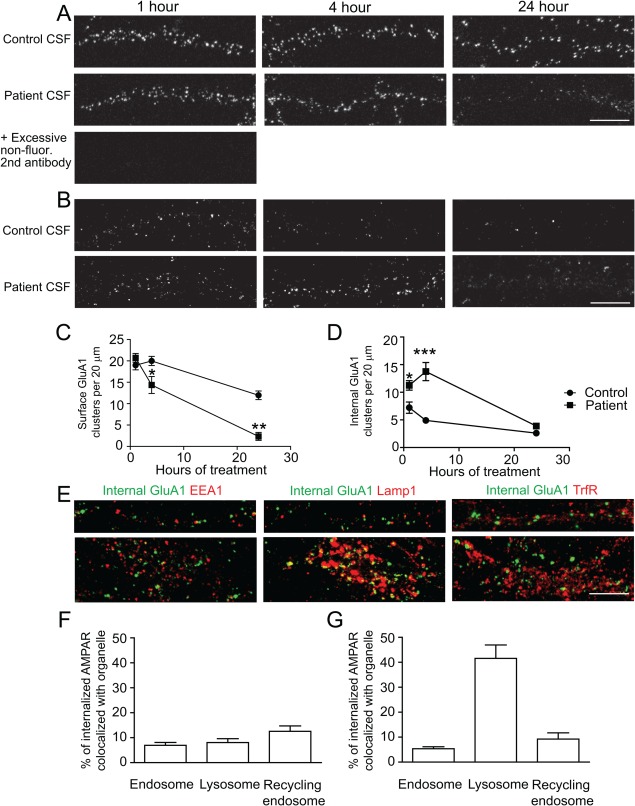
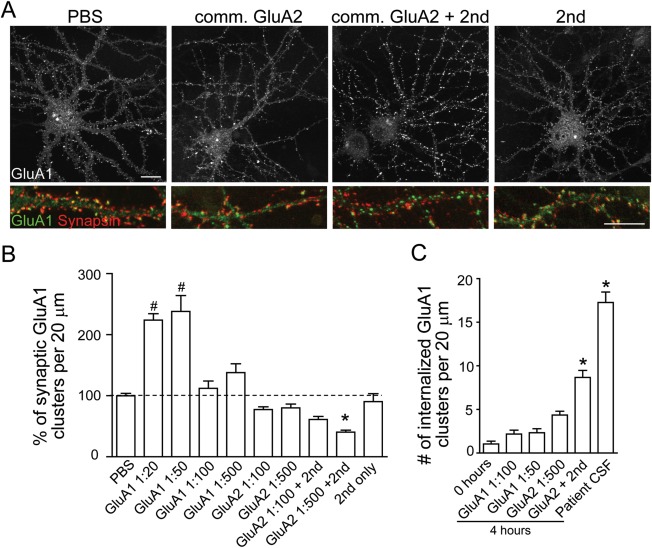
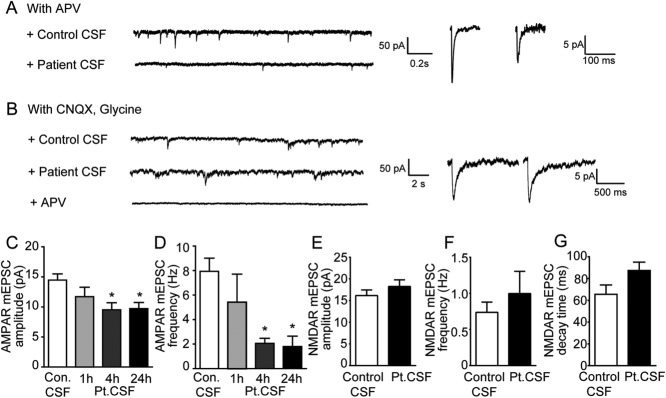
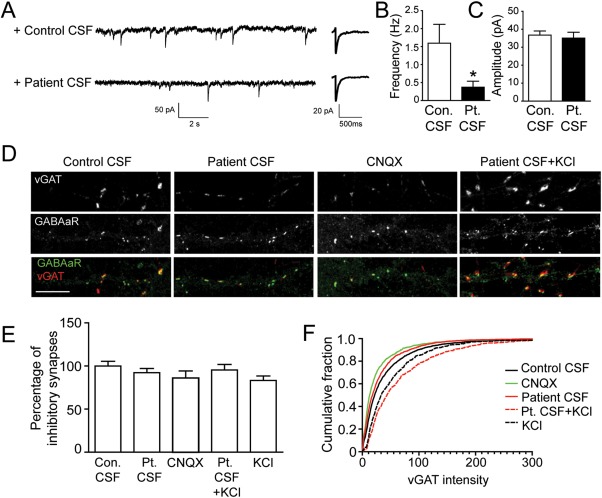
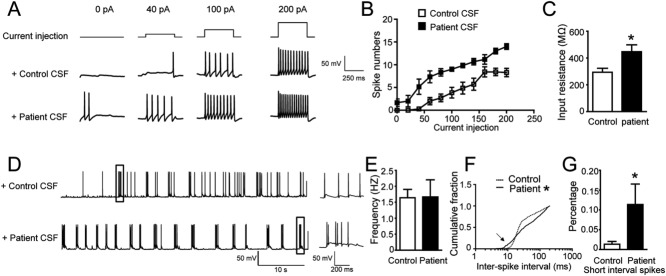
Results: We show that patient antibodies cause a selective decrease in the total surface amount and synaptic localization of GluA1- and GluA2-containing AMPARs, regardless of receptor subunit binding specificity, through increased internalization and degradation of surface AMPAR clusters. In contrast, patient antibodies do not alter the density of excitatory synapses, N-methyl-D-aspartate receptor (NMDAR) clusters, or cell viability. Commercially available AMPAR antibodies directed against extracellular epitopes do not result in a loss of surface and synaptic receptor clusters, suggesting specific effects of patient antibodies. Whole-cell patch clamp recordings of spontaneous miniature postsynaptic currents show that patient antibodies decrease AMPAR-mediated currents, but not NMDAR-mediated currents. Interestingly, several functional properties of neurons are also altered: inhibitory synaptic currents and vesicular γ-aminobutyric acid transporter (vGAT) staining intensity decrease, whereas the intrinsic excitability of neurons and short-interval firing increase.

Interpretation: These results establish that antibodies from patients with anti-AMPAR encephalitis selectively eliminate surface and synaptic AMPARs, resulting in a homeostatic decrease in inhibitory synaptic transmission and increased intrinsic excitability, which may contribute to the memory deficits and epilepsy that are prominent in patients with this disorder.


Figures

Figure 1
Figure 1
Patient anti-GluA1 or anti-GluA2 antibodies selectively decrease surface AMPAR clusters. (A) Hippocampal neurons immunostained with patient antibodies in cerebrospinal fluid (CSF). Patient CSF was preincubated with control human embryonic kidney (HEK) cells, or HEK cells expressing GluA1/GluA2 for 45 minutes, 6 times to deplete anti-GluA1/GluA2 antibodies. Control depleted patient CSF showed strong immunoreactivity with neuronal surface antigens; GluA1/GluA2 HEK cell-depleted patient CSF showed little immunoreactivity (1 anti-GluA1 patient [04067], 1 anti-GluA2 patient [02066]). Scale bar = 10μm. (B) Hippocampal neurons immunostained for GluA1- or GluA2-containing AMPAR clusters and postsynaptic PSD-95. Synaptic AMPAR clusters appear yellow due to colocalization of green GluA1 or GluA2/3 subunits and red PSD-95. Anti-GluA2 (middle panel) or anti-GluA1 (right panel) patient CSF treatment for 24 hours reduced synaptic GluA2 as well as GluA1 cluster density without affecting PSD-95 density (2 anti-GluA1 patients [04067, 09276], 1 anti-GluA2 patient [02066], 2 control patients [07238, 09724]; n = 18–24 neurons from 3 independent experiments). Scale bar = 5μm. (C) Quantification of synaptic GluA1 (left plot) or GluA2/3 (right plot) cluster density defined as the colocalization between GluA1 or GluA2/3 and PSD-95 clusters per 20μm dendrite length from neurons treated with control, anti-GluA1, or anti-GluA2 patient CSF. Asterisks indicate significant difference (compared with control, for synaptic GluA1 clusters, anti-GluA2 patient CSF treatment = 60 ± 7%, anti-GluA1 patient CSF treatment = 65 ± 5%, 1-way analysis of variance [ANOVA], p = 0.001; for synaptic GluA2 clusters, GluA2 patient CSF treatment = 54 ± 6%, GluA1 patient CSF treatment = 39 ± 3%, 1-way ANOVA, p < 0.0001). (D) Quantification of GluA1 (left plot) and GluA2/3 (right plot) cluster size (area of individual cluster measured in thresholded image) from neurons treated with control, anti-GluA1, or anti-GluA2 patient CSF. Asterisks indicate significant difference (compare to control, for GluA1 clusters, anti-GluA2 patient CSF treatment = 71 ± 4%, anti-GluA1 patient CSF treatment = 78 ± 5%, 1-way ANOVA, p < 0.0001; for synaptic GluA2 clusters, GluA2 patient CSF treatment = 79 ± 4%, GluA1 patient CSF treatment = 84 ± 7%, 1-way ANOVA, p = 0.01). (E) Quantification of GluA1 (left plot) and GluA2/3 (right plot) cluster intensity (average pixel intensity of individual cluster) from neurons treated with control, anti-GluA1, or anti-GluA2 patient CSF. Asterisk indicates significant difference (compared to control, GluA1 clusters, anti-GluA1 patient CSF treatment = 84 ± 5%, 1-way ANOVA, p = 0.03). (F) Western blot analyses of surface biotinylated (upper), total (middle), and intracellular (bottom) AMPAR protein. Patient antibody treatment for 1 day reduces surface and total AMPAR subunits, but not intracellular AMPARs. Surface γ-aminobutyric acidA receptor (GABAAR) and intracellular microtubule associated protein 2 (MAP2) were used as loading control; n = 3 independent experiments. (G) Quantification of band intensity of surface, total, and intracellular AMPAR protein after treatment with serum from anti-GluA1 or anti-GluA2 patients, showing a decrease in surface GluA1 and GluA2/3 protein in both patient antibody-treated neurons compared to control serum-treated neurons. Asterisks indicate significant difference (surface GluA1 band intensity, control = 1 ± 0.1, anti-GluA2 treated = 0.2 ± 0.05, anti-GluA1 treated = 0.1 ± 0.06, 1-way ANOVA, followed by Dunnett multiple comparison test, p < 0.0001; surface GluA2 band intensity, control = 0.9 ± 0.1, anti-GluA2 treated = 0.4 ± 0.01, anti-GluA1 treated = 0.5 ± 0.08, p < 0.05; total GluA1 band intensity, control = 1.0 ± 0.06, anti-GluA2 treated = 0.5 ± 0.1, anti-GluA1 treated = 0.6 ± 0.05, p < 0.05); N.S. indicates no significant difference in intracellular GluA1 or GluA2/3 protein (1-way ANOVA, followed by Dunnett multiple comparison test, p > 0.1).
Figure 2
Figure 2
Patient anti-GluA1 or anti-GluA2 antibodies do not alter other synaptic proteins. (A) Hippocampal neurons immunostained for the presynaptic marker vesicular glutamate transporter (vGlut) or the postsynaptic markers PSD-95, GluN1, or stargazin. Anti-GluA2 patient CSF treatment for 24 hours does not reduce vGlut, PSD-95, GluN1, and stargazin cluster density (1 anti-GluA1 patient [02066], 1 anti-GluA2 patient [04067], 2 control patients [07238, 09724], n = 12–36 neurons from 2–3 independent experiments). Scale bar = 10μm. (B) Western blot analyses of surface biotinylated stargazin, GABAB1R, and GluN1 protein (n = 3–6 experiments). (C) Quantification excitatory synapse density defined as the colocalization between postsynaptic PSD-95 and presynaptic vGlut density per 20μm dendrite length from neurons treated with control or patient CSF (control = 16 ± 1, patient = 13± 2, Mann–Whitney U test, p = 0.1). (D) Quantification of PSD-95 cluster density (control = 17 ± 1, patient = 15 ± 1, Mann–Whitney U test, p = 0.16), vGlut cluster density (control = 10 ± 1, patient = 9 ± 1, Mann–Whitney U test, p = 0.16), GluN1 cluster density (control = 17 ± 1, patient = 16 ± 1, Mann–Whitney U test, p = 0.57), and stargazin cluster density (control = 18 ± 1, patient = 20 ± 1.8, Mann–Whitney U test, p = 0.33) per 20μm dendrite length from neurons treated with control or patient CSF. (E) Quantification of surface GluN1, GABABR, and stargazin protein after treatment with serum from anti-GluA1 or anti-GluA2 patients, showing no significant changes in these surface proteins (1-way ANOVA, p > 0.1 for all tests). (F) Quantification of the density of dissociated hippocampal cells in vitro after 1 day of treatment with control or patient CSF (untreated = 21 ± 2, control [Con.] treated = 20 ± 2, patient [Pt.] treated = 20 ± 2, neurons per 750μm2, control 10501, patient 02066, n = 12 fields from 2 independent experiments; Kruskal–Wallis test, p = 0.9). (G) Quantification of the percent of terminal deoxynucleotide transferase–mediated deoxyuridine triphosphate nick-end labeling (TUNEL)–positive neurons in vitro (apoptotic cells). These measures were not significantly different among untreated, control, or patient CSF treatment (untreated = 0.005 ± 0.005, control treated = 0.01 ± 0.01, patient treated = 0.005 ± 0.005, neurons per 750μm2, n = 12 fields [750μm2], 1 patient sample [02066] and 1 control sample [10501], 2 independent experiments; Kruskal–Wallis test, p = 0.7).
Figure 3
Figure 3
Patient antibodies increase the internalization of AMPAR clusters. Hippocampal neurons were labeled live for surface AMPARs using commercial anti-GluA1 (comGluA1) for 1 hour, then treated with control (09724) or patient (02066) CSF for 1, 4 or 24 hours, followed by immunostaining for the remaining surface comGluA1 in live neurons. In experiments examining internalized comGluA1, before fixation, neurons were pretreated with an excess of unconjugated secondary antibodies, then fixed, permeabilized, and immunostained for internal comGluA1 (n = 23 neurons from 3 separate experiments). (A) Top and middle panels: Representative dendrites from neurons treated with control or patient CSF respectively for 1, 4, or 24 hours and stained for surface comGluA1. Patient CSF treatment caused a greater decrease in surface GluA1 over a 24-hour time period than control. Bottom image: dendrites preblocked with excessive nonfluorescent secondary antibodies and then stained with fluorescent secondary antibody against comGluA1, showing complete elimination of surface staining signal. Scale bar = 10μm. (B) Representative dendrites from neurons treated with control (top) or patient CSF (bottom) for 1, 4, or 24 hours and stained for intracellular comGluA1. Patient CSF treatment increased intracellular comGluA1 at 1 and 4 hours compared to controls. Scale bar = 10μm. (C) Quantification of surface comGluA1 clusters from neurons treated with patient CSF for 1 hour compared with control neurons (per 20μm dendrite length, control treated 1 hour = 20 ± 1, 4 hours = 20 ± 1, 24 hours = 12 ± 1; patient CSF treated 1 hour = 20 ± 1, 4 hours = 14 ± 2, 24 hour = 2 ± 1; Mann–Whitney U test, 1 hour p = 0.3, 4 hours p = 0.04, 24 hours p = 0.002). (D) Quantification of the density of intracellular comGluA1 clusters from neurons treated with control or patient CSF. Control treated 1 hour = 7 ± 1, 4 hours = 5 ± 0.4; 24 hours = 3 ± 0.3; patient CSF treated 1 hour = 11 ± 1, 4 hours = 14 ± 2, 24 hours = 4 ± 0.2; Mann–Whitney U test, 1 hour p = 0.03, 4 hours p = 0.0003, 24 hours p = 0.007. * indicates p < 0.05, ** p < 0.01, *** p < 0.001. (E) Hippocampal neurons were treated with patient CSF for 4 hours, then surface patient antibodies were pretreated by nonfluorescent secondary antibodies, and then stained for intracellular patient antibodies (green) and the following cell compartment markers (red): EEA for early endosome, Lamp1 for lysosome, or TrfR for recycling endosome. The upper panels show representative images of dendrites, the bottom panels show images of cell bodies (n = 6–7 neurons for each condition). Scale bar = 10μm. (F) Quantification of the percentage of internalized patient antibody clusters colocalized with each cell organelle marker in dendrites (EEA = 7 ± 1%, Lamp1 = 8 ± 2%, TrfR = 13 ± 2%). (G) Quantification of percentage of internalized patient antibody clusters colocalized with each cell organelle marker in cell bodies (EEA = 5 ± 1%, Lamp1 = 42 ± 5%, TrfR = 9 ± 3%).
Figure 4
Figure 4
Commercial antibodies do not have the same effects as patient antibodies. (A) Neurons were treated with phosphate-buffered saline (PBS), commercial (comm.) anti-GluA2, or anti-GluA1 antibodies directed against extracellular epitopes, with and without secondary antibodies to crosslink the primary antibodies, or secondary antibodies alone for 24 hours. Neurons were immunostained with an anti-GluA1 antibody against an intracellular epitope (if treated with anti-GluA2 antibody) or directly with fluorescent secondary (if treated with anti-GluA1) and for the presynaptic marker synapsin. Commercial anti-GluA2 antibodies with secondary antibody treatment for 24 hours decrease synaptic GluA1 cluster density (the colocalized yellow puncta are green labeled GluA1 clusters colocalized with red synapsin clusters, indicating synaptic GluA1). Scale bar = 10μm (n = 6–13 neurons from 3 experiments). (B) Quantification of the percentage of synaptic AMPAR cluster density per 20μm dendrite length from neurons treated with commercial GluA1 antibody or commercial GluA2 antibody compared to neurons treated with PBS (compared to PBS control, GluA1 1:20 = 225 ± 11%, GluA1 1:50 = 238 ± 26%, GluA1 1:100 = 112 ± 12%, GluA1 1:500 = 138 ± 15%, GluA2 1:100 = 78 ± 5%, GluA2 1:500 = 80 ± 6%, GluA2 1:100 + 2nd = 61 ± 5%, GluA2 1:500 + 2nd 1:500 = 44 ± 3%, 2nd only 1:500 = 91 ± 13%, analysis of variance followed by Dunn multiple comparison test, p < 0.0001; *significant decrease, #significant increase). (C) Quantification of internalization of GluA1 clusters prelabeled with a commercial antibody per 20μm dendrite from neurons also treated with a commercial GluA1 antibody, a commercial GluA2 antibody, or patient antibodies (n = 11–13 neurons from 3 experiments, 0 hours = 1 ± 0.3, GluA1 1:100 = 2 ± 0.4, GluA1 1:50 = 2 ± 0.5, GluA2 1:500 4 hours = 4 ± 0.4, GluA2 + 2nd 1:500 = 9 ± 0.8, patient CSF = 17 ± 1; Kruskal–Wallis test, p < 0.0001, *significant difference).
Figure 5
Figure 5
Patient antibodies decrease AMPAR but not NMDAR-mediated synaptic transmission. (A) Miniature excitatory postsynaptic currents (mEPSCs) recorded in physiological saline with TTX, picrotoxin (PTX), and APV to isolate synaptic AMPAR-mediated currents (upper trace); n = 9 neurons treated with control cerebrospinal fluid (CSF), 4 to 7 neurons treated with patient CSF for 1, 4, or 24 hours. Two patient (02066, 04067) and 2 control (09724, 09726) samples were used. Left: Under the same recording conditions, treatment of hippocampal neurons with patient CSF (bottom traces) for 1 day dramatically reduces synaptic AMPAR-mediated currents. Right: Representative average mEPSCs from neurons treated for 1 day with control CSF (left) or patient CSF (right). Neurons treated with patient CSF have smaller AMPAR-mediated synaptic current than neurons treated with control CSF. (B) mEPSCs recorded in physiological saline with TTX, PTX, and CNQX, to isolate synaptic NMDAR-mediated currents, and coagonist glycine. Left: Treatment of hippocampal neurons with control (upper trace) and patient CSF (bottom traces) for 1 day have comparable synaptic NMDAR-mediated currents. Right: Representative average mEPSCs from neurons treated for 1 day with control CSF (left) or patient CSF (right), show comparable synaptic NMDAR-mediated currents; n = 10 neurons treated with control CSF (09724), 9 neurons treated with patient CSF (02066). (C) Effect of patient antibodies on AMPAR-mediated synaptic current amplitude (in picoamperes, control [Con.] = 15 ± 1, patient [Pt.] CSF treated 1 hour = 12 ± 2, patient CSF treated 4 hours = 10 ± 1, patient CSF treated 24 hours = 10 ± 1; *significant difference, 1-way analysis of variance [ANOVA] test, p = 0.01). (D) Effect of patient antibodies on AMPAR-mediated synaptic current frequency (in hertz, control = 8 ± 1, patient CSF treated 1 hour = 5 ± 2, patient CSF treated 4 hours = 2 ± 0.4, patient CSF treated 24 hours = 2 ± 0.8; *significant difference, 1-way ANOVA test, p = 0.0017). (E) Effect of patient antibodies on NMDAR-mediated synaptic current amplitudes (in picoamperes, control = 16 ± 1, patient CSF treated = 18 ± 2; Student t test, p = 0.2). (F) Effect of patient antibodies on NMDAR-mediated synaptic current frequency (in hertz, control = 0.7 ± 0.1, patient CSF treated = 1 ± 0.3; Student t test, p = 0.44). (G) Effect of patient antibodies on NMDAR-mediated synaptic current decay time (in milliseconds, control = 66 ± 9, patient CSF treated = 88 ± 8; Student t test, p = 0.09).
Figure 6
Figure 6
Homeostatic decrease of GABAAR-mediated synaptic transmission. (A) Miniature inhibitory postsynaptic currents (mIPSCs) recorded in physiological saline with TTX, CNQX, and APV to isolate synaptic GABAAR-mediated currents. Hippocampal neurons treated with patient CSF (bottom left trace) for 1 day have fewer mIPSCs compared to control (upper left trace). The average amplitude of GABAAR-mediated mIPSCs in neurons treated with patient CSF (bottom right trace) was similar to control (bottom left trace); n = 8 control CSF-treated neurons, 6 patient CSF-treated neurons, 1 patient 02066, 2 control samples (09724, 09726). (B) Effect of patient antibodies on GABAAR-mediated mIPSC frequency (in hertz, control [Con.] = 1.6 ± 0.5, patient [Pt.] CSF treated = 0.4 ± 0.2; *significantly different from (B); Student t test, p = 0.03). (C) Effect of patient antibodies on GABAAR-mediated mIPSC amplitudes (in picoamperes, control = 37 ± 2, patient CSF treated = 35 ± 3; Student t test, p = 0.7). (D) Hippocampal neurons immunostained for the inhibitory presynaptic marker vGAT (red) and the postsynaptic marker GABAAR (green). Inhibitory synapses are defined as the colocalization between vGAT and GABAAR staining. Patient CSF or CNQX treatment for 24 hours reduces vGAT staining intensity, whereas patient CSF + KCl (25mM) increases vGAT intensity, compared to neurons treated with control CSF (15–24 neurons from 3 independent experiments). Scale bar = 10μm. (E) Quantification of inhibitory synapse density. Numbers of immunofluorescence labeled puncta per 20μm dendrite were normalized to controls for each trial. Neurons were treated with control CSF, patient CSF, CNQX, patient CSF + KCl (25mM), or KCl (25mM). The density of inhibitory synapses was comparable among conditions (Mann–Whitney U test, p = 0.5). (F) Cumulative distribution of vGAT intensity on neurons treated with control CSF (black solid line), patient CSF (red solid line), CNQX (green solid line), patient CSF + KCl (red dotted line), or KCl (black dotted line). Patient CSF- or CNQX-treated neurons have decreased vGAT staining intensity compared to the control (Kolmogorov–Smirnov test, p < 0.0001), whereas KCl alone or KCl + patient CSF–treated neurons have increased vGAT staining (Kolmogorov–Smirnov test, p < 0.0001).
Figure 7
Figure 7
Homeostatic increase of neuronal excitability and patient antibody effects on spontaneous firing. (A) Representative traces of action potential firing during current injection (upper traces, 0pA, 40pA, 100pA, 200pA) in control treated neurons (middle traces), and patient CSF-treated neurons (bottom traces). The recording was done in the presence of APV, CNQX, and picrotoxin to block synaptic transmission; n = 7 control neurons, 6 patient CSF-treated neurons, 1 patient sample (02066) and 1 control sample (09726). (B) Quantification of action potential firing versus current injection, showing significant increase of neuronal excitability in patient CSF-treated neurons (Mann–Whitney U test, p < 0.05 for 0, 40, 60, 80,100, 120, 140, 180, and 200pA). (C) Average input resistance was higher in patient CSF-treated neurons than in controls (in megaohms, control = 294 ± 29, patient CSF-treated = 448 ± 51, *significant difference, Student t test, p = 0.04). (D) Representative traces of spontaneous action potential firing in control (upper trace) or patient CSF-treated neurons (bottom trace) without synaptic transmission blockers. The boxed segments are shown on a slower time scale on the right; n = 5 control neurons, 6 patient CSF-treated neurons, 1 patient sample (04067) and 1 control sample (09724). (E) Average action potential firing frequency was not significantly different in control or patient CSF-treated neurons (in hertz, control = 1.6 ± 0.3, patient CSF treated = 1.7 ± 0.5, Student t test, p = 0.9). (F) Cumulative distribution of action potential interspike intervals of neurons treated with control CSF (dotted line) or patient CSF (solid line). *Two distributions are significantly different (Kolmogorov–Smirnov test, p < 0.0001). (G) Comparison of percentage of short-interval spikes (with <10-millisecond intervals) in control treated or patient CSF-treated neurons (control treated = 1.3 ± 0.7%, patient treated = 11 ± 5%, *significant difference, Student t test, p = 0.02).

References

    1. Lancaster E, Dalmau J. Neuronal autoantigens—pathogenesis, associated disorders and antibody testing. Nat Rev Neurol. 2012;8:380–390. - PMC - PubMed
    1. Moscato EH, Jain A, Peng X, et al. Mechanisms underlying autoimmune synaptic encephalitis leading to disorders of memory, behavior and cognition: insights from molecular, cellular and synaptic studies. Eur J Neurosci. 2010;32:298–309. - PMC - PubMed
    1. Sansing LH, Tüzün E, Ko MW, et al. A patient with encephalitis associated with NMDA receptor antibodies. Nat Clin Pract Neurol. 2007;3:291–296. - PMC - PubMed
    1. Dalmau J, Gleichman AJ, Hughes EG, et al. Anti-NMDA-receptor encephalitis: case series and analysis of the effects of antibodies. Lancet Neurol. 2008;7:1091–1098. - PMC - PubMed
    1. Lai M, Hughes EG, Peng X, et al. AMPA receptor antibodies in limbic encephalitis alter synaptic receptor location. Ann Neurol. 2009;65:424–434. - PMC - PubMed

Publication types

Substances