Quantitative assessment of murine articular cartilage and bone using X-ray phase-contrast imaging
- PMID: 25369528
- PMCID: PMC4219817
- DOI: 10.1371/journal.pone.0111939
Quantitative assessment of murine articular cartilage and bone using X-ray phase-contrast imaging
Abstract
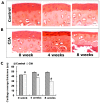
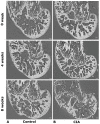
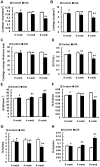
Murine models for rheumatoid arthritis (RA) research can provide important insights for understanding RA pathogenesis and evaluating the efficacy of novel treatments. However, simultaneously imaging both murine articular cartilage and subchondral bone using conventional techniques is challenging because of low spatial resolution and poor soft tissue contrast. X-ray phase-contrast imaging (XPCI) is a new technique that offers high spatial resolution for the visualisation of cartilage and skeletal tissues. The purpose of this study was to utilise XPCI to observe articular cartilage and subchondral bone in a collagen-induced arthritis (CIA) murine model and quantitatively assess changes in the joint microstructure. XPCI was performed on the two treatment groups (the control group and CIA group, n = 9 per group) to monitor the progression of damage to the femur from the knee joint in a longitudinal study (at 0, 4 and 8 weeks after primary injection). For quantitative assessment, morphologic parameters were measured in three-dimensional (3D) images using appropriate image analysis software. Our results showed that the average femoral cartilage volume, surface area and thickness were significantly decreased (P<0.05) in the CIA group compared to the control group. Meanwhile, these decreases were accompanied by obvious destruction of the surface of subchondral bone and a loss of trabecular bone in the CIA group. This study confirms that XPCI technology has the ability to qualitatively and quantitatively evaluate microstructural changes in mouse joints. This technique has the potential to become a routine analysis method for accurately monitoring joint damage and comprehensively assessing treatment efficacy.
Conflict of interest statement
Figures


Similar articles
-
Three-dimensional visualization and pathologic characteristics of cartilage and subchondral bone changes in the lumbar facet joint of an ovariectomized mouse model.Spine J. 2018 Apr;18(4):663-673. doi: 10.1016/j.spinee.2017.11.009. Epub 2017 Nov 15. Spine J. 2018. PMID: 29155252
-
Varying development of femoral and tibial subchondral bone tissue and their interaction with articular cartilage during progressing osteoarthritis.Arch Orthop Trauma Surg. 2020 Dec;140(12):1919-1930. doi: 10.1007/s00402-020-03480-w. Epub 2020 May 30. Arch Orthop Trauma Surg. 2020. PMID: 32474697
-
Quantitative evaluation of knee cartilage and meniscus destruction in patients with rheumatoid arthritis using T1ρ and T2 mapping.Eur J Radiol. 2017 Nov;96:91-97. doi: 10.1016/j.ejrad.2017.09.018. Epub 2017 Oct 3. Eur J Radiol. 2017. PMID: 29103482
-
Rheumatoid arthritis: follow-up and response to treatment.Eur J Radiol. 1998 May;27 Suppl 1:S25-30. doi: 10.1016/s0720-048x(98)00039-4. Eur J Radiol. 1998. PMID: 9652498 Review.
-
Structural and functional maturation of distal femoral cartilage and bone during postnatal development and growth in humans and mice.Orthop Clin North Am. 2012 Apr;43(2):173-85, v. doi: 10.1016/j.ocl.2012.01.005. Epub 2012 Feb 21. Orthop Clin North Am. 2012. PMID: 22480467 Free PMC article. Review.
Cited by
-
Application of autofluorescence robotic histology for quantitative evaluation of the 3-dimensional morphology of murine articular cartilage.Microsc Res Tech. 2017 Dec;80(12):1351-1360. doi: 10.1002/jemt.22948. Epub 2017 Sep 30. Microsc Res Tech. 2017. PMID: 28963813 Free PMC article.
-
X-ray Phase Contrast osteo-articular imaging: a pilot study on cadaveric human hands.Sci Rep. 2020 Feb 5;10(1):1911. doi: 10.1038/s41598-020-58168-3. Sci Rep. 2020. PMID: 32024864 Free PMC article.
-
Effects of low-intensity pulsed ultrasound on new trabecular bone during bone-tendon junction healing in a rabbit model: a synchrotron radiation micro-CT study.PLoS One. 2015 Apr 15;10(4):e0124724. doi: 10.1371/journal.pone.0124724. eCollection 2015. PLoS One. 2015. PMID: 25874957 Free PMC article.
-
Transection of the medial meniscus anterior horn results in cartilage degeneration and meniscus remodeling in a large animal model.J Orthop Res. 2020 Dec;38(12):2696-2708. doi: 10.1002/jor.24694. Epub 2020 Apr 23. J Orthop Res. 2020. PMID: 32285971 Free PMC article.
References
-
- Alamanos Y, Voulgari PV, Drosos AA (2008) Incidence and prevalence of psoriatic arthritis: a systematic review. J Rheumatol 35: 1354–1358. - PubMed
-
- Carmona L, Cross M, Williams B, Lassere M, March L (2010) Rheumatoid arthritis. Best Pract Res Clin Rheumatol 24: 733–745. - PubMed
-
- Smolen JS, Alletaha D, Redlich K (2012) The pathogenesis of rheumatoid arthritis: new insights from old clinical data? Nat Rev Rheumatol 8: 234–243. - PubMed
-
- Dusad A, Duryee MJ, Shaw AT, Klassen LW, Anderson DR, et al. (2014) Induction of bone loss in DBA/1J mice immunized with citrullinated autologous mouse type II collagen in the absence of adjuvant. Immunol Res 58: 51–60. - PubMed
Publication types
MeSH terms
LinkOut - more resources
Full Text Sources
Other Literature Sources
Medical

