Review
. 2014 Dec 2;53(47):7333-57.
doi: 10.1021/bi501225t. Epub 2014 Nov 18.

Hyperpolarized magnetic resonance as a sensitive detector of metabolic function

Affiliations
Review

Hyperpolarized magnetic resonance as a sensitive detector of metabolic function

Arnaud Comment et al. Biochemistry. .

Abstract

Hyperpolarized magnetic resonance allows for noninvasive measurements of biochemical reactions in vivo. Although this technique provides a unique tool for assaying enzymatic activities in intact organs, the scope of its application is still elusive for the wider scientific community. The purpose of this review is to provide key principles and parameters to guide the researcher interested in adopting this technology to address a biochemical, biomedical, or medical issue. It is presented in the form of a compendium containing the underlying essential physical concepts as well as suggestions to help assess the potential of the technique within the framework of specific research environments. Explicit examples are used to illustrate the power as well as the limitations of hyperpolarized magnetic resonance.


Figures

Figure 1
Figure 1
13C (dashed black curve) and electron (solid black curve) spin polarization at 5 T together with the electron spin longitudinal relaxation time (red curve) at 0.35 T as a function of temperature. The relaxation times for nitroxyl radicals were calculated from the fitting curved given in ref (25).
Figure 2
Figure 2
Schematic drawing of the original hyperpolarizer developed by Ardenkjaer-Larsen et al.: (1) DNP polarizer, (2) vacuum pump, (3) variable-temperature insert, (4) microwave source, (5) pressure transducer, (6) sample port, (7) microwave container, (8) sample holder, (9) sample container, and (10) dissolution wand. Reproduced with permission from ref (16). Copyright 2003 National Academy of Sciences.
Figure 3
Figure 3
Microwave spectra at 5 T and 4.2 K. Comparison between the microwave spectra measured by 13C MR in [1-13C]pyruvic acid doped with 16 mM OX063 trityl radicals (∗), UV-irradiated [1-13C]pyruvic acid (●), and a frozen 3 M sodium [1-13C]pyruvate aqueous solution doped with 50 mM TEMPO nitroxyl radicals (○). The frequency separation Δ between the central and the left or right vertical dotted lines corresponds to the 1H MR frequency at 5 T. Reproduced with permission from ref (19). Copyright 2013 National Academy of Sciences.
Figure 4
Figure 4
Sketch of the dissolution DNP setup installed at the Center for Biomedical Imaging (CIBM) of the Ecole Polytechnique Fédérale de Lausanne (EPFL). A 5 T, 1 K hyperpolarizer is located ∼4 m from a 9.4 T rodent MR scanner. A specific device minimizing the delay between the dissolution and the infusion of DNP-enhanced molecules has been implemented for in vivo applications. The delay can be as short as 3 s.
Figure 5
Figure 5
Aliphatic region of the 13C NMR spectrum acquired after injection of HP [U-2H,U-13C]glucose into yeast cell culture shown as a surface plot with time on the y-axes. Stepwise kinetics of each enzyme in glycolysis was observed.
Figure 6
Figure 6
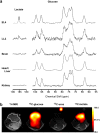
(a) Glycolytic metabolism in subcutaneously implanted xenografts of EL4 and LL2 cancer cell lines as detected with HP [U-2H,U-13C]glucose. Note the lack of lactate signal detected in normal tissues. (b) Images of glycolytic metabolism in the EL4 cancer model. Courtesy of Kevin Brindle.
Figure 7
Figure 7
Distribution of the 13C label following metabolism of [1-13C]- or [2-13C]pyruvate. Four alternate pathways for producing HP [13C]bicarbonate from [1-13C]pyruvate exist, including PDH flux, a forward turn of the TCA cycle after pyruvate carboxylation, or alternately flux through pyruvate kinase (PK) or the malic enzyme. PK acts to decarboxylate oxaloacetate as opposed to malate.
Figure 8
Figure 8
Images of porcine myocardial metabolism as imaged with HP [1-13C]pyruvate. Courtesy of A. Z. Lau and C. H. Cunningham.
Figure 9
Figure 9
(A) Model of pyruvate metabolism including compartmentalization and enzyme-catalyzed reactions. (B1) Generalized solution for the time evolution of the signals in an HP pyruvate experiment. (B2) Rx refers to a longitudinal relaxation rate for the metabolite, and kcyt = kPL + kPA + kIMkLPkAPkMI. The rate constant, k, is defined for each reaction or transport step. Abbreviations: kEI, extracellular to intracellular; kIM, intracellular to mitochondrial; kPL, pyruvate to lactate; kPA, pyruvate to alanine; kCO2, production of CO2 following PDH flux; kCB, production of bicarbonate following forward flux of CO2 through carbonic anhydrase.
Figure 10
Figure 10
(A and B) Sequential coronal T2-weighted images and corresponding 13C three-dimensional MRSI demonstrating the distribution of HP DHA and vitamin C (VitC) in a TRAMP mouse after intravenous injection of 350 μL of 15 mM HP [1-13C]DHA. The liver and kidneys are best seen in panel A, and the prostate tumor is best seen in panel B. (C) Representative 13C spectra from liver, kidney, and prostate tumor in a TRAMP mouse. (D) Axial T2-weighted image of a normal mouse with a voxel encompassing the normal prostate. (E) Summary of average metabolite ratios [VitC/(VitC + DHA)] for normal liver, kidneys, and prostate (n = 5), as well as TRAMP tumor and surrounding benign tissue (surround) (n = 4). Reproduced with permission from ref (153). Copyright 2011 National Academy of Sciences.
Figure 11
Figure 11
Schematic representation of the enzymatically catalyzed DHA reduction processes. The cofactor NADPH is involved either directly (A) or via a thiol cycle (B). The most prominent thiol cycle couples the reduction of DHA to the oxidation of glutathione, the recycling (reduction) of which involves the oxidation of NADPH. Abbreviations: DHAR, dehydroascorbate reductase; GR, glutathione reductase.
Figure 12
Figure 12
Schematic representation of the transamination and transamidation reactions involving glutamate. Abbreviations: GLS, glutaminase; ATR, aminotransferase; GDH, glutamate dehydrogenase.
Figure 13
Figure 13
Imaging of BCAT activity in vivo. The anatomical 1H image of an EL4 mouse is shown at the top left. Chemical shift images of [1-13C]leucine and [1-13C]KIC after injection of HP [1-13C]KIC are overlaid onto the anatomical image. The tumor position is indicated by a dashed line. [1-13C]Leucine is specifically observed inside the tumor. One-dimensional 13C spectra for volume elements of the tumor and intestine (blue and red dots) demonstrate the difference in the [1-13C]leucine signal between the tumor and surrounding tissue. The position of the surface coil is indicated by the two white dots at the top left. Reproduced with permission from ref (170). Copyright 2009 UICC.
Figure 14
Figure 14
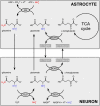
Schematic representation of the KIC/leucine BCAA cycle along with the coupled glutamine/glutamate cycle active between astrocytes and neurons. To transfer nitrogen from a neuron to an astrocyte, the amino group can be fixed to KIC to form leucine. Abbreviations: GS, glutamine synthetase; BCATm, mitochondrial branched-chain aminotransferase; BCATc, cytosolic branched-chain aminotransferase; GLS, glutaminase; GDH, glutamate dehydrogenase. To effectively move the NH4+ from a neuron to an astrocyte, the latter has to be fixed to α-ketoglutarate by mitochondrial GDH.
Figure 15
Figure 15
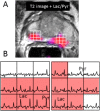
Results from the first in vivo human experiments using HP [1-13C]pyruvate. A CSI sequence identified regions of increased lactate production in prostate cancer that was independently confirmed by biopsy.

Similar articles

Cited by

References

    1. Gruetter R.; Novotny E. J.; Boulware S. D.; Mason G. F.; Rothman D. L.; Shulman G. I.; Prichard J. W.; Shulman R. G. (1994) Localized C-13 Nmr-Spectroscopy in the Human Brain of Amino-Acid Labeling from d-[1-C-13]Glucose. J. Neurochem. 63, 1377–1385. - PubMed
    1. Gruetter R.; Seaquist E. R.; Kim S.; Ugurbil K. (1998) Localized in vivo C-13-NMR of glutamate metabolism in the human brain: Initial results at 4 T. Dev. Neurosci. (Basel, Switz.) 20, 380–388. - PubMed
    1. Maher E. A.; Marin-Valencia I.; Bachoo R. M.; Mashimo T.; Raisanen J.; Hatanpaa K. J.; Jindal A.; Jeffrey F. M.; Choi C. H.; Madden C.; Mathews D.; Pascual J. M.; Mickey B. E.; Malloy C. R.; DeBerardinis R. J. (2012) Metabolism of [U-13C]glucose in human brain tumors in vivo. NMR Biomed. 25, 1234–1244. - PMC - PubMed
    1. Shulman R. G.; Rothman D. L. (2001) 13C NMR of intermediary metabolism: Implications for systemic physiology. Annu. Rev. Physiol. 63, 15–48. - PubMed
    1. van de Ven K. C. C.; de Galan B. E.; van der Graaf M.; Shestov A. A.; Henry P. G.; Tack C. J. J.; Heerschap A. (2011) Effect of Acute Hypoglycemia on Human Cerebral Glucose Metabolism Measured by C-13 Magnetic Resonance Spectroscopy. Diabetes 60, 1467–1473. - PMC - PubMed

Publication types