The preventability of ventilator-associated events. The CDC Prevention Epicenters Wake Up and Breathe Collaborative
- PMID: 25369558
- PMCID: PMC5447286
- DOI: 10.1164/rccm.201407-1394OC
The preventability of ventilator-associated events. The CDC Prevention Epicenters Wake Up and Breathe Collaborative
Abstract
Rationale: The CDC introduced ventilator-associated event (VAE) definitions in January 2013. Little is known about VAE prevention. We hypothesized that daily, coordinated spontaneous awakening trials (SATs) and spontaneous breathing trials (SBTs) might prevent VAEs.
Objectives: To assess the preventability of VAEs.
Methods: We nested a multicenter quality improvement collaborative within a prospective study of VAE surveillance among 20 intensive care units between November 2011 and May 2013. Twelve units joined the collaborative and implemented an opt-out protocol for nurses and respiratory therapists to perform paired daily SATs and SBTs. The remaining eight units conducted surveillance alone. We measured temporal trends in VAEs using generalized mixed effects regression models adjusted for patient-level unit, age, sex, reason for intubation, Sequential Organ Failure Assessment score, and comorbidity index.
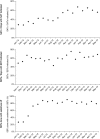
Measurements and main results: We tracked 5,164 consecutive episodes of mechanical ventilation: 3,425 in collaborative units and 1,739 in surveillance-only units. Within collaborative units, significant increases in SATs, SBTs, and percentage of SBTs performed without sedation were mirrored by significant decreases in duration of mechanical ventilation and hospital length-of-stay. There was no change in VAE risk per ventilator day but significant decreases in VAE risk per episode of mechanical ventilation (odds ratio [OR], 0.63; 95% confidence interval [CI], 0.42-0.97) and infection-related ventilator-associated complications (OR, 0.35; 95% CI, 0.17-0.71) but not pneumonias (OR, 0.51; 95% CI, 0.19-1.3). Within surveillance-only units, there were no significant changes in SAT, SBT, or VAE rates.
Conclusions: Enhanced performance of paired, daily SATs and SBTs is associated with lower VAE rates. Clinical trial registered with www.clinicaltrials.gov (NCT 01583413).
Trial registration: ClinicalTrials.gov NCT01583413.
Keywords: quality improvement; surveillance; ventilator-associated events.
Figures


Comment in
-
An old world's view on a new world's solution.Am J Respir Crit Care Med. 2015 Feb 1;191(3):243-5. doi: 10.1164/rccm.201411-2049ED. Am J Respir Crit Care Med. 2015. PMID: 25635484 No abstract available.
References
-
- Klein Klouwenberg PM, Ong DS, Bos LD, de Beer FM, van Hooijdonk RT, Huson MA, Straat M, van Vught LA, Wieske L, Horn J, et al. Interobserver agreement of Centers for Disease Control and Prevention criteria for classifying infections in critically ill patients. Crit Care Med. 2013;41:2373–2378. - PubMed
-
- Stevens JP, Kachniarz B, Wright SB, Gillis J, Talmor D, Clardy P, Howell MD. When policy gets it right: variability in U.S. Hospitals’ diagnosis of ventilator-associated pneumonia. Crit Care Med. 2014;42:497–503. - PubMed
-
- Melsen WG, Rovers MM, Groenwold RH, Bergmans DC, Camus C, Bauer TT, Hanisch EW, Klarin B, Koeman M, Krueger WA, et al. Attributable mortality of ventilator-associated pneumonia: a meta-analysis of individual patient data from randomised prevention studies. Lancet Infect Dis. 2013;13:665–671. - PubMed
-
- Klompas M. Complications of mechanical ventilation—the CDC’s new surveillance paradigm. N Engl J Med. 2013;368:1472–1475. - PubMed
Publication types
MeSH terms
Associated data
Grants and funding
LinkOut - more resources
Full Text Sources
Medical
Research Materials

