. 2014 Nov 4:3:e02999.
doi: 10.7554/eLife.02999.

Identification of 'erasers' for lysine crotonylated histone marks using a chemical proteomics approach

Affiliations

Identification of 'erasers' for lysine crotonylated histone marks using a chemical proteomics approach

Xiucong Bao et al. Elife. .

Abstract

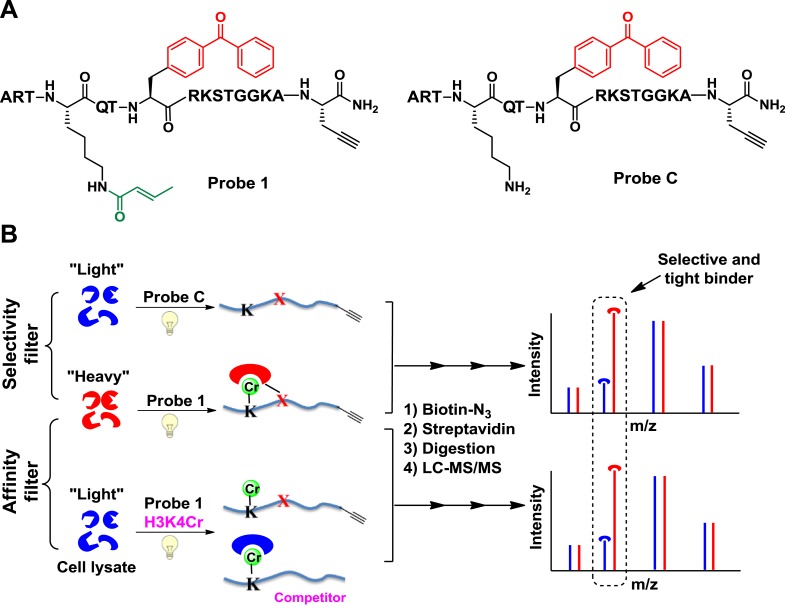
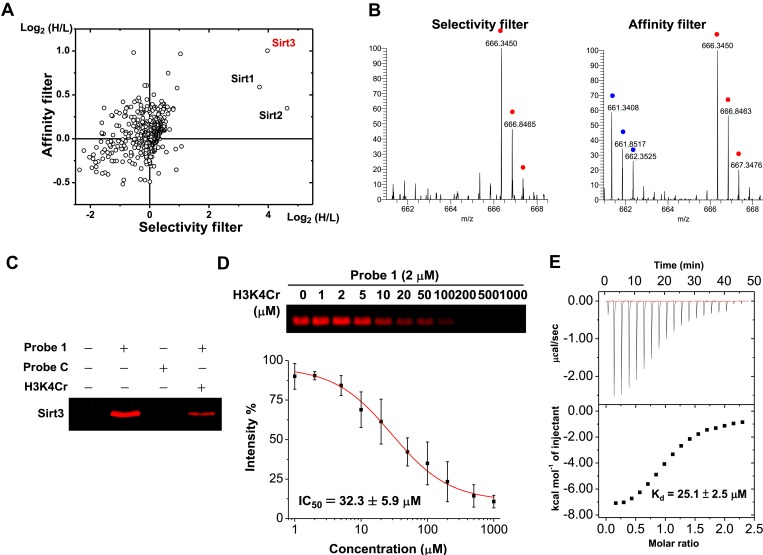
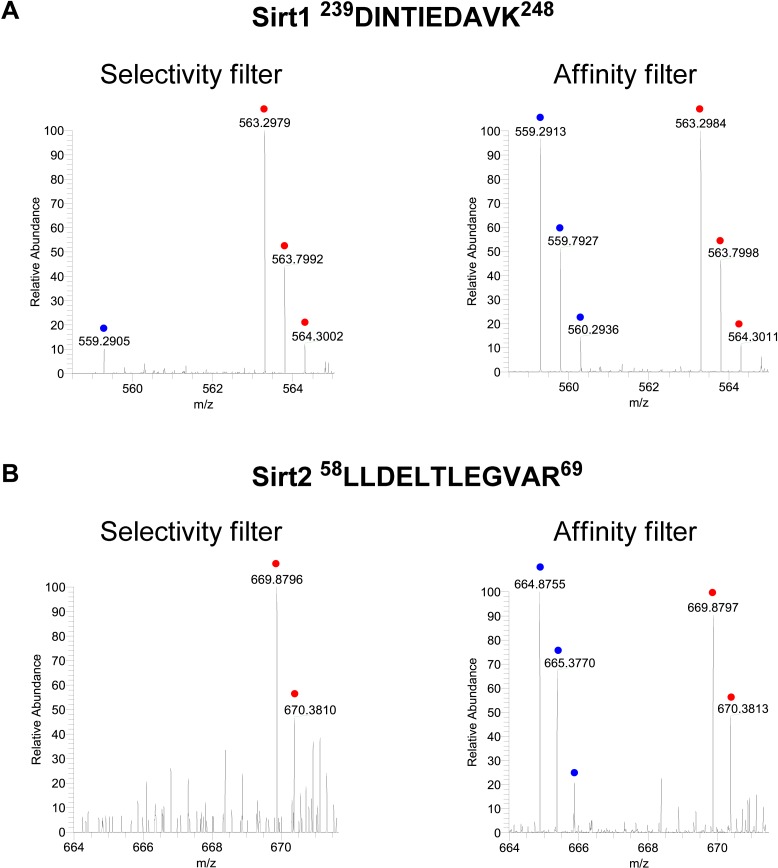
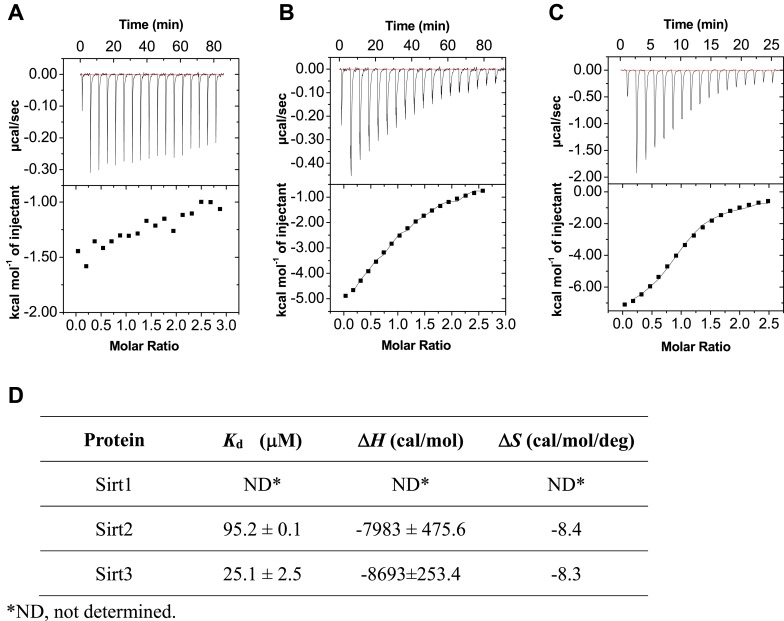
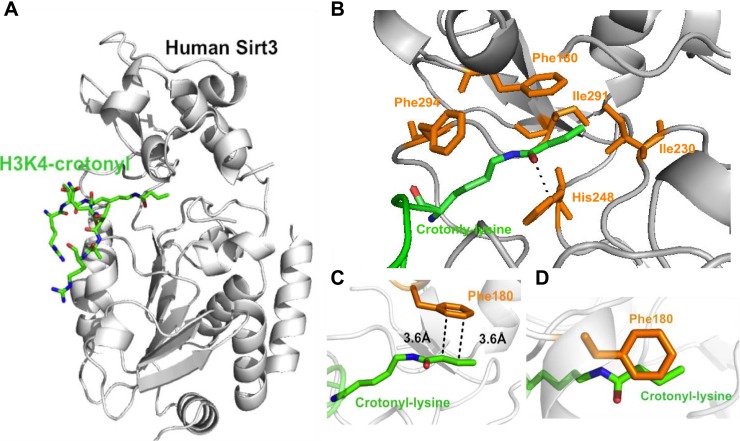
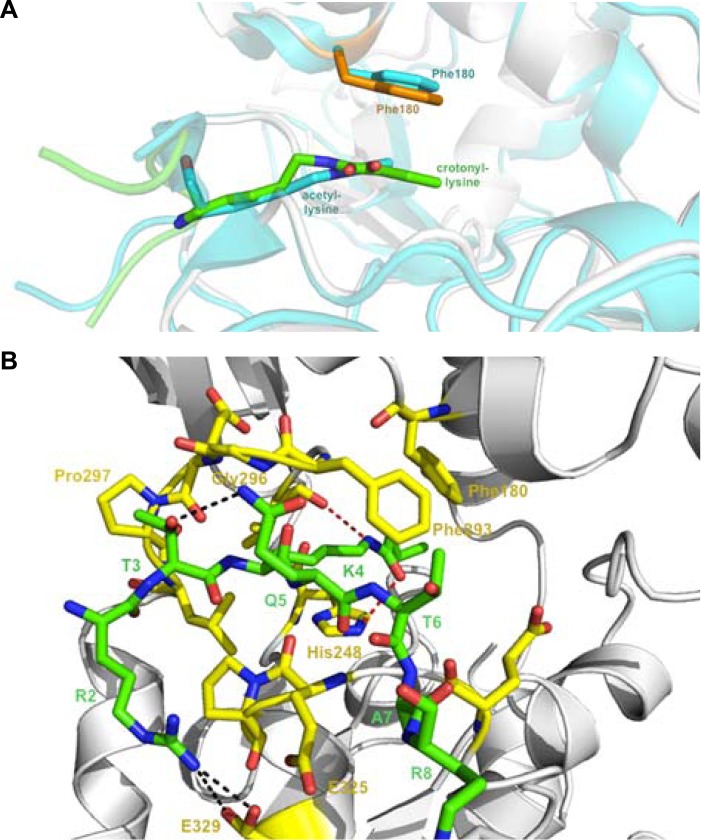
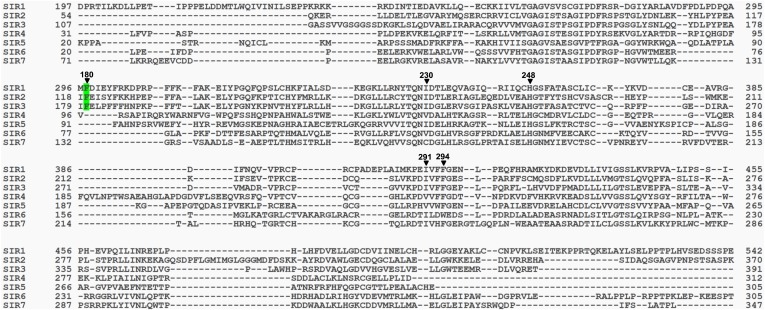
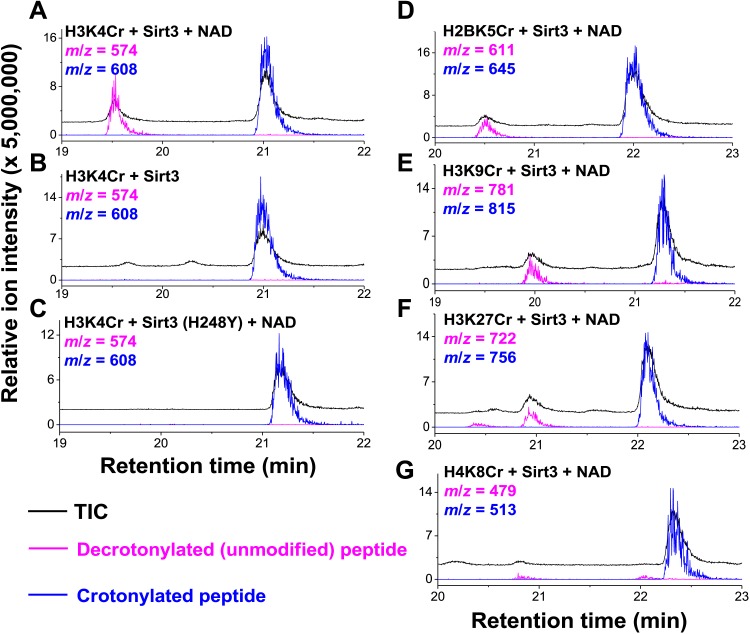
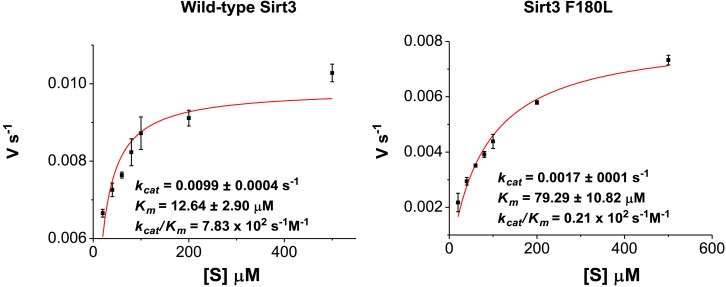
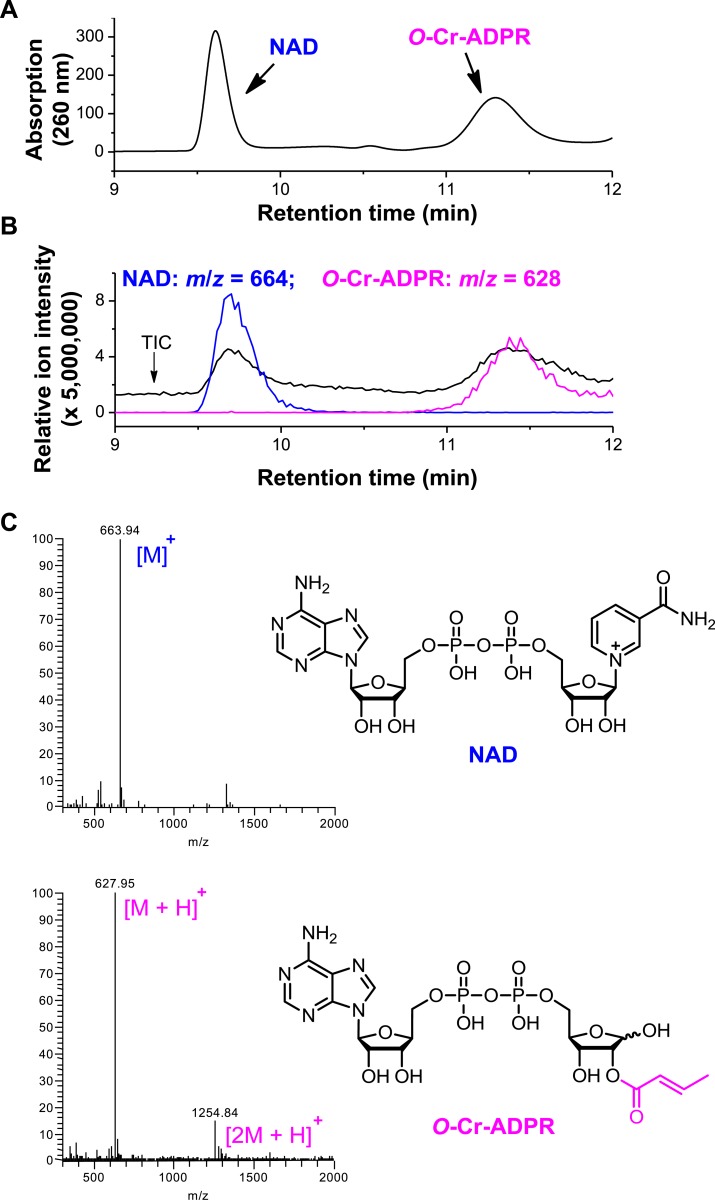
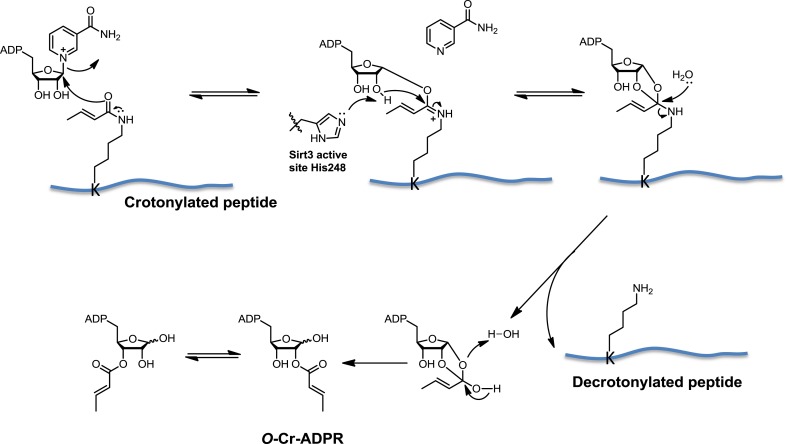
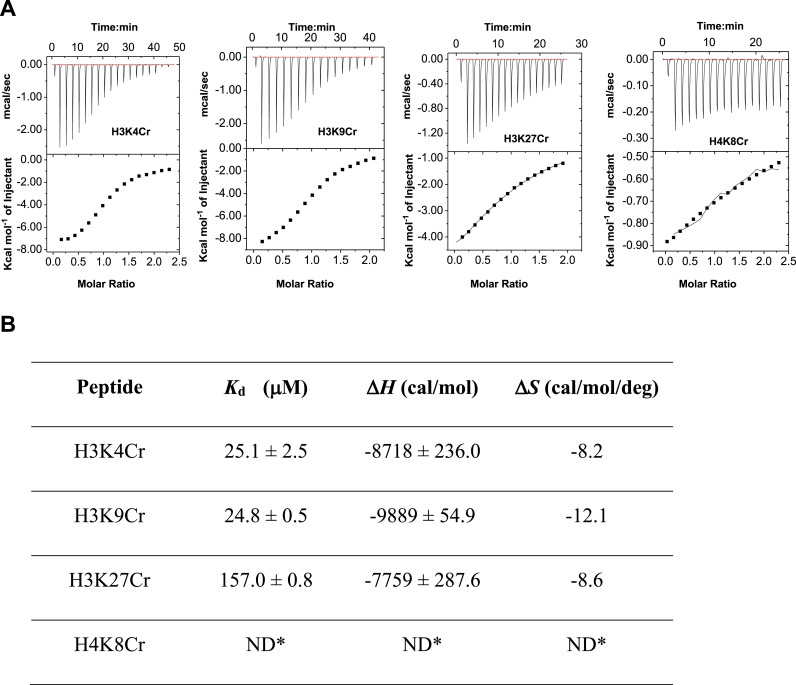
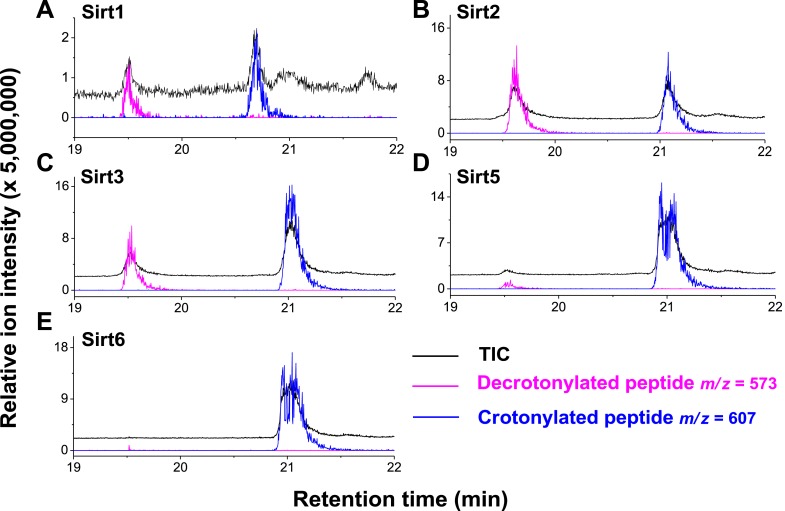
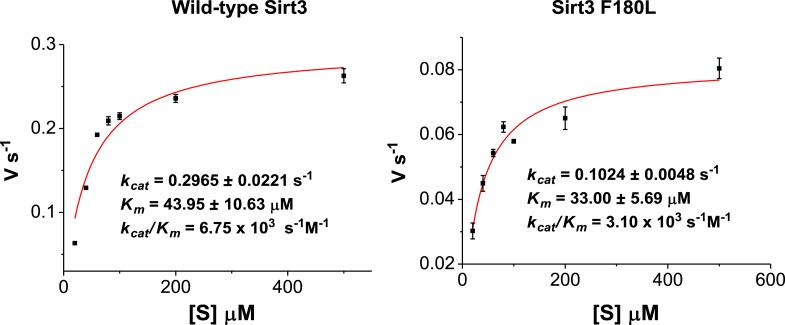
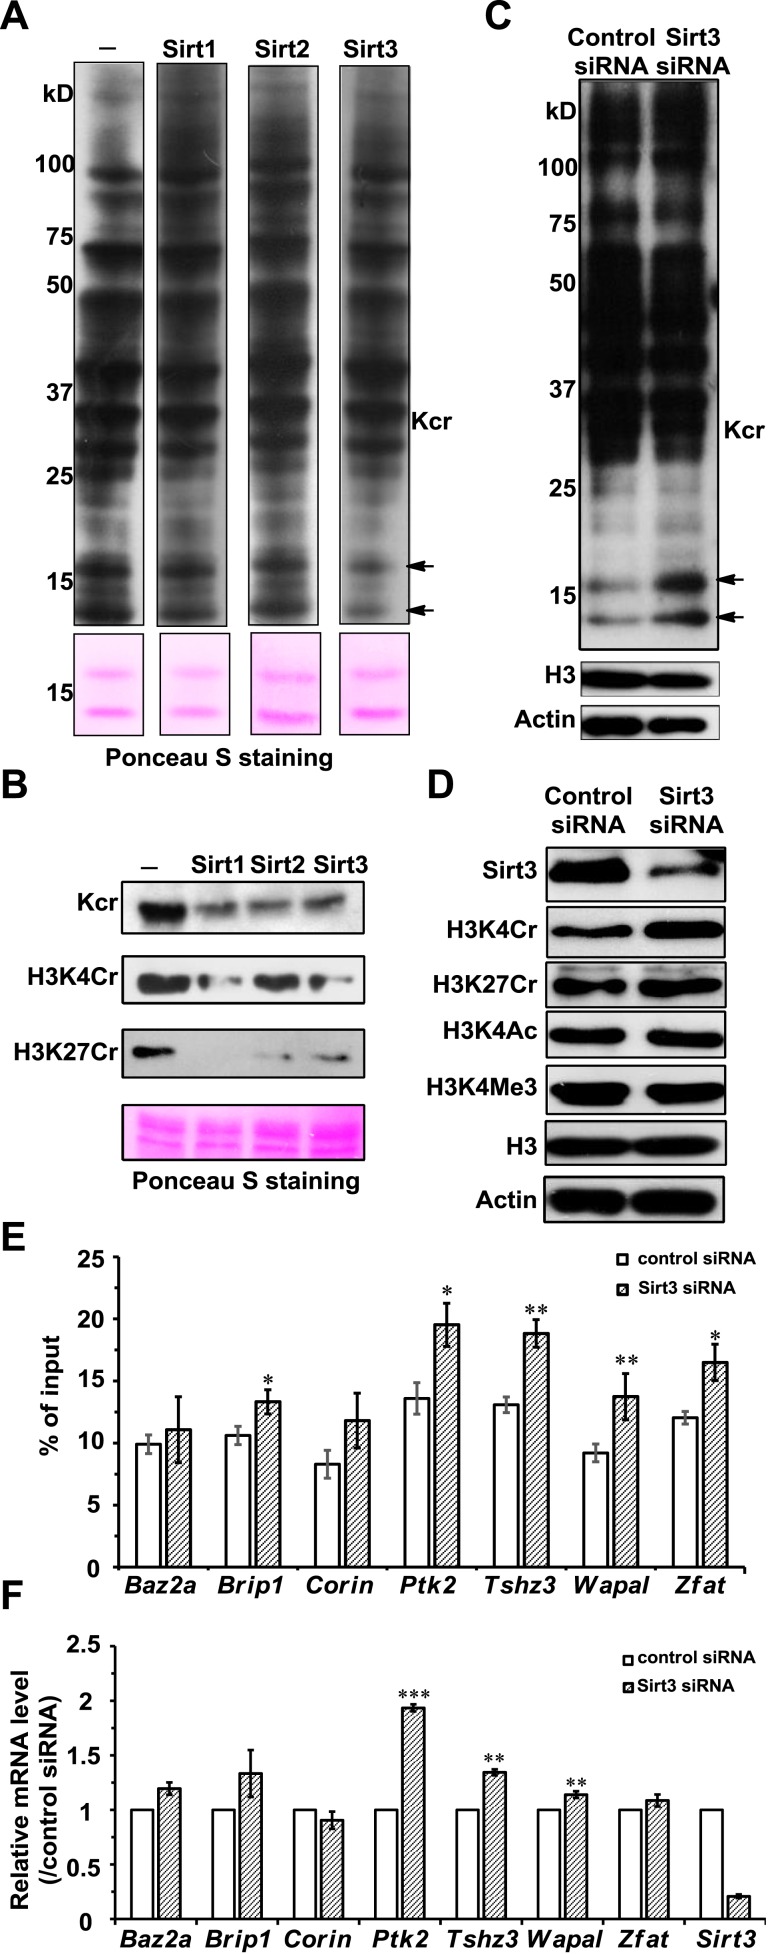
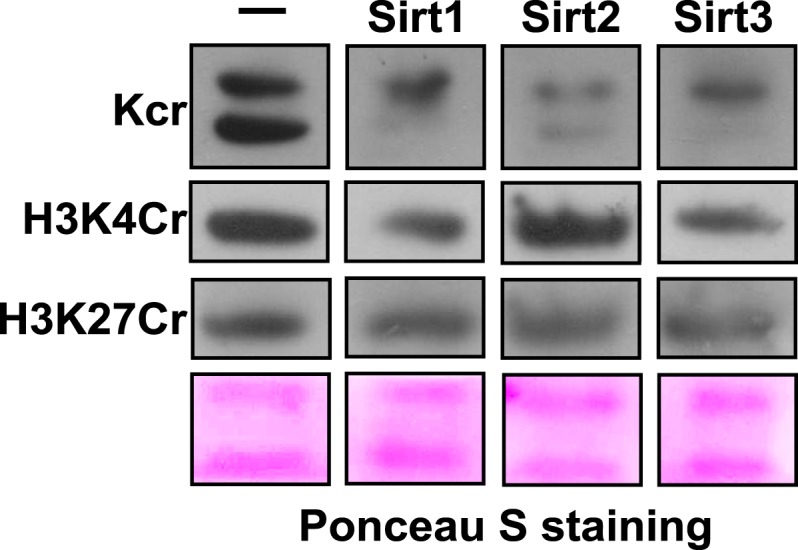
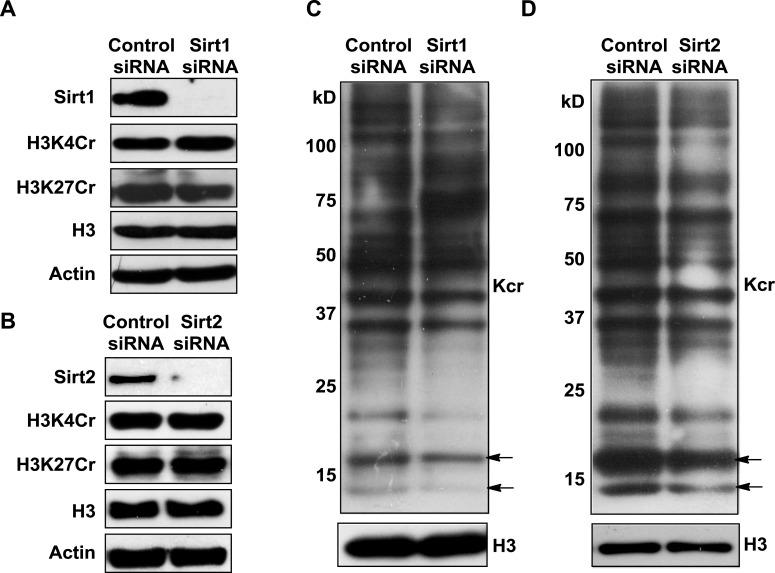
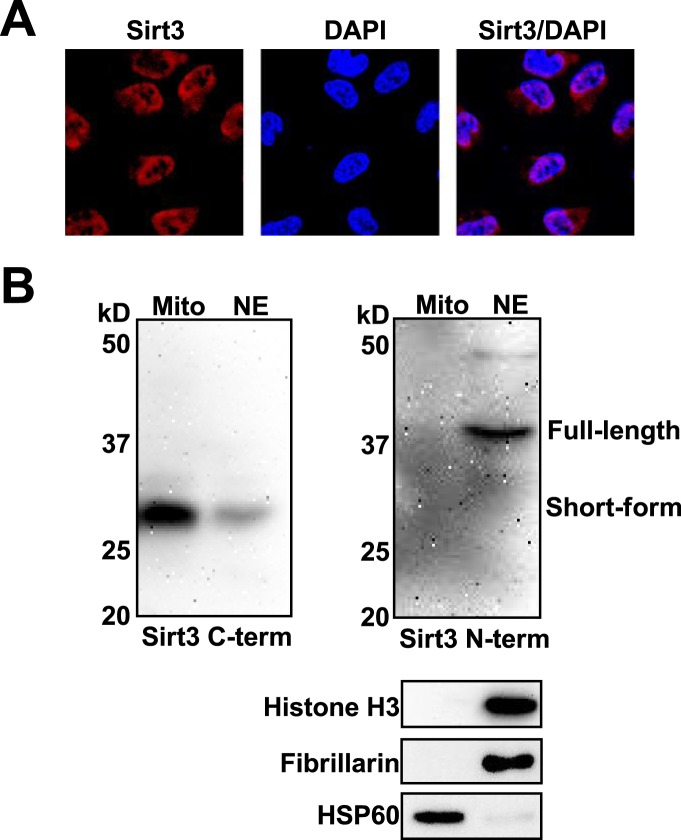
Posttranslational modifications (PTMs) play a crucial role in a wide range of biological processes. Lysine crotonylation (Kcr) is a newly discovered histone PTM that is enriched at active gene promoters and potential enhancers in mammalian cell genomes. However, the cellular enzymes that regulate the addition and removal of Kcr are unknown, which has hindered further investigation of its cellular functions. Here we used a chemical proteomics approach to comprehensively profile 'eraser' enzymes that recognize a lysine-4 crotonylated histone H3 (H3K4Cr) mark. We found that Sirt1, Sirt2, and Sirt3 can catalyze the hydrolysis of lysine crotonylated histone peptides and proteins. More importantly, Sirt3 functions as a decrotonylase to regulate histone Kcr dynamics and gene transcription in living cells. This discovery not only opens opportunities for examining the physiological significance of histone Kcr, but also helps to unravel the unknown cellular mechanisms controlled by Sirt3, that have previously been considered solely as a deacetylase.

Keywords: E. coli; biochemistry; chemical proteomics; crotonylation; posttranslational modification.


Conflict of interest statement

The authors declare that no competing interests exist.

Figures

Figure 1.
Figure 1.. Cross-Linking Assisted and SILAC based Protein Identification (CLASPI) strategy.
(A) Chemical structures of probe 1 and probe C. (B) Schematic diagram illustrating the CLASPI strategy to profile proteins that bind H3K4Cr with high selectivity and affinity in whole-cell proteomes. LC-MS, liquid chromatography–mass spectrometry. DOI: http://dx.doi.org/10.7554/eLife.02999.003
Figure 2.
Figure 2.. Identification of Sirt3 as a selective and tight binding partner of lysine-4 crotonylated histone H3.
(A) A two-dimensional plot showing the Log2 values of the stable isotope labeling of amino acids in cell culture (SILAC) ratios (heavy/light (H/L)) of each identified protein for the ‘selectivity filter’ (x axis) and ‘affinity filter’ (y axis) experiments. (B) Representative mass spectrometry (MS) spectra of a peptide, 225LYTQNIDGLER235, from Sirt3 identified in both the ‘selectivity filter’ and ‘affinity filter’ experiments. The ‘light’ and ‘heavy’ peptide isotopes are indicated by blue and red dots, respectively. (C) Recombinant Sirt3 was selectively labeled in vitro by crotonylated probe 1 (2 μM) and the labeling by probe 1 was inhibited by a H3K4Cr peptide (30 μM). (D) Determination of IC50 for inhibition of probe 1 induced labeling of Sirt3 by H3K4Cr peptide (n=3, mean±s.e.). (E) Isothermal titration calorimetry measurement for the binding affinity of Sirt3 towards the H3K4Cr peptide. DOI: http://dx.doi.org/10.7554/eLife.02999.004
Figure 2—figure supplement 1.
Figure 2—figure supplement 1.. Representative mass spectrometry spectra for peptides from Sirt1 and Sirt2.
Representative mass spectrometry spectra for peptides from Sirt1 (A) and Sirt2 (B), identified in both ‘selectivity filter’ and ‘affinity filter’ Cross Linking Assisted and SILAC based Protein Identification (CLASPI) experiments. The ‘light’ and ‘heavy’ peptide isotopes are indicated by blue and red dots, respectively. DOI: http://dx.doi.org/10.7554/eLife.02999.006
Figure 2—figure supplement 2.
Figure 2—figure supplement 2.. ITC measurement for the binding affinity of Sirt1-3 toward H3K4Cr peptide.
(AC) Isothermal titration calorimetry measurement for the binding affinities of Sirt1 (A), Sirt2 (B), and Sirt3 (C) towards H3K4Cr. (D) A summary of the dissociation constants (Kd), enthalpy changes (ΔH), and andentropy changes (ΔS) of Sirt1, Sirt2, and Sirt3 binding to H3K4Cr. DOI: http://dx.doi.org/10.7554/eLife.02999.007
Figure 3.
Figure 3.. Structural basis for how Sirt3 recognizes lysine crotonylation.
(A) Overall structure of the complex of Sirt3 (gray) with H3K4Cr peptide (green). (B) The binding pocket formed by hydrophobic residues (orange) that accommodate the crotonyl lysine. A side view (C) and top view (D) of a π-π stacking interaction between residue Phe180 of Sirt3 and the crotonyl group. DOI: http://dx.doi.org/10.7554/eLife.02999.008
Figure 3—figure supplement 1.
Figure 3—figure supplement 1.. Detailed structural analysis for Sirt3 in complex with H3K4Cr peptide.
(A) Structural alignment between the Sirt3–AceCS2 complex colored in cyan (PDB 3GLR) and the Sirt3–H3K4Cr complex colored in orange. (B) Interactions between Sirt3 and H3K4Cr peptide. The residues of Sirt3 are colored in yellow and H3K4Cr peptide is colored in green. DOI: http://dx.doi.org/10.7554/eLife.02999.009
Figure 3—figure supplement 2.
Figure 3—figure supplement 2.. Sequence alignment of human Sirt1–Sirt7.
The included sequences are Sirt1-197-542 (full length, 747 amino acids (a.a.)), Sirt2-54-370 (389 a.a.), Sirt3-107-391 (399 a.a.), Sirt4-31-312 (314 a.a.), Sirt5-20-305 (310 a.a.), Sirt6-20-305 (355 a.a.), and Sirt7-71-347 (400 a.a.). The residues of Sirt3 that interact with crotonyl lysine in the crystal structure of the Sirt3–H3K4Cr complex are indicated (▼) above the residues and labeled with the Sirt3 sequence number. Highlighted in green is the Phe180 of Sirt3, which is involved in recognition of the crotonyl lysine via a π−π stacking interaction, and is conserved in Sirt1 and Sirt2, but not in the other sirtuins. The alignment was done by T-coffee (Notredame C, Higgins DG, and Heringa, J. 2000, Journal of Molecular Biology 302, 205–17). DOI: http://dx.doi.org/10.7554/eLife.02999.010
Figure 4.
Figure 4.. Sirt3 catalyzes the hydrolysis of crotonyl lysine in vitro.
(AC) The hydrolysis of the crotonylated peptides by Sirt3 was analyzed by liquid chromatography–mass spectrometry. The hydrolysis of H3K4Cr was observed with Sirt3 in the presence (A), but not absence of nicotinamide adenine dinucleotide (NAD) (B), or with the mutated Sirt3, H248Y (C). (DG) Sirt3 showed varied decrotonylation activities towards H2BK5Cr (D), H3K9Cr (E), H3K27Cr (F), and H4K8Cr (G) peptides. Black traces show total ion intensity for all ion species with m/z from 300 to 2000 (i.e., total ion counts, TIC); pink traces show ion intensity (5× magnified) for the masses of decrotonylated (unmodified) peptides; and blue traces show ion intensity (5× magnified) for the masses of crotonylated peptides. DOI: http://dx.doi.org/10.7554/eLife.02999.011
Figure 4—figure supplement 1.
Figure 4—figure supplement 1.. Michaelis–Menten plots showing the kinetics of Sirt3 and mutant Sirt3 (F180L) decrotonylation on H3K4Cr.
The enzyme concentrations and reaction times were used as indicated in ‘Materials and methods’. For kinetic parameters, values are reported as mean ± s.e. (n=3). DOI: http://dx.doi.org/10.7554/eLife.02999.012
Figure 4—figure supplement 2.
Figure 4—figure supplement 2.. Detection of O-crotonyl-adenosine 5ʹ-diphosphoribose (O-Cr-ADPR) by liquid chromatography–mass spectrometry (LC-MS).
The reaction mixture of Sirt3 catalyzed nicotinamide adenine dinucleotide (NAD) dependent decrotonylation of H3K4Cr peptide was analyzed by LC-MS. Partial chromatogram of the reaction mixture with UV (260 nm) (A) and mass detector (B). In (B), the black trace shows total ion intensity for all ion species with m/z from 300 to 2000 (i.e., total ion counts, TIC); blue trace shows ion intensity (5× magnified) for the mass of NAD (m/z = 664); and pink trace shows ion intensity (5× magnified) for the mass of O-Cr-ADPR (m/z = 628). (C) ESI-MS spectra of NAD and O-Cr-ADPR. DOI: http://dx.doi.org/10.7554/eLife.02999.013
Figure 4—figure supplement 3.
Figure 4—figure supplement 3.. Proposed mechanism of Sirt3 catalyzed nicotinamide adenine dinucleotide dependent decrotonylation.
DOI: http://dx.doi.org/10.7554/eLife.02999.014
Figure 4—figure supplement 4.
Figure 4—figure supplement 4.. ITC measurement for the binding affinity of Sirt3 toward crotonylated histone peptides.
(A) Isothermal titration calorimetry measurement for the binding affinities of Sirt3 towards H3K4Cr, H3K9Cr, H3K27Cr, and H4K8Cr. (B) A summary of dissociation constants (Kd), enthalpy changes (ΔH), and entropy changes (ΔS) of Sirt3 for the crotonylated peptides. DOI: http://dx.doi.org/10.7554/eLife.02999.015
Figure 4—figure supplement 5.
Figure 4—figure supplement 5.. Decrotonylation activity of sirtuins in vitro. The hydrolysis of the H3K4Cr peptide by sirtuins was analyzed by liquid chromatography–mass spectrometry.
(AC) Sirt1, Sirt2, and Sirt3 showed significant decrotonylation activities towards H3K4Cr. (D, E) Sirt5 and Sirt6 showed little decrotonylation activities towards H3K4Cr. Black traces show total ion intensity for all ion species with m/z from 300 to 2000 (i.e., total ion counts, TIC); pink traces show ion intensity (5× magnified) for masses of decrotonylated (unmodified) peptides; and blue traces show ion intensity (5× magnified) for masses of crotonylated peptides. DOI: http://dx.doi.org/10.7554/eLife.02999.016
Figure 4—figure supplement 6.
Figure 4—figure supplement 6.. Michaelis–Menten plots showing the kinetics of Sirt3 and mutant Sirt3 (F180L) deacetylation on H3K4Ac.
The enzyme concentrations and reaction times were used as indicated in ‘Materials and methods’. For kinetic parameters, values are reported as mean ± s.e. (n=3). DOI: http://dx.doi.org/10.7554/eLife.02999.017
Figure 5.
Figure 5.. Sirt3 regulates histone lysine crotonylation and gene expression.
(A) Western blot analyses showing Sirt1–3 catalyzed decrotonylation of whole-cell lysates on the membrane. The arrows indicate the protein bands with reduction of crotonylation levels. Ponceau S staining was used as the loading control. (B) Western blot analyses showing the decrotonylation of purified histones catalyzed by Sirt1–3 in the reaction buffer. Ponceau S staining was used as the loading control. (C) Western blot analyses showing that Sirt3 knockdown caused the accumulations of H3K4Cr without effect on H3K4Ac, H3K4Me3, or H3K27Cr levels. (D) Western blot analyses showing that Sirt3 knockdown caused global histone crotonylation (as indicated by the arrows). H3 and actin were used as loading controls. (E) Chromatin immunoprecipitation–quantitative PCR analyses showing the changes in the histone Kcr levels of the indicated chromatin loci on Sirt3 knockdown. Quantitative PCR signal was normalized by a non-Sirt3 bound region of Gapdh. (F) Real time PCR analyses showing the changes in mRNA level of the indicated genes on Sirt3 knockdown. Quantitative PCR signal was normalized by Gapdh. Error bars indicated ± s.e. from four (E) or three (F) independent biological replicates. The p values are based on the Student's t test. *p<0.05, **p <0.01, ***p <0.001. DOI: http://dx.doi.org/10.7554/eLife.02999.018
Figure 5—figure supplement 1.
Figure 5—figure supplement 1.. Western blot analyses showing Sirt1-3 catalyzed decrotonylation of extracted histones on membrane.
Ponceau S staining was used as the loading control. DOI: http://dx.doi.org/10.7554/eLife.02999.019
Figure 5—figure supplement 2.
Figure 5—figure supplement 2.. Analysis of the decrotonylation activities of Sirt1 and Sirt2 in cells.
(A, B) Western blot analyses showing the influence of Sirt1 (A) or Sirt2 (B) knockdown on H3K4Cr and H3K27Cr levels in HeLa cells. (C, D) Western blot analyses showing that Sirt1 (C) or Sirt2 (B) knockdown did not cause an increase in global histone crotonylation levels (as indicated by the arrows). H3 and actin were used as loading controls. DOI: http://dx.doi.org/10.7554/eLife.02999.020
Figure 5—figure supplement 3.
Figure 5—figure supplement 3.. Subcellular locolization of Sirt3.
(A) Analysis of Sirt3 distribution in HeLa cells by fluorescence microscopy using anti-Sirt3 N-term antibody. Blue channel: DAPI. Red channel: Sirt3. (B) Western blot analyses showing the nuclear localization of endogenous Sirt3 using both anti-Sirt3 C-term and N-term antibodies. Western blot analyses of fibrillarin/histone H3 and HSP60 were used to show the purity of nuclear (NE) and mitochondrial extraction (Mito), respectively. DOI: http://dx.doi.org/10.7554/eLife.02999.021

References

    1. Allfrey VG, Faulkner R, Mirsky AE. Acetylation and methylation of histones and their possible role in the regulation of Rna synthesis. Proceedings of the National Academy of Sciences of USA. 1964;51:786–794. doi: 10.1073/pnas.51.5.786. - DOI - PMC - PubMed
    1. Allfrey VG, Mirsky AE. Structural modifications of histones and their possible role in the regulation of RNA synthesis. Science. 1964;144:559. doi: 10.1126/science.144.3618.559. - DOI - PubMed
    1. Avalos JL, Boeke JD, Wolberger C. Structural basis for the mechanism and regulation of Sir2 enzymes. Molecular Cell. 2004;13:639–648. doi: 10.1016/S1097-2765(04)00082-6. - DOI - PubMed
    1. Collaborative Computational Project, Number 4 The CCP4 suite: programs for protein crystallography. Acta Crystallographica Section D, Biological Crystallography. 1994;50:760–763. doi: 10.1107/S0907444994003112. - DOI - PubMed
    1. Dhalluin C, Carlson JE, Zeng L, He C, Aggarwal AK, Zhou MM. Structure and ligand of a histone acetyltransferase bromodomain. Nature. 1999;399:491–496. doi: 10.1038/20974. - DOI - PubMed

Publication types

MeSH terms