. 2014 Nov 5:5:5126.
doi: 10.1038/ncomms6126.

Regulation of the NaV1.5 cytoplasmic domain by calmodulin

Affiliations

Regulation of the NaV1.5 cytoplasmic domain by calmodulin

Sandra B Gabelli et al. Nat Commun. .

Abstract

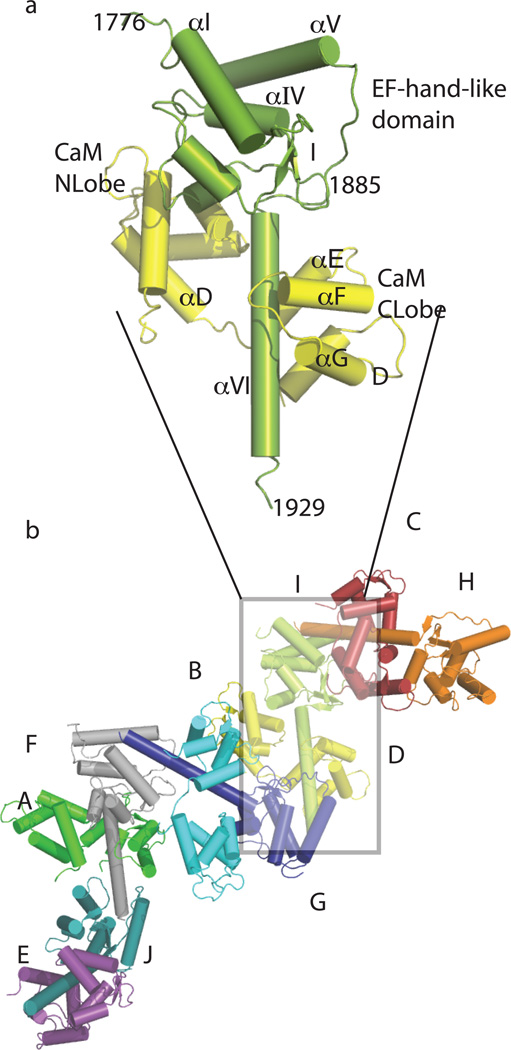
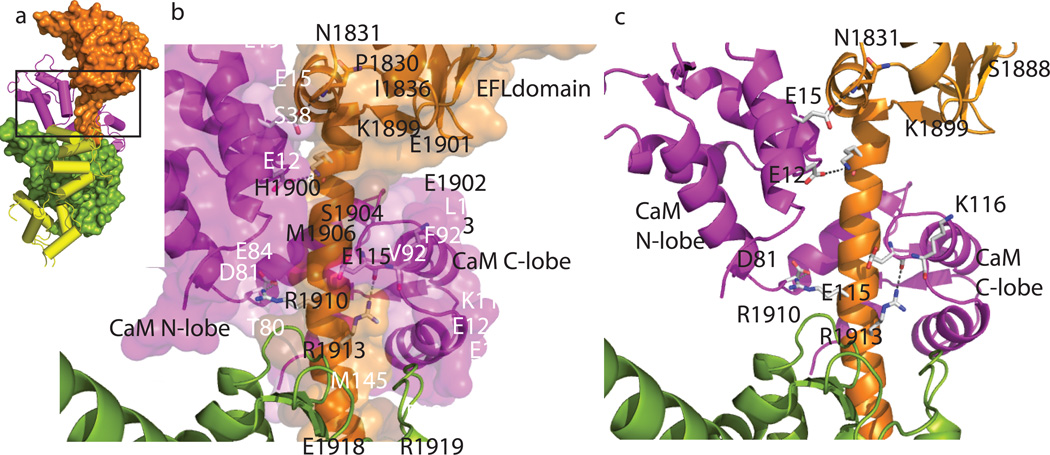
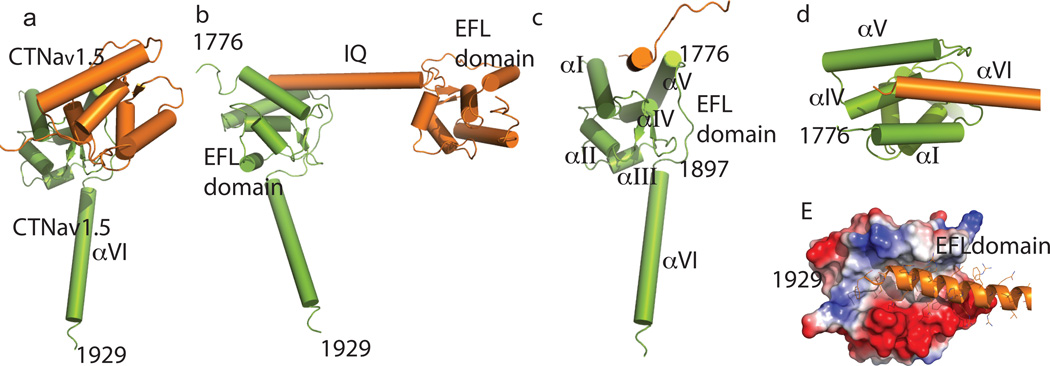
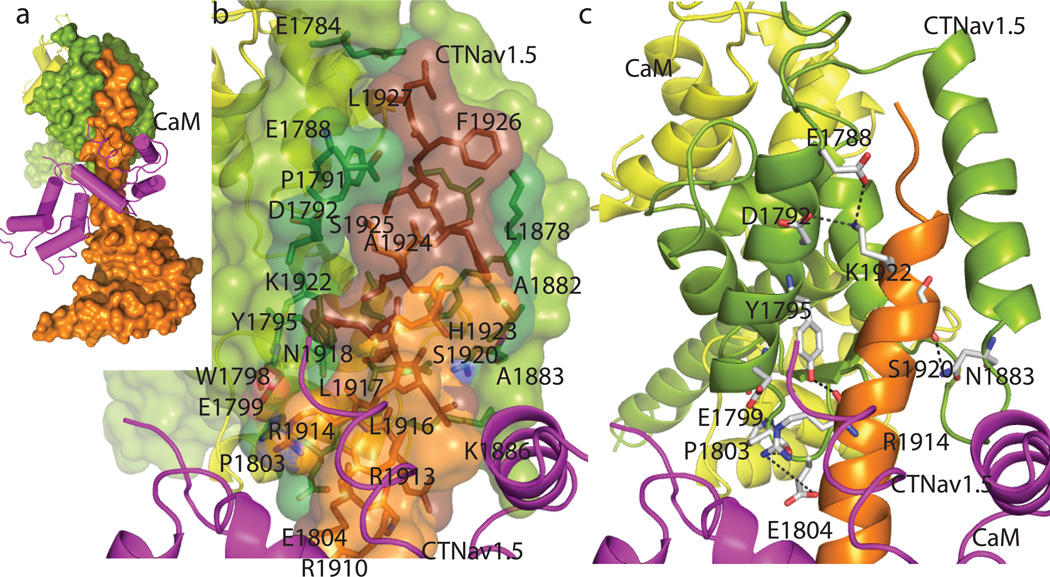
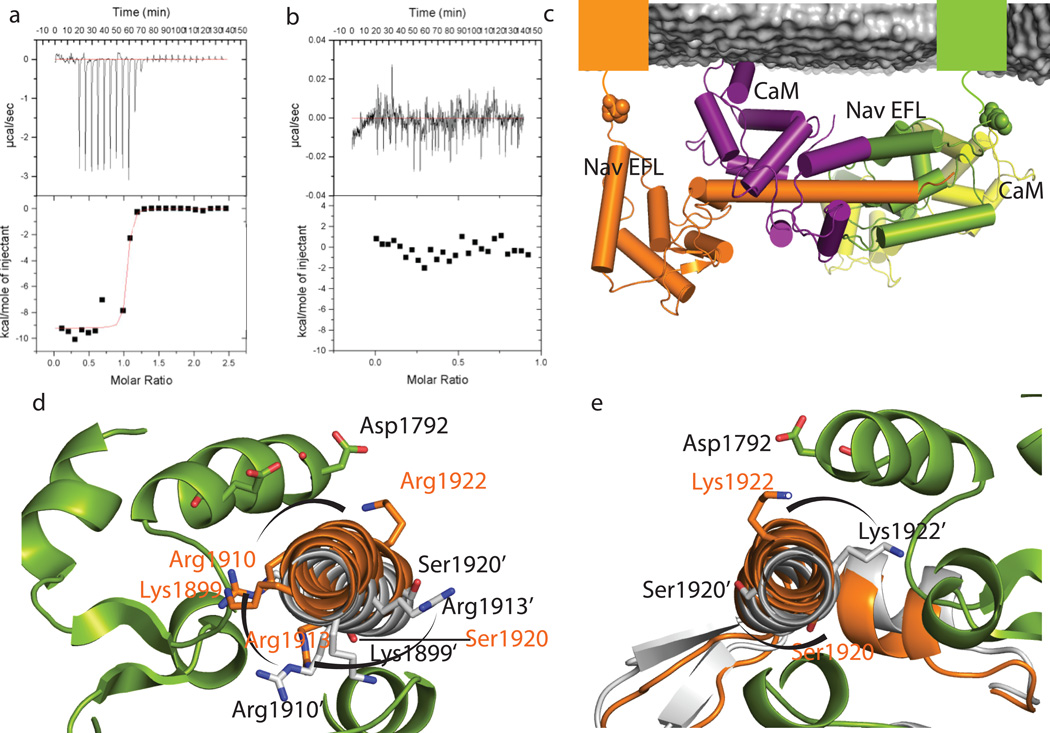
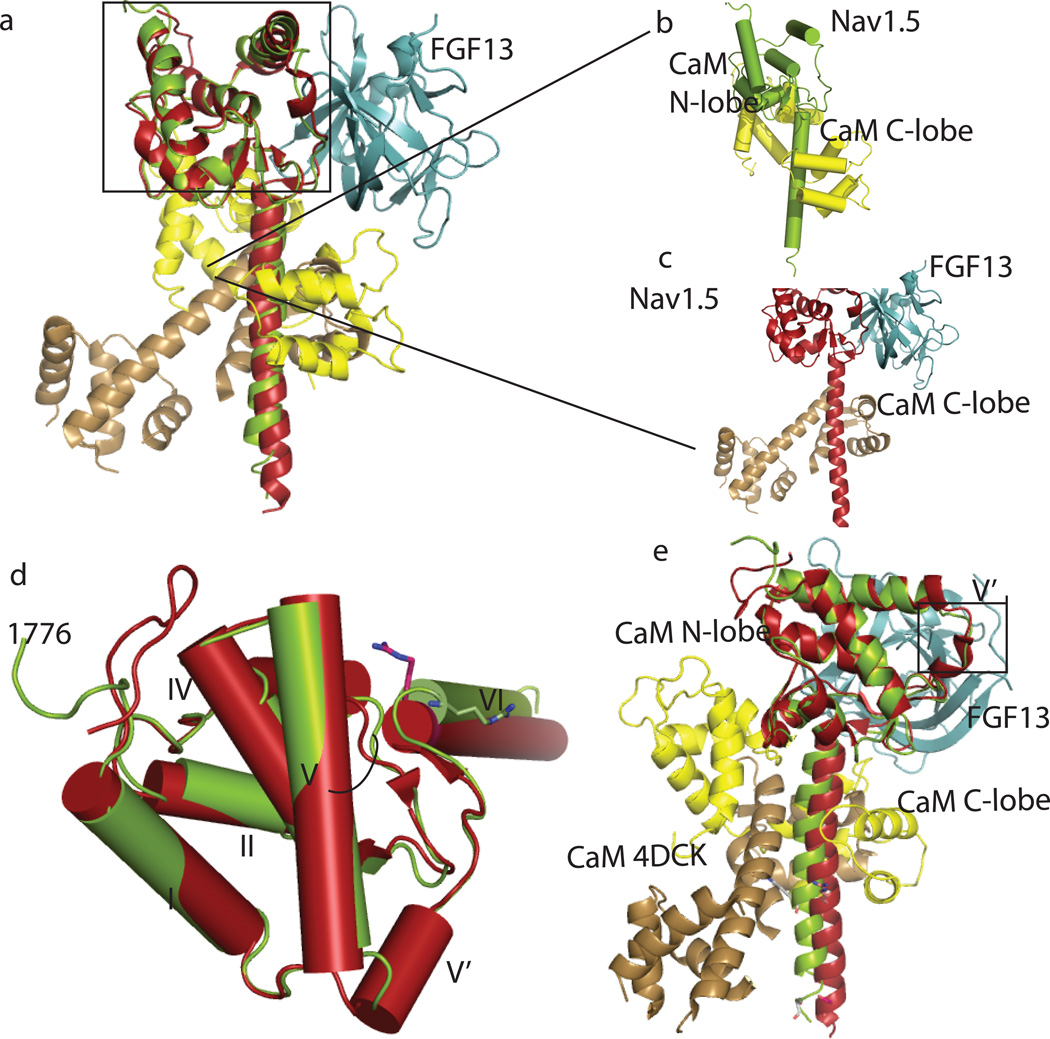
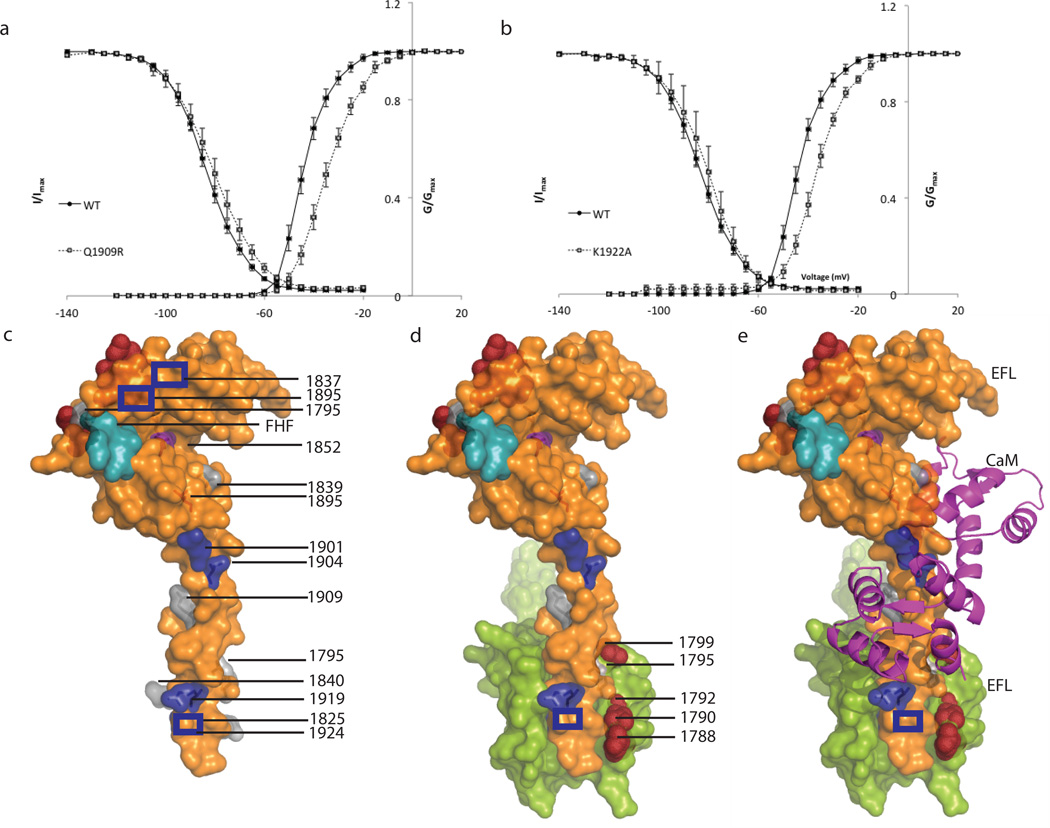
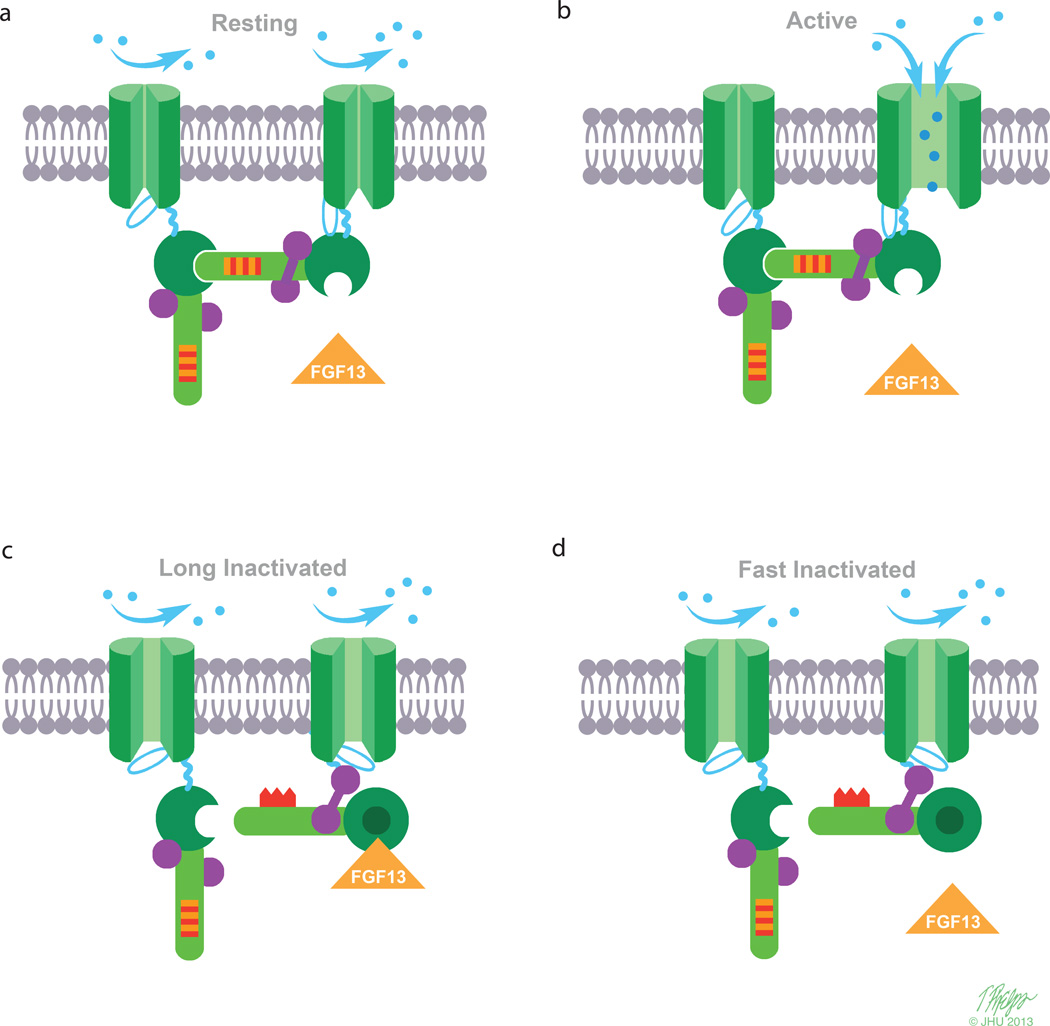
Voltage-gated sodium channels (Na(v)) underlie the rapid upstroke of action potentials in excitable tissues. Binding of channel-interactive proteins is essential for controlling fast and long-term inactivation. In the structure of the complex of the carboxy-terminal portion of Na(v)1.5 (CTNa(v)1.5) with calmodulin (CaM)-Mg(2+) reported here, both CaM lobes interact with the CTNa(v)1.5. On the basis of the differences between this structure and that of an inactivated complex, we propose that the structure reported here represents a non-inactivated state of the CTNa(v), that is, the state that is poised for activation. Electrophysiological characterization of mutants further supports the importance of the interactions identified in the structure. Isothermal titration calorimetry experiments show that CaM binds to CTNa(v)1.5 with high affinity. The results of this study provide unique insights into the physiological activation and the pathophysiology of Na(v) channels.


Figures

Figure 1
Figure 1. CTNav1.5-CaM complex
(a) CTNav1.5-CaM complex with CTNav1.5 in lime green and CaM in yellow. The helices of CTNav1.5 are labeled αI-VI and CaM helices αA–G. (b). The five CTNav1.5-CaM complexes in the asymmetric unit. The CaM molecules are labeled A, B, C, D, and E; the CTNav1.5 are labeled F, G, H, I, J. For example, AF is the heterodimer with CaM molecule A and CTNav1.5 molecule F.
Figure 2
Figure 2. Interaction of CTNav1.5 with CaM
(a) Overview of the heterodimer. (b). Surface representation of the residues involved at the interface of CT Nav1.5 (orange) and the N- and C- lobe of CaM (magenta). The neighboring CTNav1.5 is shown in green. (c) Hydrogen bonding residues flanking the end of the interface (Glu12-Lys1899; Glu15-Asn1831; Glu115-Arg1913; Asp81-Arg1910)
Figure 3
Figure 3. Interaction of the CTNav1.5 EFL domain with a neighboring CTNav1.5 helix αVI
(a) Front view of the CTNav1.5-CTNav1.5 dimer. Residues of one CTNav1.5 molecule (green) interact with another CTNav1.5 molecule (orange). (b) Same as panel A but rotated 90 ° from A in the plane of the figure. (c)90 ° rotation from panel B showing the concave cavity formed by the helices of EFL domain; helix αI 1788–1801; helix αII 1814–1820; helix αIII 1832–1837; helix αIV 1850–1858; helix αV 1866–1882; helix αVI 1897–1926. (d) Close up of the cavity formed by helices αI and αV with helix αVI. (e) Same as D but with one CTNav1.5 colored according to the electrostatic potential. It displays a hydrophobic surface with ionic patches at the beginning and end.
Figure 4
Figure 4. Molecular view of the CTNav1.5 EFL domain with a neighboring CTNav1.5 helix αVI
(a)Overview of the Nav1.5-Nav1.5 interaction. (b) Surface representation of the residues involved at the interface of CT Nav1.5 helix αVI (orange and brown) with the neighboring CTNav1.5 EFL (green and forest green) displaying the involved amino acids as sticks. (c) Ribbon representation of the interface showing the amino acid at hydrogen bonding distance. Hydrogen bonding pattern of CTNav1.5 EFL (green and forest green) with the CTNav1.5 (orange and brown).
Figure 5
Figure 5. Non-inactivated conformation of CTNav1.5-CaM
(a) Thermodynamic analysis of CTNav1.5 and CaM binding. Isotherms of CTNav1.5 titrated with CaM. Top panel display the heat evolved following each injection and the bottom panel shows the integrated heats of injection. All the curves are fitted to a one-binding site per monomer model.(b). Thermodynamic analysis of CTNav1.5-CaM and III-IV linker binding. Isotherm of CTNav1.5-CaM titrated with the III-IV linker (residues 1489–1502). (panels as in a). Note the change in scale on the y axis. (c). Attachment points of the N-termini of the CTNav1.5 (colored squares) to the trans-membrane helices S6 of domain IV of the channel (not shown). (d). Overlap of CT helices αVI in the resting non- inactive conformation (orange) versus inactivated (grey). The rotation of the helix αVI is evidenced by the rotated positions of Lys1899, Arg1910, Arg1913, and Ser1920. This change highlights the disruption of the CTNav1.5-CTNav1.5 interaction caused by the rotation that results in the inactivated form of the channel. (e). Same as (d) but seen from the C-terminal of helix αVI of the CTNav1.5.
Figure 6
Figure 6. Overlap of CTNav1.5-CaM with Nav1.5-CaM-FGF13 aligning their EFL domains
(a) CTNav1.5-CaM is shown in lime-green/yellow (this work; PDB 4OVN). (b) The alignment highlights the rotation of helix αVI by 90° with respect to the EFL domain. The CaM rotates with the helix. CTNav1.5-CaM is shown in lime-green/yellow (this work) and Nav1.5-CaM-FGF13 (PDB 4DCK, red; CaM, sand, FHF in cyan). (c) Nav1.5-CaM-FGF13 (PDB 4DCK). (d) Close-up of the EFL area boxed in panel a; Nav1.5-CaM-FGF13 has an extra helix V’. (e) Overlap of CTNav1.5-CaM with Nav1.5-CaM-FGF13 showing that the extended conformation of CaM is not conducive to the formation of a CTNav1.5-CTNav1.5 dimer; two residues in helix VI show the rotation of the helix. The residues shown are part of the charge-charge interaction of Nav1.5 IQ-CaM.
Figure 7
Figure 7. Mutations affecting CTNav1.5-CaM and CTNav1.5-CTNav1.5 interactions
(a) and (b). Electrophysiological features of Na+ channel variants altered at the CTNav1.5-CaM-Ca2+ interaction interface. Activation and steady state inactivation of wild type (circles) and mutant channels (squares). The data are fit to a Boltzman function as described in Methods. Mutant channels and Q1909R and K1922A exhibit a depolarizing shift in the V0.5 of inactivation (Supplementary Fig. 5). (c) Surface representation of one monomer (orange) interacting with a neighboring molecule (lime green). CTNav1.5 with LQT3 mutations (1795,1825, 1840,1895,1909 and 1924) shown in grey and brugada syndrome mutations in blue (1837,1901,1904,1919). Epilepsy mutations at the interface with CaM-C-term lobe (1895 and 1852) are shown in purple; Brugada mutations (1901 and 1904) are at the interface of CTNav1.5 with the CaM-C-term lobe (blue) and 1705, 1825, 1840, 1924 are at the CTNav1.5-CTNav1.5 interface. Residues 1788, 1790, 1792, 1799, shown in dark red, line the EFL binding site for helix αVI residues past the IQ motif . Residues of the FGF13 that contact the EFL domain are colored turquoise. (d) Same as (c) displaying the neighboring CTNav1.5(e) Same orientation as in panels c and d including CaM as a magenta ribbon.
Figure 8
Figure 8. Proposed mechanism of Nav1.5 regulation by the Nav1.5 cytoplasmic domain
Nav1.5 is colored in green with a serrated marker in helix αVI to highlight the 90° rotation. Calmodulin is shown in purple. (a) Resting state showing the intermolecular interaction of the Nav1.5 poised for activation. (b) Active. N-lobe of CaM interacts with the EFHL domain of Nav1.5; C-lobe of CaM interacts with IQ of helix αVI. (c) Long inactivated. FGF13 bound to the EFHL. (d) Fast inactivated. N-lobe of CaM releases the EFH-like and possible interacts with III-IV linker. Helix αVI rotates 90 degrees

References

    1. Zimmer T, Surber R. SCN5A channelopathies--an update on mutations and mechanisms. Prog Biophys Mol Biol. 2008;98:120–136. - PubMed
    1. Stuhmer W, Methfessel C, Sakmann B, Noda M, Numa S. Patch clamp characterization of sodium channels expressed from rat brain cDNA. Eur Biophys J. 1987;14:131–138. - PubMed
    1. West JW, et al. A cluster of hydrophobic amino acid residues required for fast Na(+)-channel inactivation. Proc Natl Acad Sci U S A. 1992;89:10910–10914. - PMC - PubMed
    1. Abriel H. Roles and regulation of the cardiac sodium channel Na v 1.5: recent insights from experimental studies. Cardiovasc Res. 2007;76:381–389. - PubMed
    1. Savio-Galimberti E, Gollob MH, Darbar D. Voltage-gated sodium channels: biophysics, pharmacology, and related channelopathies. Front Pharmacol. 2012;3:124. - PMC - PubMed

Publication types

MeSH terms

Associated data