. 2014 Nov 4;5(6):e02011.
doi: 10.1128/mBio.02011-14.

Deep sequencing identifies noncanonical editing of Ebola and Marburg virus RNAs in infected cells

Affiliations

Deep sequencing identifies noncanonical editing of Ebola and Marburg virus RNAs in infected cells

Reed S Shabman et al. mBio. .

Abstract

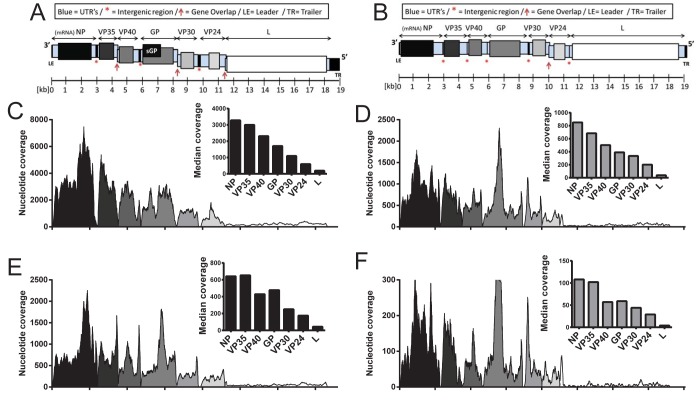
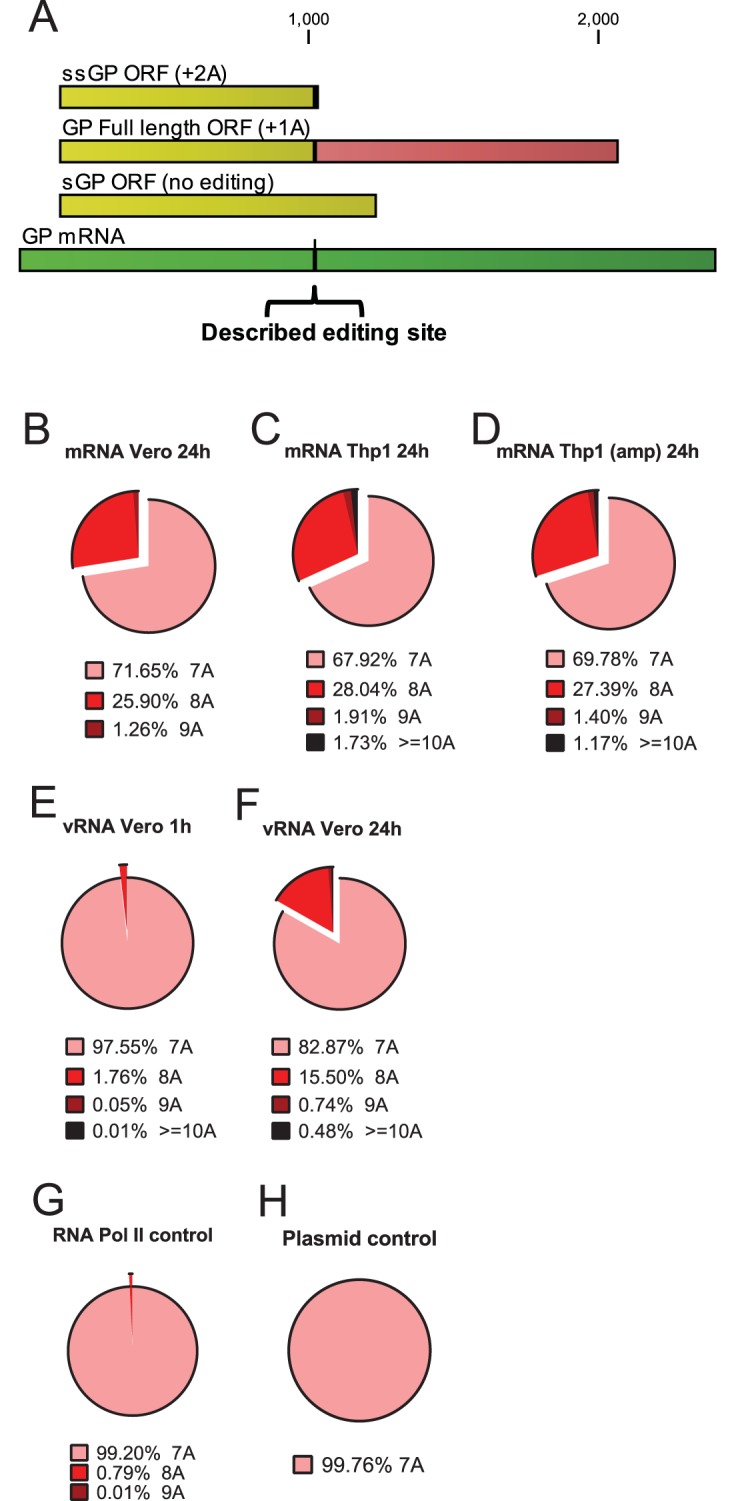
Deep sequencing of RNAs produced by Zaire ebolavirus (EBOV) or the Angola strain of Marburgvirus (MARV-Ang) identified novel viral and cellular mechanisms that diversify the coding and noncoding sequences of viral mRNAs and genomic RNAs. We identified previously undescribed sites within the EBOV and MARV-Ang mRNAs where apparent cotranscriptional editing has resulted in the addition of non-template-encoded residues within the EBOV glycoprotein (GP) mRNA, the MARV-Ang nucleoprotein (NP) mRNA, and the MARV-Ang polymerase (L) mRNA, such that novel viral translation products could be produced. Further, we found that the well-characterized EBOV GP mRNA editing site is modified at a high frequency during viral genome RNA replication. Additionally, editing hot spots representing sites of apparent adenosine deaminase activity were found in the MARV-Ang NP 3'-untranslated region. These studies identify novel filovirus-host interactions and reveal production of a greater diversity of filoviral gene products than was previously appreciated.

Importance: This study identifies novel mechanisms that alter the protein coding capacities of Ebola and Marburg virus mRNAs. Therefore, filovirus gene expression is more complex and diverse than previously recognized. These observations suggest new directions in understanding the regulation of filovirus gene expression.


Figures

FIG 1
FIG 1
Transcriptional profiles of Zaire EBOV and MARV-Ang in multiple cell lines. Two representative filoviruses, EBOV and MARV-Ang, were used to infect both Vero cells and Thp1 cells at a multiplicity of infection of 3. At 12 hpi, mRNA was isolated from each cell line and Illumina HiSeq libraries were generated; nucleotide coverage at each genomic position in EBOV and MARV-Ang was determined. (A) EBOV genomic organization. (B) MARV-Ang genomic organization. (C) EBOV-infected Vero cells at 12 hpi. (D) MARV-Ang-infected Vero cells at 12 hpi. (E) EBOV-infected Thp1 cells at 12 hpi. (F) MARV-Ang-infected Thp1 cells at 12 hpi. For panels C to F, the x axis denotes the genomic position and the y axis denotes nucleotide coverage. Inset graphs for panels represent median nucleotide coverage for each of the seven filovirus transcriptional units.
FIG 2
FIG 2
Insertion frequencies at the described EBOV GP homopolymer region. (A) Depiction of the GP mRNA (dark green) and predicted translation products, depending on which editing events occur. The previously described editing site is identified by the vertical black line and inverted bracket. (B to H) The pie charts depict the numbers of adenosine residues at the canonical EBOV GP editing sites from either EBOV RNA, control RNA, or control DNA. Illumina deep sequencing reads with 10 nt of identity (underlined in the sequence) to each side of the poly(A) stretch at positions 6907 to 6934 (CTGGGAAACTAAAAAAACCTCACTAGA) were identified. The number of reads with 7, 8, or 9 A residues were then enumerated. (B) Insertion frequency in mRNA from Vero cells at 24 hpi, determined from libraries constructed from chemically sheared RNA. (C) mRNA from Thp1 cells at 24 hpi, determined from libraries constructed from chemically sheared RNA. (D) mRNA from Thp1 cells at 24 hpi determined from an RT-PCR amplicon encompassing the region of interest. (E) Homopolymer insertion frequency of genomic RNA (vRNA) at 1 hpi, determined from an amplicon encompassing the region of interest. (F) The same experiment as shown in the middle left pie chart, but vRNA was assessed at 24 hpi. (G) Insertion frequency from mRNA derived from an RNA polymerase II-driven plasmid expressing the sequence of the 7-A EBOV sGP mRNA. (H) Insertion frequency from a DNA plasmid harboring the EBOV sGP ORF.
FIG 3
FIG 3
Insertion frequencies in the EBOV GP homopolymer region at nt 6378 to 6383. (A) Diagram similar to that in Fig. 2, except the novel GP editing site and the predicted translation product arising from the novel edited mRNA are depicted. (B to G) Pie charts depicting the number of adenosine residues at a novel location with the EBOV GP ORF from either EBOV RNA, control RNA, or control DNA. The numbers of A residues were enumerated within the homopolymer region from Illumina sequencing reads, with 10 nt of matching sequence (underlined in the sequence) directly flanking each side from position 6367 to 6393 (TCTTGAAATCAAAAAACCTGACGGGA). (B) Homopolymer insertion frequency in mRNA of Thp1 cells at 24 hpi, determined from libraries constructed from chemically sheared RNA. (C) mRNA from Vero cells at 24 hpi, determined from libraries constructed from chemically sheared RNA. (D) Homopolymer insertion frequency in genomic RNA (vRNA) at 1 hpi, determined from an amplicon encompassing the region of interest. (E) The same experiment as depicted in panel D, except that vRNA was assessed at 24 hpi. (F) Insertion frequency from mRNA derived from an RNA polymerase II-driven plasmid expressing EBOV GP mRNA. (G) Insertion frequency from a DNA plasmid harboring the EBOV GP ORF.
FIG 4
FIG 4
Insertion frequencies in the MARV-Ang NP homopolymer region at nt 816 to 821. (A) Depiction of the NP mRNA (dark green) and different translation products produced, depending on editing. (B to F) Pie charts depicting the numbers of adenosine residues inserted at the novel site within the MARV-Ang NP ORF. The numbers of A residues were enumerated within the homopolymer region from sequencing reads with 10 nt of matching sequence (underlined in the sequence) directly flanking each side from positions 805 to 831 (GTTCATCTTGCAAAAAACTGATTCAGG). (B) Homopolymer insertion frequency in mRNA of Thp1 cells at 24 hpi, determined from libraries constructed from chemically sheared RNA. (C) mRNA from Vero cells at 24 hpi, determined from libraries constructed from chemically sheared RNA. (D) Homopolymer insertion frequency in genomic RNA (vRNA) at 1 hpi, determined from an amplicon encompassing the region of interest. (E) The same experiment as in panel D, except that vRNA was assessed at 24 hpi. (F) Insertion frequency from a DNA plasmid containing the MARV-Ang NP ORF.
FIG 5
FIG 5
Insertion frequencies in the MARV-Ang L homopolymer region, nt 17810 to 17815. (A) Depiction of the L mRNA (dark green) and different translation products produced, depending on editing. (B to F) Pie charts depicting the numbers of adenosine residues at a novel location in the MARV-Ang L ORF. The numbers of A residues were enumerated within the homopolymer region from sequencing reads with 10 nt of matching sequence (underlined in the sequence) directly flanking each side from positions 17799 to 17825 (GCTCAAATGCAAAAAACTCAGAATGG). (B) Homopolymer insertion frequency in mRNA of Thp1 cells at 24 hpi, determined from libraries constructed from chemically sheared RNA. (C) mRNA from Vero cells at 24 hpi, determined from libraries constructed from chemically sheared RNA. (D) Homopolymer insertion frequency of genomic RNA (vRNA) at 1 hpi, determined from an amplicon encompassing the region of interest. (E) The same experiment as in panel D, except that vRNA was assessed at 24 hpi. (F) Insertion frequency from a DNA plasmid harboring the MARV-Ang L ORF.
FIG 6
FIG 6
Insertion frequencies within homopolymer regions of MARV-Ang NP and L from the adrenal glands of infected macaques. Pie charts depict the numbers of adenosine residues at the novel locations within the MARV-Ang L ORF detected in RNA extracted from infected macaque mRNA. The numbers of A residues were enumerated within the homopolymer region from sequencing reads with 10 nt of matching sequence (underline in the sequence) directly flanking each side from positions 17799 to 17825 (GCTCAAATGCAAAAAACTCAGAATGG). (A) Homopolymer insertion frequency in MARV-Ang NP mRNA at 9 dpi within adrenal gland, determined from an amplicon encompassing the region of interest. (B) Homopolymer insertion frequency in MARV-Ang L mRNA at 9 dpi within adrenal gland, determined from an amplicon encompassing the region of interest.

References

    1. WHO Ebola Response Team 23 September 2014. Ebola virus disease in West Africa—the first 9 months of the epidemic and forward projections. N. Engl. J. Med. 10.1056/NEJMoa1411100. - DOI - PMC - PubMed
    1. Feldmann H, Geisbert TW. 2011. Ebola haemorrhagic fever. Lancet 377:849–862. 10.1016/S0140-6736(10)60667-8. - DOI - PMC - PubMed
    1. Hartman AL, Towner JS, Nichol ST. 2010. Ebola and marburg hemorrhagic fever. Clin. Lab. Med. 30:161–177. 10.1016/j.cll.2009.12.001. - DOI - PubMed
    1. Bagcchi S. 2014. Ebola haemorrhagic fever in West Africa. Lancet Infect. Dis. 14:375. 10.1016/S1473-3099(14)70034-9. - DOI - PubMed
    1. Feldmann H, Mühlberger E, Randolf A, Will C, Kiley MP, Sanchez A, Klenk HD. 1992. Marburg virus, a filovirus: messenger RNAs, gene order, and regulatory elements of the replication cycle. Virus Res. 24:1–19. 10.1016/0168-1702(92)90027-7. - DOI - PubMed

Publication types