

Up-regulation of Glis2 involves in neuronal apoptosis after intracerebral hemorrhage in adult rats
- PMID: 25370802
- PMCID: PMC11486247
- DOI: 10.1007/s10571-014-0130-1
Up-regulation of Glis2 involves in neuronal apoptosis after intracerebral hemorrhage in adult rats
Abstract
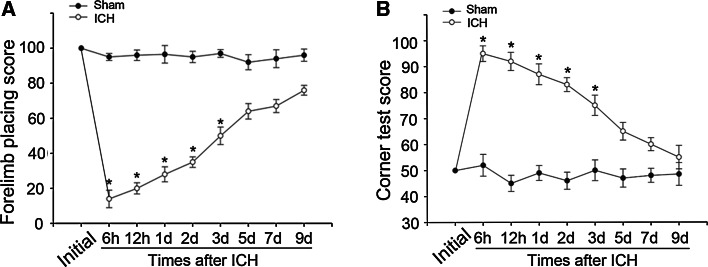
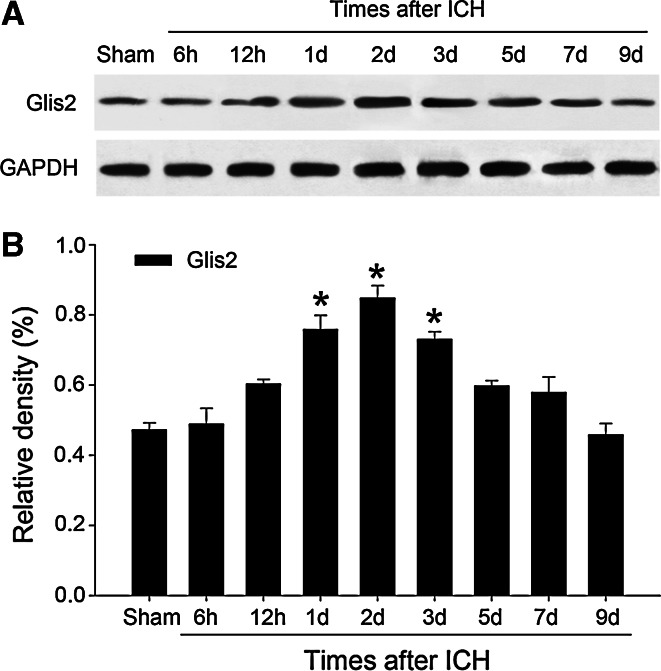
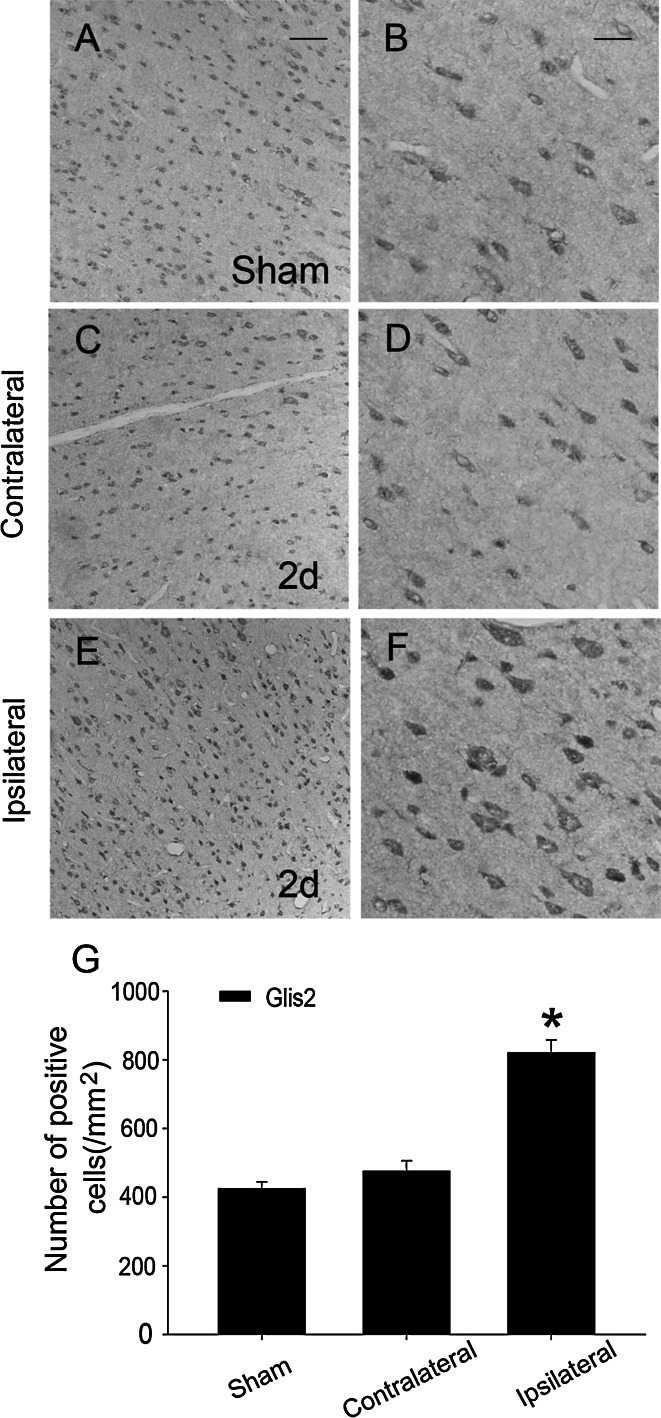
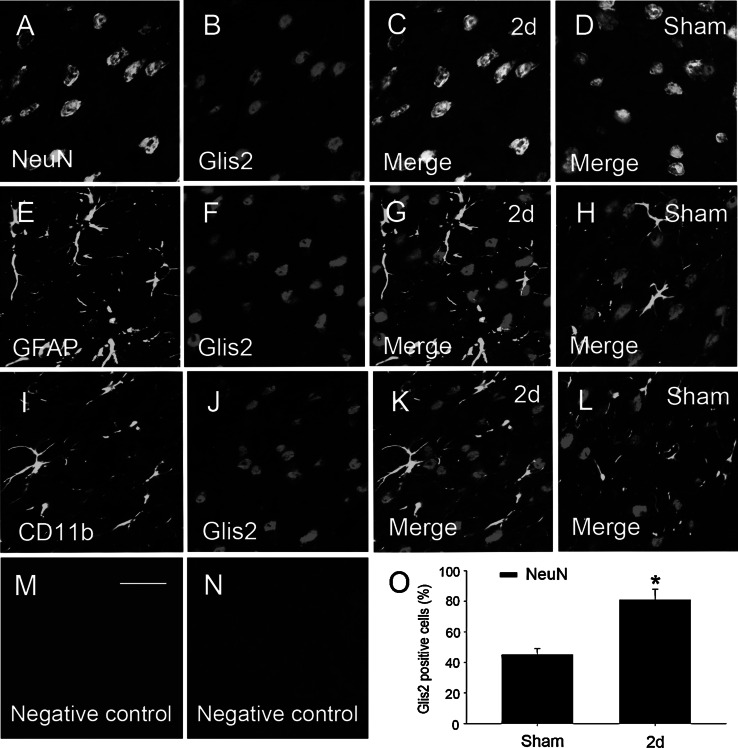
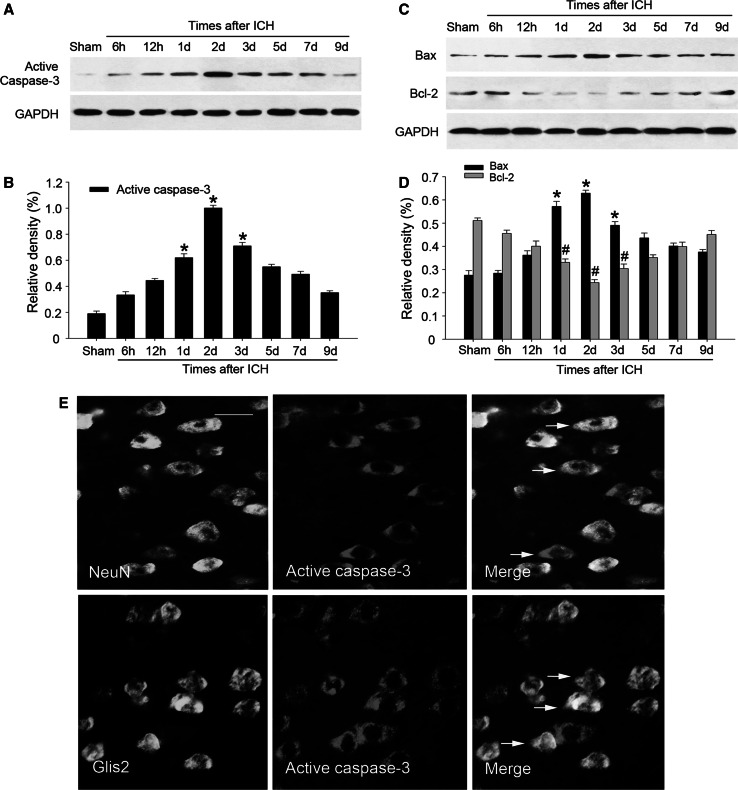
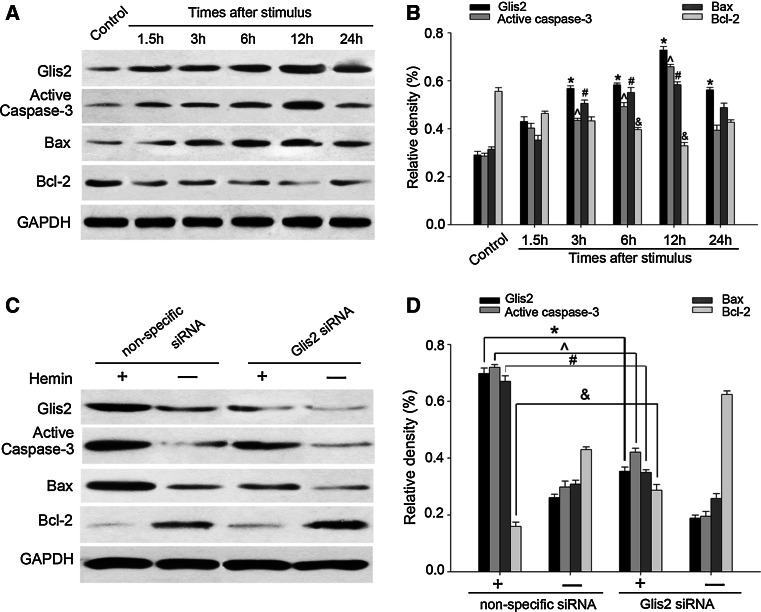
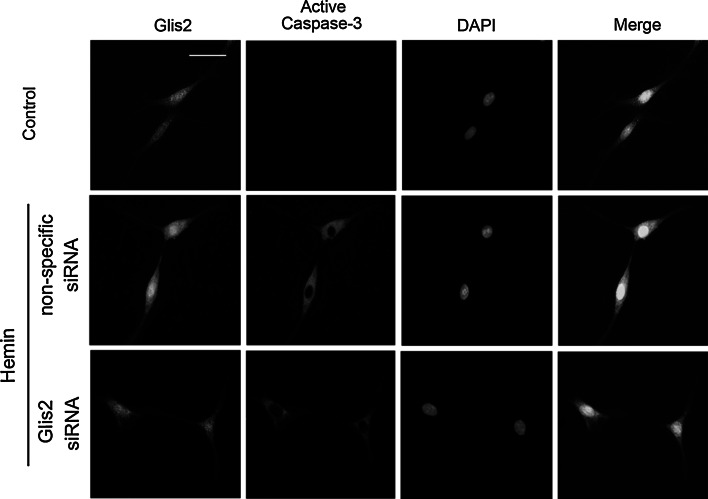
The novel Krüppel-like zinc finger protein Gli-similar 2 (Glis2), one member of the transcription factors, is involved in controlling the flow of genetic information and the modulation of diverse cellular activities. Accumulating evidence has demonstrated its important roles in adult development and several diseases. However, information regarding the regulation and possible function of Glis2 in the central nervous system is still limited. In this study, we explored the roles of Glis2 during the pathophysiological process of intracerebral hemorrhage (ICH). An ICH rat model was established and assessed by behavioral tests. Expression of Glis2 was significantly up-regulated in brain areas surrounding the hematoma following ICH. Immunofluorescence showed that Glis2 was strikingly increased in neurons, but not astrocytes or microglia. Up-regulation of Glis2 was found to be accompanied by the increased expression of active caspase-3 and Bax and decreased expression of Bcl-2 in vivo and vitro studies. Moreover, knocking down Glis2 by RNA-interference in PC12 cells reduced active caspase-3 and Bax expression while increased Bcl-2. Collectively, we speculated that Glis2 might exert pro-apoptotic function in neurons following ICH.
Conflict of interest statement
The authors declare no conflict of interest.
Figures
Similar articles
-
Upregulated Expression of SSTR3 is Involved in Neuronal Apoptosis After Intracerebral Hemorrhage in Adult Rats.Cell Mol Neurobiol. 2017 Nov;37(8):1407-1416. doi: 10.1007/s10571-017-0471-7. Epub 2017 Feb 7. Cell Mol Neurobiol. 2017. PMID: 28176050 Free PMC article.
-
Upregulated Expression of Karyopherin α2 is Involved in Neuronal Apoptosis Following Intracerebral Hemorrhage in Adult Rats.Cell Mol Neurobiol. 2016 Jul;36(5):755-65. doi: 10.1007/s10571-015-0258-7. Epub 2015 Sep 4. Cell Mol Neurobiol. 2016. PMID: 26340948 Free PMC article.
-
Up-regulation of NFATc4 involves in neuronal apoptosis following intracerebral hemorrhage.Cell Mol Neurobiol. 2013 Oct;33(7):893-905. doi: 10.1007/s10571-013-9955-2. Epub 2013 Jul 14. Cell Mol Neurobiol. 2013. PMID: 23852416 Free PMC article.
-
Up-regulation of VCAM1 Relates to Neuronal Apoptosis After Intracerebral Hemorrhage in Adult Rats.Neurochem Res. 2015 May;40(5):1042-52. doi: 10.1007/s11064-015-1561-x. Epub 2015 Apr 14. Neurochem Res. 2015. PMID: 25868755
-
Up-Regulation of Interferon Regulatory Factor 3 Involves in Neuronal Apoptosis After Intracerebral Hemorrhage in Adult Rats.Neurochem Res. 2016 Nov;41(11):2937-2947. doi: 10.1007/s11064-016-2012-z. Epub 2016 Jul 22. Neurochem Res. 2016. PMID: 27447882
Cited by
-
The protective role of (-)-epigallocatechin-3-gallate in thrombin-induced neuronal cell apoptosis and JNK-MAPK activation.Neuroreport. 2015 May 6;26(7):416-23. doi: 10.1097/WNR.0000000000000363. Neuroreport. 2015. PMID: 25839175 Free PMC article.
-
Cell-type-specific cis-regulatory divergence in gene expression and chromatin accessibility revealed by human-chimpanzee hybrid cells.Elife. 2024 Feb 15;12:RP89594. doi: 10.7554/eLife.89594. Elife. 2024. PMID: 38358392 Free PMC article.
-
Resveratrol Attenuates Neurodegeneration and Improves Neurological Outcomes after Intracerebral Hemorrhage in Mice.Front Cell Neurosci. 2017 Aug 8;11:228. doi: 10.3389/fncel.2017.00228. eCollection 2017. Front Cell Neurosci. 2017. PMID: 28848394 Free PMC article.
-
Key Cell-in-Cell Related Genes are Identified by Bioinformatics and Experiments in Glioblastoma.Cancer Manag Res. 2024 Sep 5;16:1109-1130. doi: 10.2147/CMAR.S475513. eCollection 2024. Cancer Manag Res. 2024. PMID: 39253064 Free PMC article.
-
High caspase 3 and vulnerability to dual BCL2 family inhibition define ETO2::GLIS2 pediatric leukemia.Leukemia. 2023 Mar;37(3):571-579. doi: 10.1038/s41375-022-01800-0. Epub 2022 Dec 30. Leukemia. 2023. PMID: 36585521 Free PMC article.
References
-
- Attanasio M, Uhlenhaut NH, Sousa VH, O’Toole JF, Otto E, Anlag K, Klugmann C, Treier AC, Helou J, Sayer JA, Seelow D, Nurnberg G, Becker C, Chudley AE, Nurnberg P, Hildebrandt F, Treier M (2007) Loss of GLIS2 causes nephronophthisis in humans and mice by increased apoptosis and fibrosis. Nat Genet 39(8):1018–1024 - PubMed
MeSH terms
Substances
LinkOut - more resources
Full Text Sources
Other Literature Sources
Research Materials
