. 2014 Nov 4:7:780.
doi: 10.1186/1756-0500-7-780.

The defect of SFRP2 modulates an influx of extracellular calcium in B lymphocytes

Affiliations

The defect of SFRP2 modulates an influx of extracellular calcium in B lymphocytes

Yuichi Tokuda et al. BMC Res Notes. .

Abstract

Background: In the Wnt pathway, the secreted frizzled-related protein 2 (SFRP2) is thought to act as one of the several competitive inhibitors of Wnt. However, the precise role of SFRP2 is still poorly understood especially in B lymphocytes. Here, we investigated the function of SFRP2, comparing the SFRP2 defective as well as normal B lymphocytes in mice.

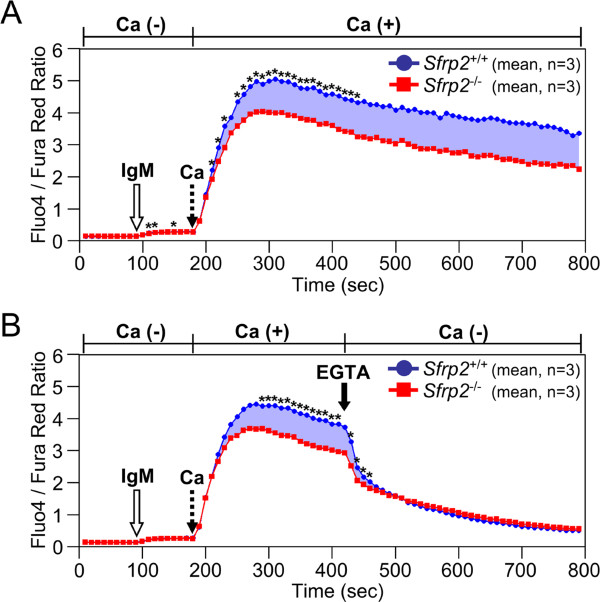
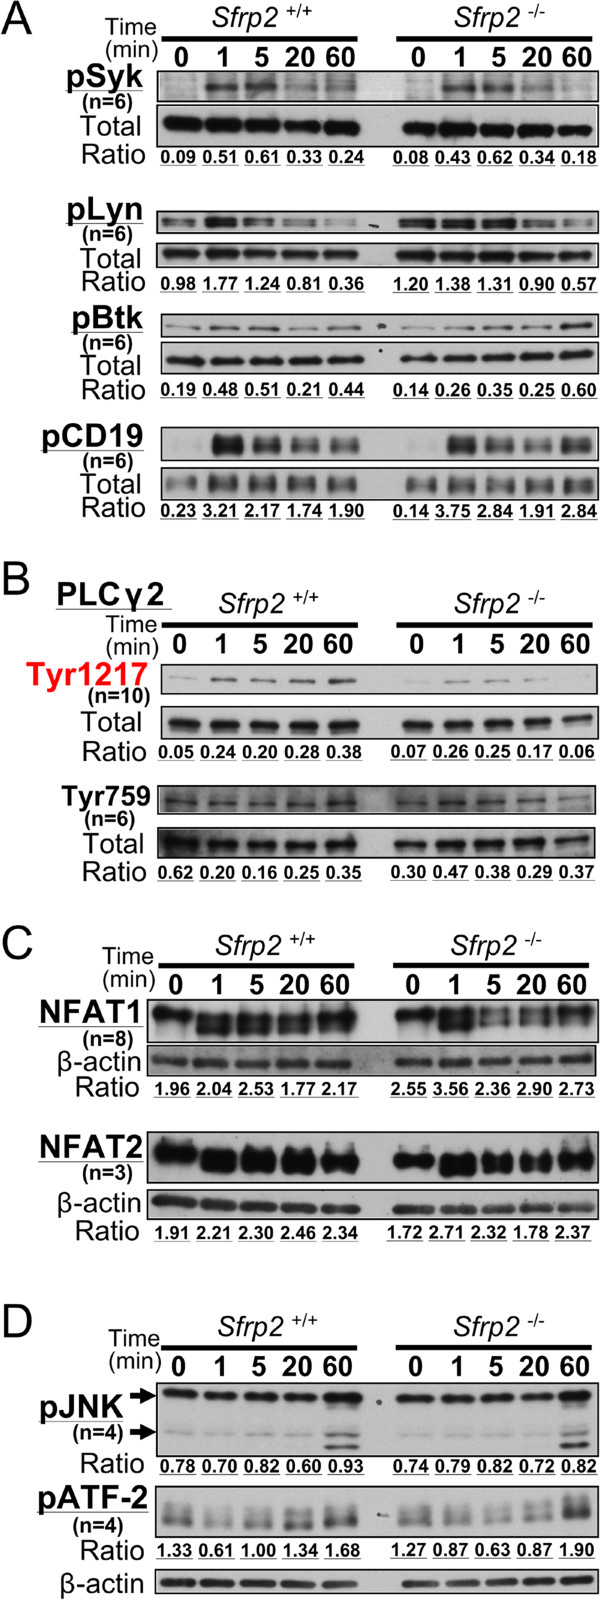
Results: We demonstrated that calcium influx from extracellular to intracellular space in splenic B cells was clearly affected by the defect of SFRP2. In addition, the phosphorylation of phospholipase Cγ2 was observed to be reduced in SFRP2 defective splenic B cells with B cell receptor stimulation.

Conclusions: SFRP2 is suggested to modulate the influx from extracellular calcium in the B cell receptor signaling pathway.


Figures

Figure 1
Figure 1
Comparison of BM and splenic B cell differentiation. The cells in the BM or spleen were assessed with each surface marker. The representative FACS plots are demonstrated by FlowJo. (A) The results of BM are indicated for B cell differentiation stages of pro-B, pre-B, immature B (IMB), and mature B (MB) cells. The histograms indicate the means and SD of the 6 littermates with same gender pairs for these cell stages. No statistical significant difference between Sfrp2 +/+ and Sfrp2 -/- in these cell stages was observed by Student’s t-tests. (B) The results of splenic B cells for transitional type 1 (T1), marginal zone B (MZB), transitional type 2 (T2), and follicular B (FOB) cells are indicated. The histograms indicate the means and SD of the 6 gender-matched littermates. In splenic B cells, there was no statistical significant difference between Sfrp2 +/+ and Sfrp2 -/- by Student’s t-tests.
Figure 2
Figure 2
Calcium influx of splenic B cell. The calcium influx in splenic B cells was examined by FACS. The Sfrp2 +/+ and Sfrp2 -/- splenic B cells were derived from 3 littermates with same gender pair and assessed after gated with anti-B220. The means of 3 replicates are plotted by the blue circles (Sfrp2 +/+) and red squares (Sfrp2 -/-). The black asterisks indicate the statistical significance by paired t-test in each time point. Blue shaded regions indicate the differences of intensity ratios between Sfrp2 +/+ and Sfrp2 -/- splenic B cells. (A) After 1.5 min acquisition of signals, the cells were stimulated with anti-IgM (IgM; open arrow). Furthermore, the cells were treated with calcium at 3 min (dotted arrow). (B) Following the similar process, the cells were then incubated with EGTA at 7 min (filled arrow).
Figure 3
Figure 3
ER abundance of splenic B cell. (A) The representative results of ER abundance in splenic B cells gated with anti-B220 are displayed by using FlowJo. Upper (blue) and lower (red) plots are represented as the percentages of the max of the ER-Tracker signals in splenic B cell of Sfrp2 +/+ and Sfrp2 -/-, respectively. The filled areas indicate ER-Tracker stained B cells and the line areas indicate the intensity of non-stained samples. (B) The histograms indicate the means and SD of the 4 littermate pairs for the percentage of ER-Tracker positive cells. No statistical significant difference in ER abundance between Sfrp2 +/+ and Sfrp2 -/- splenic B cells was observed by Student’s t-tests.
Figure 4
Figure 4
Western blotting results of PLCγ2 splenic B cell. The representative results of western blotting were displayed. Splenic B cells were stimulated with anti-IgM. All experiments were replicated and confirmed three times at least. “n” indicates the number of total tested sample for each protein. (A) The phosphorylation of Syk (Tyr525/526; pSyk), Lyn (Tyr507; pLyn), Btk (Tyr223; pBtk), and CD19 (Tyr531; pCD19) sites and (B) Tyr1217 and Tyr759 phosphorylation of PLCγ2 were demonstrated with “Total” as the controls, which indicate the amount of each applied protein. (C) The expressions of NFAT1 and NFAT2 were indicated with β-actin. (D) The phosphorylation of SAPK/JNK (Thr183/Tyr185; pJNK) and ATF-2 (Thr71; pATF-2) were indicated with β-actin. Note that there were two bands for JNK in 54 and 46 kDa due to isoforms as noted by arrows. The ratio of expression level of each sample was calculated by using ImageJ.

References

    1. Miller JR. The Wnts. Genome Biol. 2002;3:REVIEWS3001. - PMC - PubMed
    1. Huelsken J, Behrens J. The Wnt signalling pathway. J Cell Sci. 2002;115:3977–3978. doi: 10.1242/jcs.00089. - DOI - PubMed
    1. Reya T, Clevers H. Wnt signalling in stem cells and cancer. Nature. 2005;434:843–850. doi: 10.1038/nature03319. - DOI - PubMed
    1. Suda T, Arai F. Wnt signaling in the niche. Cell. 2008;132:729–730. doi: 10.1016/j.cell.2008.02.017. - DOI - PubMed
    1. Rao TP, Kuhl M. An updated overview on Wnt signaling pathways: a prelude for more. Circ Res. 2010;106:1798–1806. doi: 10.1161/CIRCRESAHA.110.219840. - DOI - PubMed

Publication types

LinkOut - more resources