

Continuity of states between the cholesteric → line hexatic transition and the condensation transition in DNA solutions
- PMID: 25371012
- PMCID: PMC4220286
- DOI: 10.1038/srep06877
Continuity of states between the cholesteric → line hexatic transition and the condensation transition in DNA solutions
Abstract
A new method of finely temperature-tuning osmotic pressure allows one to identify the cholesteric → line hexatic transition of oriented or unoriented long-fragment DNA bundles in monovalent salt solutions as first order, with a small but finite volume discontinuity. This transition is similar to the osmotic pressure-induced expanded → condensed DNA transition in polyvalent salt solutions at small enough polyvalent salt concentrations. Therefore there exists a continuity of states between the two. This finding, together with the corresponding empirical equation of state, effectively relates the phase diagram of DNA solutions for monovalent salts to that for polyvalent salts and sheds some light on the complicated interactions between DNA molecules at high densities.
Figures
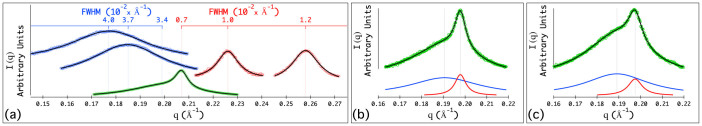
 , where dBragg = 2π/qmax. (a): First-order diffraction peaks when [PEG] = 20 wt%, 22 wt%, 25 wt%, 30 wt%, and 40 wt% with temperature fixed at T = 40°C (with corresponding pressures Π = 5.3 atm, 6.7 atm, 9.5 atm, 15.6 atm, and 38.3 atm) from left to right, respectively. At low pressures (Π = 5.3 atm and 6.7 atm), the DNA precipitate is in the cholesteric phase, where the full width at half-maximum (FWHM) of the first-order peak is
  (increases with increasing dint). Instrumental resolution and experimental error in the determination of FWHM of the first-order diffraction peaks are ≈0.001Å−1 FWHM and vary slightly with q. At high pressures (Π = 15.6 atm and 38.3 atm), DNA bundles are in the LH phase, which is characterized by a narrow first-order peak, i.e.,
  (increases with decreasing dint). When Π = 9.5 atm, the narrow LH peak is superimposed with the broad cholesteric peak in the diffraction profile. The two distinct types of peaks coexist over a small range of Π, i.e., coexistence region. (b): Phase coexistence observed when [PEG] = 22 wt% and T = 30°C (with corresponding pressure Π = 7.7 atm). (c): Phase coexistence observed when [PEG] = 20 wt% and T = 15°C (with corresponding pressure Π = 7.4 atm).
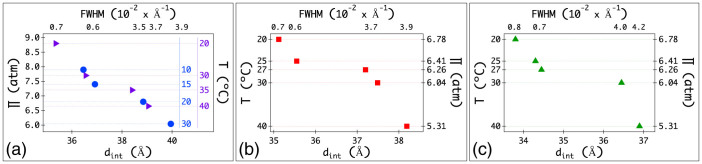
 ) are determined from x-ray diffraction profiles at the lowest pressures in the coexistence region. Cholesteric phase data points given here are from the diffraction profiles characterized by only the broad peak (without the narrow LH peak), i.e., cholesteric phase data are not shown in the coexistence region. In (a), temperature variations (right axes) and the corresponding pressures (left axis) are shown for two different [PEG], i.e., [PEG] = 20 wt% (blue solid circles) and [PEG] = 22 wt% (purple right-facing triangles). The two right axes in (a) showing the temperature variations are for [PEG] = 20 wt% and [PEG] = 22 wt% from left to right, respectively. As explained in the text (see also the caption to Fig. 1), the variations of dint and FWHM with pressure are independent of temperature for all [NaCl]. Note that (a) is adapted from ref. .
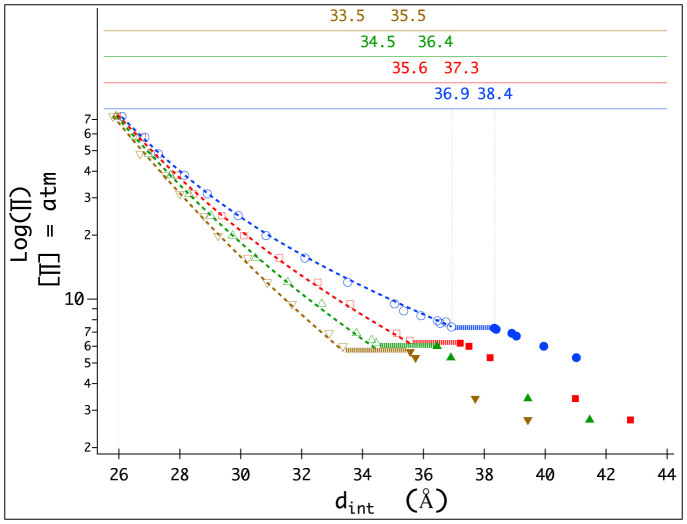
 to
to  ) at the transition. Πtr,
  , and
, and  do not vary significantly for [NaCl] ≥ 0.4 M. The interaxial separations
  and
and  are given in the top axes for [NaCl] = 0.1, 0.2, 0.3, 0.4 M from bottom to top, respectively. Horizontal lines show the transitions. The overall error in the determination of the interaxial separations in the LH phase is about 0.1Å. The overall error in the cholesteric phase is bigger (as big as ≈0.2Å) due to the positional disorder and broadening of diffraction peaks. Upon increasing osmotic pressure in the LH phase, dint decreases monotonically, and osmotic pressure curves for all [NaCl] converge. Here data are shown up to the pressure (Π ≈ 72 atm) where the differences between the measured dint for the given ionic conditions are ≈0.1Å, i.e., close to the uncertainty in the determination of dint. Therefore, in the fits of LH phase data to Π0, data from
  to dint ≈ 26Å are used. The dashed lines represent the fits for [NaCl] = 0.1, 0.2, 0.3, 0.4 M from top to bottom, respectively.
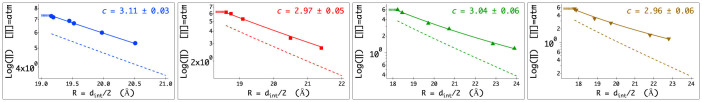
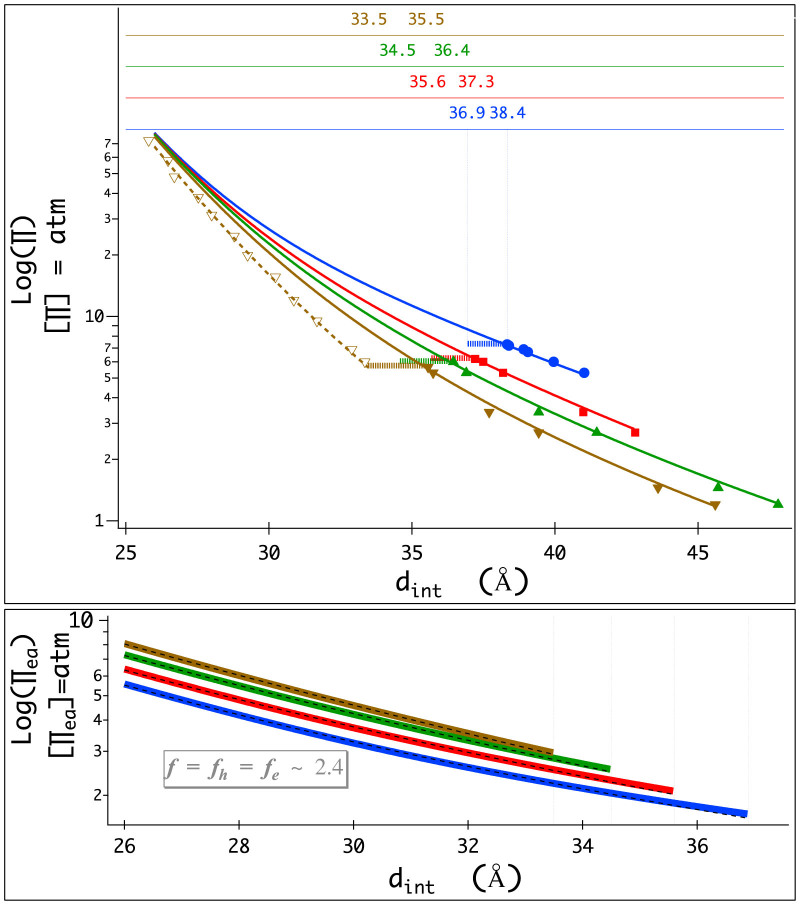
 due to the transition to the cholesteric phase, where Πatt = 0. From the simultaneous fits of Πea vs. dint data to
  (thin black dashed lines), we extract the decay length ratios, f = fh = fe ≈ 2.4 (see SI for the details).
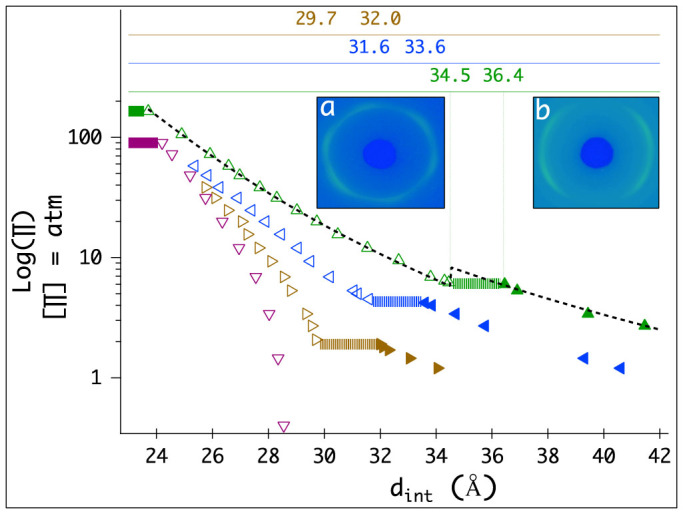
 ) and [CoHex] = [CoHex]* data is shown only for T = 20°C. No detectable temperature dependence for other [CoHex] (see SI and ref. for details) and the transitions can be measured with high accuracy using temperature variations. Insets: Typical x-ray images of oriented DNA bundles in LH phase with DNA helical axis parallel and perpendicular to the x-ray beam in (a) and (b), respectively. The sixfold symmetry in (a) shows the long-range bond orientational order in the LH phase. This symmetry does not exist in the x-ray images of DNA samples in the cholesteric phase. The twofold symmetry in (b) shows the parallel alignment of DNA chains. In the oriented sample preparations, we align the bundles of DNA chains in the same direction in order to make macroscopically oriented samples so that 2D ordering of DNA chains can be seen in the x-ray images. The angular widths of the arcs are due to the mosaic spread in our samples.
References
-
- Strey H. H., Parsegian V. A. & Podgornik R. Equation of state for polymer liquid crystals: Theory and experiment. Phys. Rev. E 59, 999–1008 (1999).
-
- Rey A. D. Liquid crystal models of biological materials and processes. Soft Matter 6, 3402–3429 (2010).
-
- Ross W. H., Bruinsma R. & Wuite G. J. L. Physical virology. Nature Phys. 6, 733–743 (2010).
-
- Knobler C. M. & Gelbart W. M. Physical Chemistry of DNA Viruses. Annu. Rev. Phys. Chem. 60, 367–383 (2009). - PubMed
Publication types
MeSH terms
Substances
LinkOut - more resources
Full Text Sources
Other Literature Sources
Molecular Biology Databases
