Missing value imputation in high-dimensional phenomic data: imputable or not, and how?
- PMID: 25371041
- PMCID: PMC4228077
- DOI: 10.1186/s12859-014-0346-6
Missing value imputation in high-dimensional phenomic data: imputable or not, and how?
Abstract
Background: In modern biomedical research of complex diseases, a large number of demographic and clinical variables, herein called phenomic data, are often collected and missing values (MVs) are inevitable in the data collection process. Since many downstream statistical and bioinformatics methods require complete data matrix, imputation is a common and practical solution. In high-throughput experiments such as microarray experiments, continuous intensities are measured and many mature missing value imputation methods have been developed and widely applied. Numerous methods for missing data imputation of microarray data have been developed. Large phenomic data, however, contain continuous, nominal, binary and ordinal data types, which void application of most methods. Though several methods have been developed in the past few years, not a single complete guideline is proposed with respect to phenomic missing data imputation.
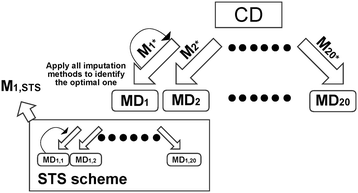
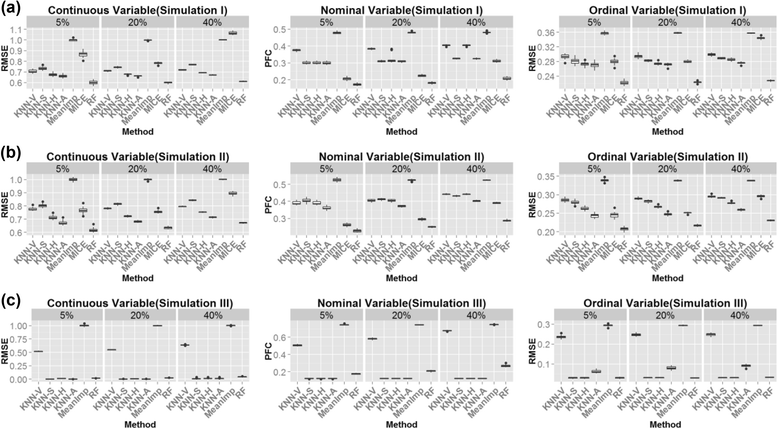
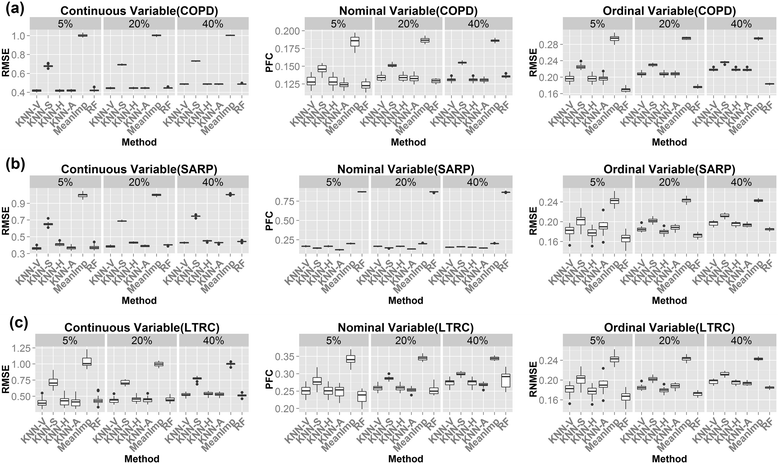
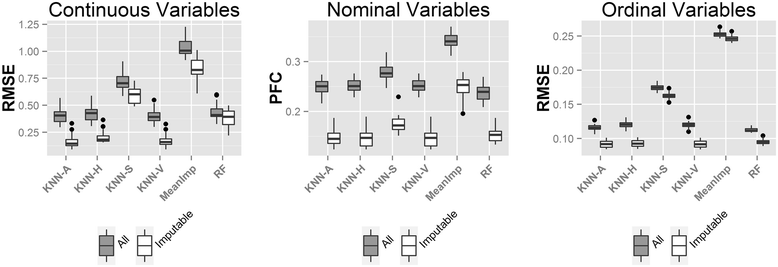
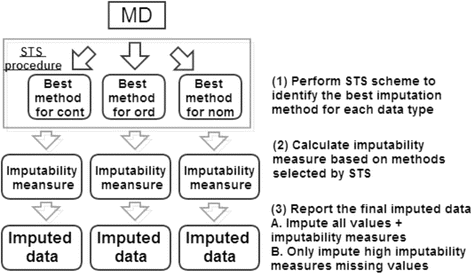
Results: In this paper, we investigated existing imputation methods for phenomic data, proposed a self-training selection (STS) scheme to select the best imputation method and provide a practical guideline for general applications. We introduced a novel concept of "imputability measure" (IM) to identify missing values that are fundamentally inadequate to impute. In addition, we also developed four variations of K-nearest-neighbor (KNN) methods and compared with two existing methods, multivariate imputation by chained equations (MICE) and missForest. The four variations are imputation by variables (KNN-V), by subjects (KNN-S), their weighted hybrid (KNN-H) and an adaptively weighted hybrid (KNN-A). We performed simulations and applied different imputation methods and the STS scheme to three lung disease phenomic datasets to evaluate the methods. An R package "phenomeImpute" is made publicly available.
Conclusions: Simulations and applications to real datasets showed that MICE often did not perform well; KNN-A, KNN-H and random forest were among the top performers although no method universally performed the best. Imputation of missing values with low imputability measures increased imputation errors greatly and could potentially deteriorate downstream analyses. The STS scheme was accurate in selecting the optimal method by evaluating methods in a second layer of missingness simulation. All source files for the simulation and the real data analyses are available on the author's publication website.
Figures
References
-
- Denny JC, Ritchie MD, Basford MA, Pulley JM, Bastarache L, Brown-Gentry K, Wang D, Masys DR, Roden DM, Crawford DC. PheWAS: demonstrating the feasibility of a phenome-wide scan to discover gene-disease associations. Bioinformatics. 2010;26(9):1205–1210. doi: 10.1093/bioinformatics/btq126. - DOI - PMC - PubMed
-
- Ritchie MD, Denny JC, Zuvich RL, Crawford DC, Schildcrout JS, Bastarache L, Ramirez AH, Mosley JD, Pulley JM, Basford MA, Bradford Y, Rasmussen LV, Pathak J, Chute CG, Kullo IJ, McCarty CA, Chisholm RL, Kho AN, Carlson CS, Larson EB, Jarvik GP, Sotoodehnia N, Cohorts for Heart Aging Research in Genomic Epidemiology (CHARGE) QRS Group. Manolio TA, Li R, Masys DR, Haines JL, Roden DM. Genome- and phenome-wide analyses of cardiac conduction identifies markers of arrhythmia risk. Circulation. 2013;127(13):1377–1385. doi: 10.1161/CIRCULATIONAHA.112.000604. - DOI - PMC - PubMed
-
- Warner JL, Alterovitz G, Bodio K, Joyce RM. External phenome analysis enables a rational federated query strategy to detect changing rates of treatment-related complications associated with multiple myeloma. J Am Med Inform Assoc. 2013;20(4):696–699. doi: 10.1136/amiajnl-2012-001355. - DOI - PMC - PubMed
Publication types
MeSH terms
Grants and funding
LinkOut - more resources
Full Text Sources
Other Literature Sources
Miscellaneous

