. 2015 Jan 2;290(1):520-8.
doi: 10.1074/jbc.M114.606731. Epub 2014 Nov 4.

Kinetics of iron import into developing mouse organs determined by a pup-swapping method

Affiliations

Kinetics of iron import into developing mouse organs determined by a pup-swapping method

Mrinmoy Chakrabarti et al. J Biol Chem. .

Abstract

The kinetics of dietary iron import into various organs of mice were evaluated using a novel pup-swapping approach. Newborn pups whose bodies primarily contained (56)Fe or (57)Fe were swapped at birth such that each nursed on milk containing the opposite isotope. A pup from each litter was euthanized weekly over a 7-week period. Blood plasma was obtained, and organs were isolated typically after flushing with Ringer's buffer. (56)Fe and (57)Fe concentrations were determined for organs and plasma; organ volumes were also determined. Mössbauer spectra of equivalent (57)Fe-enriched samples were used to quantify residual blood in organs; this fraction was excluded from later analysis. Rates of import into brain, spleen, heart, and kidneys were highest during the first 2 weeks of life. In contrast, half of iron in the newborn liver exited during that time, and influx peaked later. Two mathematical models were developed to analyze the import kinetics. The only model that simulated the data adequately assumed that an iron-containing species enters the plasma and converts into a second species and that both are independently imported into organs. Consistent with this, liquid chromatography with an on-line ICP-MS detector revealed numerous iron species in plasma besides transferrin. Model fitting required that the first species, assigned to non-transferrin-bound iron, imports faster into organs than the second, assigned to transferrin-bound-iron. Non-transferrin-bound iron rather than transferrin-bound-iron appears to play the dominant role in importing iron into organs during early development of healthy mice.

Keywords: Iron Metabolism; Mathematical Modeling; Mossbauer Spectroscopy; Plasma; Transferrin.


Figures

FIGURE 1.
FIGURE 1.
Organ volumes (top) and growth rates (bottom) during development. Black, brain; red, liver; blue, heart; cyan, kidneys; green, spleen; and pink, plasma. Plots of α functions were offset by 0.10 day−1 for display.
FIGURE 2.
FIGURE 2.
Mössbauer spectra of organs before and after perfusion. A, flushed brain; B, blood; C, same as A but after subtracting blood contribution (15% spectral intensity); D, flushed liver. Spectra were obtained at 5 K and 0.05 Tesla applied parallel to the gamma radiation. The dashed line shows the high-energy line of the heme doublet. In spectrum B, the heme doublet fit to δ = 0.94 mm/s and ΔEQ = 2.35 mm/s. The heme doublet in spleen required δ = 0.94 mm/s and ΔEQ ≈ 2.32 mm/s (not shown).
FIGURE 3.
FIGURE 3.
Iron-detected liquid chromatograms of mouse blood plasma (A), transferrin (B), ferritin (C), and hemopexin (D). Black lines are data, and red lines are simulations. The blue line is a composite simulation, including, from left to right, ferritin (6% of the iron), transferrin (17%), unidentified protein 1 (UP1, 6%), hemopexin (69%), and unidentified proteins UP2 and UP3 (1% each). UP1 has a molecular mass of 60–80 kDa, whereas UP2 and UP3 have masses < 7 kDa. Trace E is from the same injection of plasma as in A, but detected for copper rather than iron. The only species observed migrated with a mass of 150 kDa; it was assigned to ceruloplasmin.
FIGURE 4.
FIGURE 4.
Concentrations of starting and enriching isotopes of iron in the brain (A and B), liver (C), and plasma (D). Red, blue, and black circles are total, enriching, and starting isotope concentrations, respectively. Solid lines are simulations. A, brain, OCM simulations; B, brain, TCM simulations; C, liver, TCM simulations; D, plasma, TCM simulations.
FIGURE 5.
FIGURE 5.
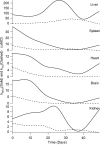
Enrichment percentages into organs and plasma. Black, brain; red, liver; blue, heart; cyan, kidneys; green, spleen; pink, plasma.
FIGURE 6.
FIGURE 6.
Plots of endogenous iron concentrations and simulations for spleen (A), heart (B), and kidneys (C). For each organ, red, blue, and black circles are total, enriching, and starting isotope concentrations ([tFeO], [eFeO], and [sFeO]), respectively. Solid lines are simulations. The top panel shows simulations assuming the OCM, whereas the bottom panel simulations assume the TCM. Data in both top and bottom panels are the same.
FIGURE 7.
FIGURE 7.
OCM (top) and TCM (bottom) describing iron import into mouse organs. For the OCM, enriching and starting isotopes are imported from the gut to the plasma to form species FeT, which is imported into organs through a receptor. The resulting species FeO can be exported. The TCM is similar except that the enriching isotope enters the plasma as a second species FeNT which converts to FeT. Both FeNT and FeT can be imported into organs at independent rates.
FIGURE 8.
FIGURE 8.
kNTO and kTO functions associated with the TCM. The ODE system was piecewise solved using different optimized kNTO and kTO values for each period (supplemental Table S8). These values were fitted with smoothing functions (MATLAB, cftool), yielding the plots shown. The artifactually large value of kTL at 35 days was not included in smoothing.

References

    1. Ganz T. (2013) Systemic iron homeostasis. Physiol. Rev. 93, 1721–1741 - PubMed
    1. Stankiewicz J., Panter S. S., Neema M., Arora A., Batt C. E., Bakshi R. (2007) Iron in chronic brain disorders: Imaging and neurotherapeutic implications. Neurotherapeutics 4, 371–386 - PMC - PubMed
    1. Erikson K. M., Pinero D. J., Connor J. R., Beard J. L. (1997) Regional brain iron, ferritin and transferrin concentrations during iron deficiency and iron repletion in developing rats. J. Nutr. 127, 2030–2038 - PubMed
    1. Siimes M. A., Refino C., Dallman P. R. (1980) Physiological anemia of early development in the rat – characterization of the iron-responsive component. Am. J. Clin. Nutr. 33, 2601–2608 - PubMed
    1. Holmes-Hampton G. P., Chakrabarti M., Cockrell A. L., McCormick S. P., Abbott L. C., Lindahl L. S., Lindahl P. A. (2012) Changing iron content of the mouse brain during development. Metallomics 4, 761–770 - PMC - PubMed

Publication types

MeSH terms

LinkOut - more resources