. 2015 Jan;32(1):229-38.
doi: 10.1093/molbev/msu301. Epub 2014 Nov 3.

A systematic survey of an intragenic epistatic landscape

Affiliations

A systematic survey of an intragenic epistatic landscape

Claudia Bank et al. Mol Biol Evol. 2015 Jan.

Abstract

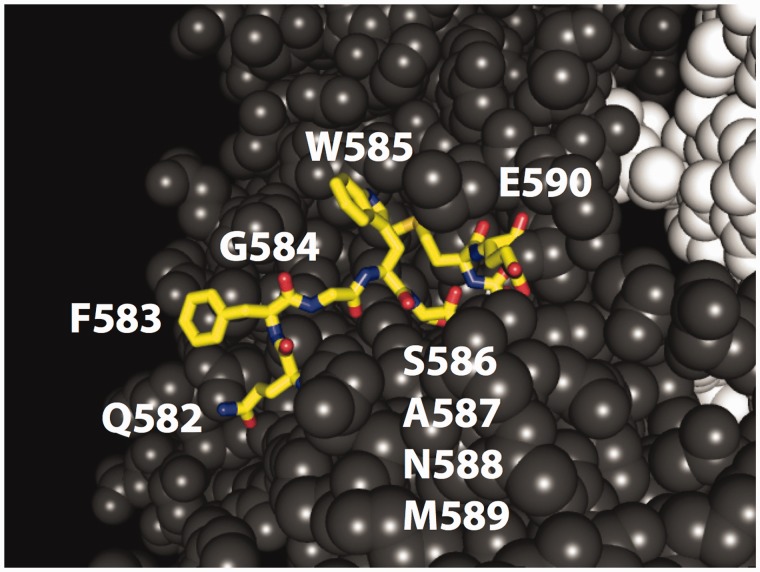
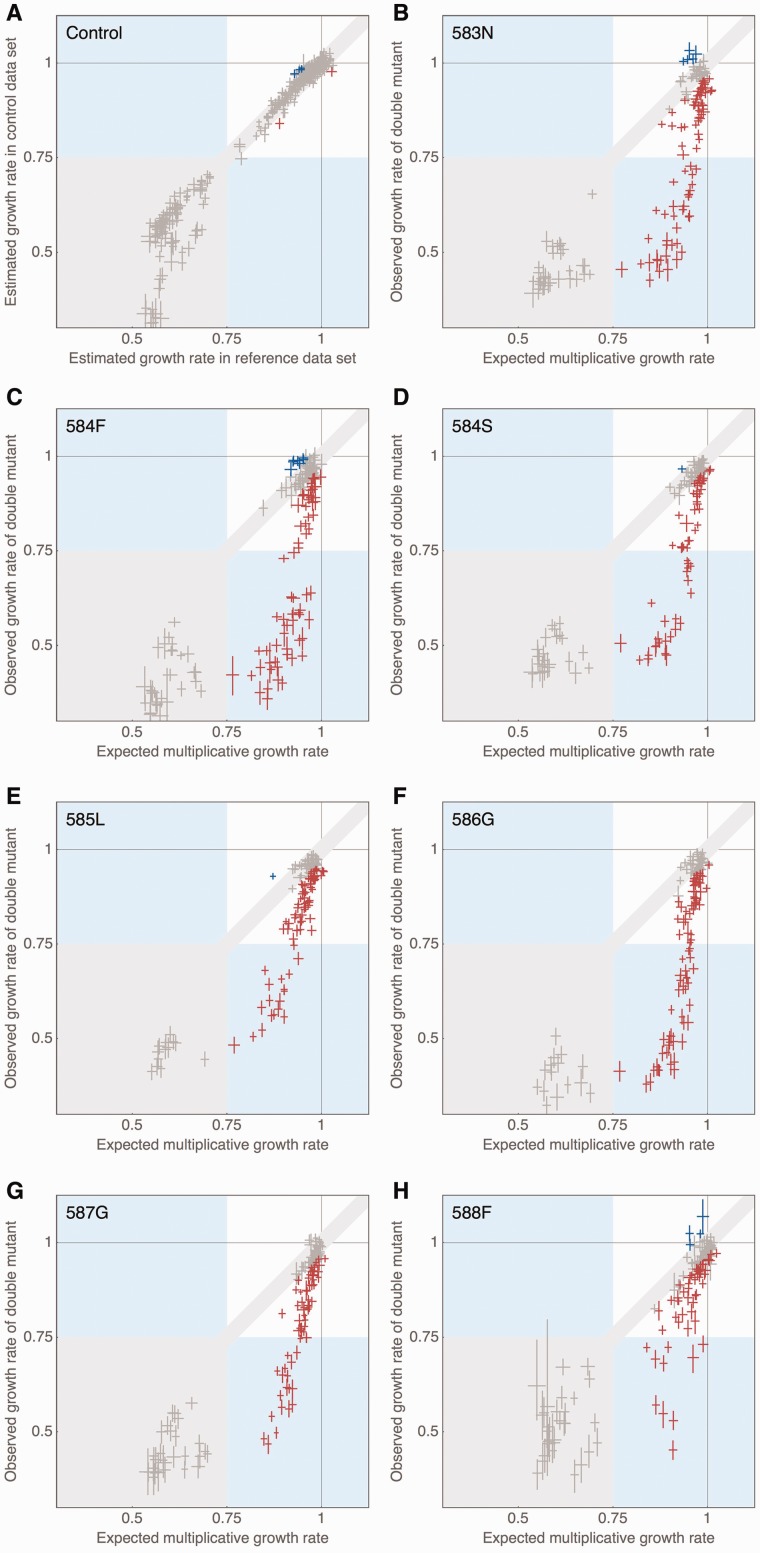
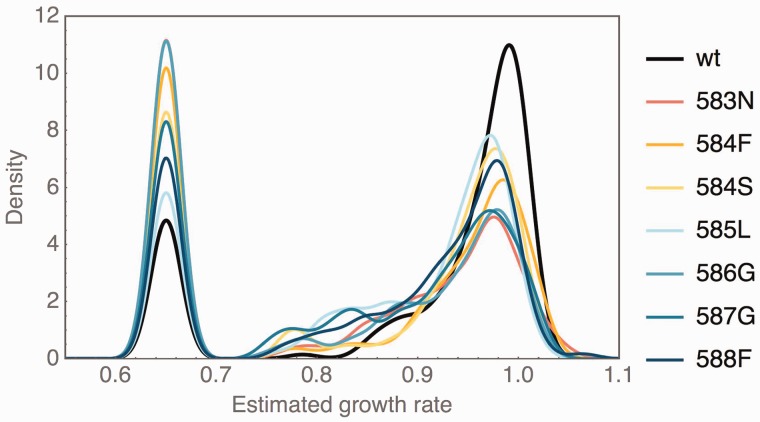
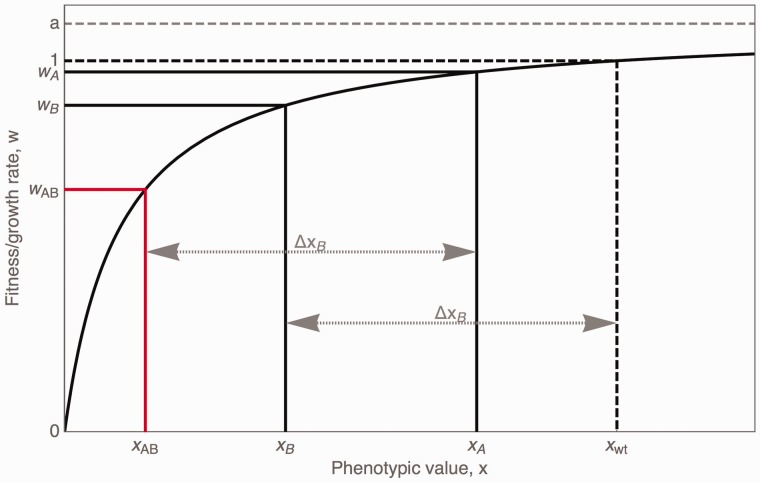
Mutations are the source of evolutionary variation. The interactions of multiple mutations can have important effects on fitness and evolutionary trajectories. We have recently described the distribution of fitness effects of all single mutations for a nine-amino-acid region of yeast Hsp90 (Hsp82) implicated in substrate binding. Here, we report and discuss the distribution of intragenic epistatic effects within this region in seven Hsp90 point mutant backgrounds of neutral to slightly deleterious effect, resulting in an analysis of more than 1,000 double mutants. We find negative epistasis between substitutions to be common, and positive epistasis to be rare--resulting in a pattern that indicates a drastic change in the distribution of fitness effects one step away from the wild type. This can be well explained by a concave relationship between phenotype and genotype (i.e., a concave shape of the local fitness landscape), suggesting mutational robustness intrinsic to the local sequence space. Structural analyses indicate that, in this region, epistatic effects are most pronounced when a solvent-inaccessible position is involved in the interaction. In contrast, all 18 observations of positive epistasis involved at least one mutation at a solvent-exposed position. By combining the analysis of evolutionary and biophysical properties of an epistatic landscape, these results contribute to a more detailed understanding of the complexity of protein evolution.

Keywords: distribution of fitness effects; epistasis; experimental evolution; fitness landscapes.


Figures

F<sc>ig</sc>. 1.
Fig. 1.
Structure of yeast Hsp90 illustrating the region investigated (amino acids 582–590) in yellow, containing wild-type amino acids with varied physical properties and buried and exposed positions as detailed in tables 1 and 2.
F<sc>ig</sc>. 2.
Fig. 2.
(A) Comparison of estimated growth rates between reference and control mutations that was used to determine significance level indicated by light gray area as detailed in Materials and Methods. (B)–(H) Comparison of expected and observed growth rates per anchor mutation, indicating ubiquitous negative epistasis and rare cases of positive epistasis. Data points are represented by crosses indicating the width of their respective 95% credibility intervals. Negatively epistatic interactions are shown in red, positively epistatic interactions in blue. The gray area indicates our limit of detection, as detailed in Materials and Methods.
F<sc>ig</sc>. 3.
Fig. 3.
DFE of single point mutations reachable from the wild type and from each of the anchor mutations, with the most important features being an increased variance of the wild-type-like mode and a much larger proportion of strongly deleterious mutations. DFE are plotted as smoothed histograms with a kernel width of 0.015. Strongly deleterious mutations were binned to 0.65.
F<sc>ig</sc>. 4.
Fig. 4.
Representation of a concave relationship between phenotype and fitness. The fitting procedure is based on a reverse mapping, X(w), of the growth rate of single-step mutations, W(x), under the expectation that phenotypic values interact linearly, hence, xAB=xAΔxB=xA(xwtxB). This yields the expected growth rate of a double mutant, wAB, from the two measured single-step growth rates wA and wB (cf. interactive visualization, Supplementary Material online).
F<sc>ig</sc>. 5.
Fig. 5.
(A) Estimated parameters for the concave shape of the fitness landscape, for Model 1 based on a saturation binding curve, and Model 2 based on a thermodynamic stability curve. Because the best fit for Model 2 consistently estimated a distance to the optimum a (representing the maximum observable improvement over the wild-type growth rate) incompatible with the mutation with the highest observed growth rate in the data set (i.e., the best observed mutation would overshoot the estimated optimum), values are added for a modified version of model 2, here termed Model 2*, that allows only estimates consistent with all observed mutations (i.e., with a ≥ max(wi) − 1, where max(wi) denotes the maximum of all observed growth rates in the respective data set). Anchor mutation 588F is not shown, because parameter estimates diverge, supporting a multiplicative model for this mutation. Estimated distances to the optimum differ between underlying fitness curves, with the stability model yielding much higher values than the thermodynamic model. In the modified model (Model 2*), the estimated distance to the optimum is always the difference between the wild-type growth rate and the highest observed growth rate in the respective data set (i.e., a2* = max(wi) − 1). (B) Errors resulting from a fit to the above-described models, calculated as the minimum Euclidean distance between the estimated curve and the data. Errors are orders of magnitude smaller for the two tested models than for the multiplicative assumption, with the thermodynamic model yielding slightly lower errors than the model based on the saturation-binding curve. Only for the anchor mutation 588F that results in wild-type-like fitness, the multiplicative model yields the best result. Estimates are based on ten samples from the posterior distributions of the estimated growth rates.
F<sc>ig</sc>. 6.
Fig. 6.
(A) Numbers of positively (pos), negatively (neg), and nonepistatic (ns) mutations, distinguished by the number of surface positions involved (strongly deleterious mutants excluded). There are significantly more negative interactions in double mutations involving one core and one surface position than expected by chance (Binomial test, P < 10−5), and in turn more positive (P < 0.005) and nonsignificant (P < 10−6) interactions between two surface positions. (B) Growth rate of mutations on wild type as compared with anchor background (mutations strongly deleterious on wild-type background are excluded). Medians are significantly different (Mann–Whitney test, P < 0.001) for all but two positions. Position 582 is the prominent position exhibiting positive epistasis, whereas mutations at 586 have highly variable effects both on the wt and the anchor background.

References

    1. Abed Y, Pizzorno A, Bouhy X, Boivin G. Role of permissive neuraminidase mutations in influenza A/Brisbane/59/2007-like (H1N1) viruses. PLoS Pathog. 2011;7:e1002431. - PMC - PubMed
    1. Ali M, Roe SM, Vaughan CK, Meyer P, Panaretou B, Piper PW, Prodromou C, Pearl LH. Crystal structure of an Hsp90-nucleotide-p23/Sba1 closed chaperone complex. Nature. 2006;440:1013–1017. - PMC - PubMed
    1. Bank C, Hietpas RT, Wong A, Bolon DN, Jensen JD. A Bayesian MCMC approach to assess the complete distribution of fitness effects of new mutations: uncovering the potential for adaptive walks in challenging environments. Genetics. 2014;196:841–852. - PMC - PubMed
    1. Bateson W. Mendel’s principles of heredity. Cambridge (UK): Cambridge University Press; 1909. Available from: http://www.biodiversitylibrary.org/item/16926.
    1. Beisel CJ, Rokyta DR, Wichman HA, Joyce P. Testing the extreme value domain of attraction for distributions of beneficial fitness effects. Genetics. 2007;176:2441–2449. - PMC - PubMed

Publication types

MeSH terms