

Identification of ubiquinol binding motifs at the Qo-site of the cytochrome bc1 complex
- PMID: 25372183
- PMCID: PMC4297238
- DOI: 10.1021/jp510022w
Identification of ubiquinol binding motifs at the Qo-site of the cytochrome bc1 complex
Abstract
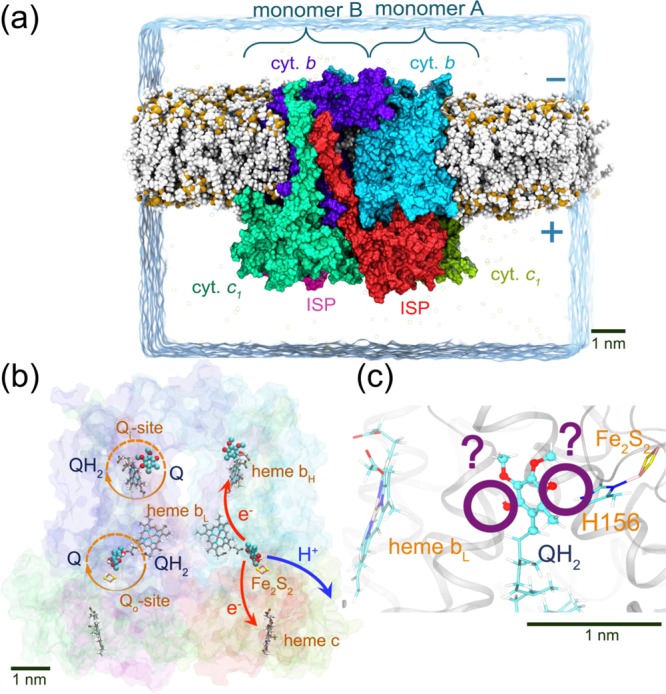
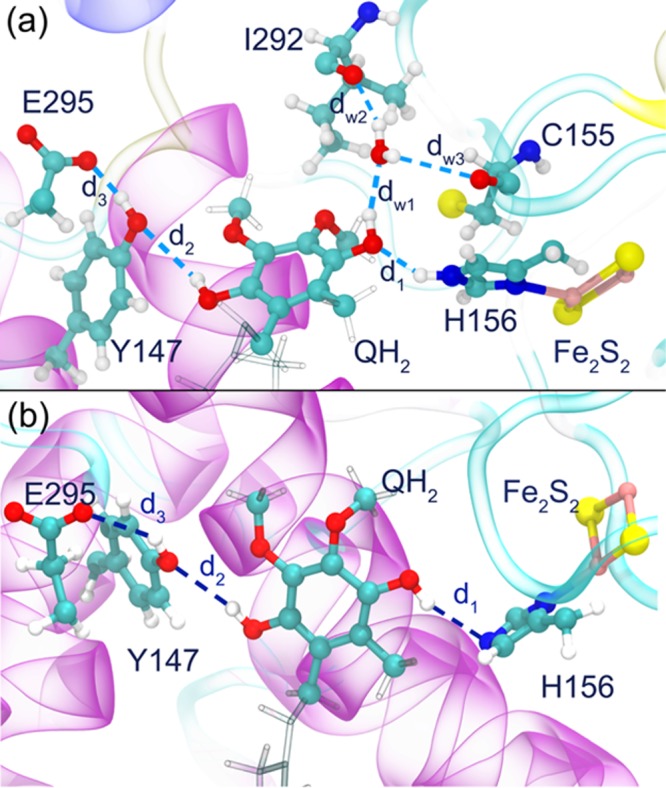
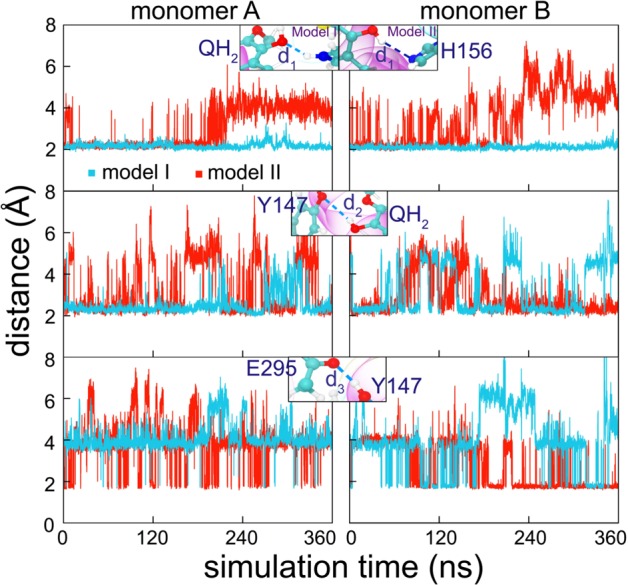
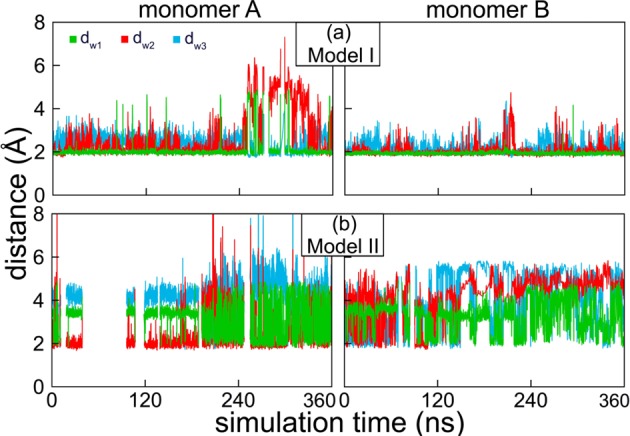
Enzymes of the bc1 complex family power the biosphere through their central role in respiration and photosynthesis. These enzymes couple the oxidation of quinol molecules by cytochrome c to the transfer of protons across the membrane, to generate a proton-motive force that drives ATP synthesis. Key for the function of the bc1 complex is the initial redox process that involves a bifurcated electron transfer in which the two electrons from a quinol substrate are passed to different electron acceptors in the bc1 complex. The electron transfer is coupled to proton transfer. The overall mechanism of quinol oxidation by the bc1 complex is well enough characterized to allow exploration at the atomistic level, but details are still highly controversial. The controversy stems from the uncertain binding motifs of quinol at the so-called Qo active site of the bc1 complex. Here we employ a combination of classical all atom molecular dynamics and quantum chemical calculations to reveal the binding modes of quinol at the Qo-site of the bc1 complex from Rhodobacter capsulatus. The calculations suggest a novel configuration of amino acid residues responsible for quinol binding and support a mechanism for proton-coupled electron transfer from quinol to iron-sulfur cluster through a bridging hydrogen bond from histidine that stabilizes the reaction complex.
Figures
Similar articles
-
Flexibility and Hydration of the Qo Site Determine Multiple Pathways for Proton Transfer in Cytochrome bc1.J Chem Inf Model. 2025 Jun 23;65(12):6184-6197. doi: 10.1021/acs.jcim.5c00655. Epub 2025 Jun 10. J Chem Inf Model. 2025. PMID: 40492973 Free PMC article.
-
The cytochrome b Zn binding amino acid residue histidine 291 is essential for ubihydroquinone oxidation at the Qo site of bacterial cytochrome bc1.Biochim Biophys Acta. 2016 Nov;1857(11):1796-1806. doi: 10.1016/j.bbabio.2016.08.007. Epub 2016 Sep 5. Biochim Biophys Acta. 2016. PMID: 27550309 Free PMC article.
-
Roles in inhibitor recognition and quinol oxidation of the amino acid side chains at positions of cyt b providing resistance to Qo-inhibitors of the bc1 complex from Rhodobacter capsulatus.Mol Microbiol. 1993 Sep;9(5):965-78. doi: 10.1111/j.1365-2958.1993.tb01226.x. Mol Microbiol. 1993. PMID: 7934923
-
Ubiquinol oxidation in the cytochrome bc1 complex: reaction mechanism and prevention of short-circuiting.Biochim Biophys Acta. 2005 Aug 15;1709(1):5-34. doi: 10.1016/j.bbabio.2005.03.009. Epub 2005 Apr 8. Biochim Biophys Acta. 2005. PMID: 16005845 Review.
-
Primary steps in the energy conversion reaction of the cytochrome bc1 complex Qo site.J Bioenerg Biomembr. 1999 Jun;31(3):225-33. doi: 10.1023/a:1005467628660. J Bioenerg Biomembr. 1999. PMID: 10591528 Review.
Cited by
-
Mechanism of the Primary Charge Transfer Reaction in the Cytochrome bc1 Complex.J Phys Chem B. 2016 Nov 10;120(44):11369-11380. doi: 10.1021/acs.jpcb.6b07394. Epub 2016 Oct 12. J Phys Chem B. 2016. PMID: 27661199 Free PMC article.
-
CoQ10 and Mitochondrial Dysfunction in Alzheimer's Disease.Antioxidants (Basel). 2024 Feb 2;13(2):191. doi: 10.3390/antiox13020191. Antioxidants (Basel). 2024. PMID: 38397789 Free PMC article. Review.
-
Different receptor models show differences in ligand binding strength and location: a computational drug screening for the tick-borne encephalitis virus.Mol Divers. 2025 Feb;29(1):281-292. doi: 10.1007/s11030-024-10850-8. Epub 2024 May 13. Mol Divers. 2025. PMID: 38739227 Free PMC article.
-
Atomic Detail Visualization of Photosynthetic Membranes with GPU-Accelerated Ray Tracing.Parallel Comput. 2016 Jul;55:17-27. doi: 10.1016/j.parco.2015.10.015. Parallel Comput. 2016. PMID: 27274603 Free PMC article.
-
Autoantibody Profiling in Lupus Patients using Synthetic Nucleic Acids.Sci Rep. 2018 Apr 3;8(1):5554. doi: 10.1038/s41598-018-23910-5. Sci Rep. 2018. PMID: 29615791 Free PMC article.
References
-
- Mitchell P. D.Nobel Lectures in Chemistry 1971–1980; World Scientific Publishing Co.: Hackensack, NJ, 1993.
-
- Nicholls D. G.; Ferguson S.. Bioenergetics; Academic Press: New York, NY, 2013.
-
- Wikstrom M.; Krab K.; Saraste M. Proton–Translocating Cytochrome Complexes. Annu. Rev. Biochem. 1981, 50, 623–655. - PubMed
-
- Zhang Z.; Huang L.; Shulmeister V. M.; Chi Y.-I.; Kim K. K.; Hung L.-W.; Crofts A. R.; Berry E. A.; Kim S.-H. Electron Transfer by Domain Movement in Cytochrome bc1. Nature 1998, 392, 677–684. - PubMed
-
- Crofts A. R.; Berry E. A. Structure and Function of the Cytochrome bc1 Complex of Mitochondria and Photosynthetic Bacteria. Curr. Opin. Struct. Biol. 1998, 8, 501–509. - PubMed
Publication types
MeSH terms
Substances
Grants and funding
LinkOut - more resources
Full Text Sources
Other Literature Sources
