

HemI: a toolkit for illustrating heatmaps
- PMID: 25372567
- PMCID: PMC4221433
- DOI: 10.1371/journal.pone.0111988
HemI: a toolkit for illustrating heatmaps
Abstract
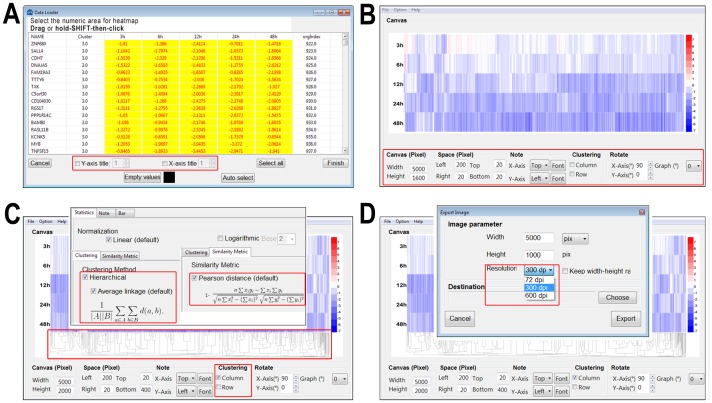
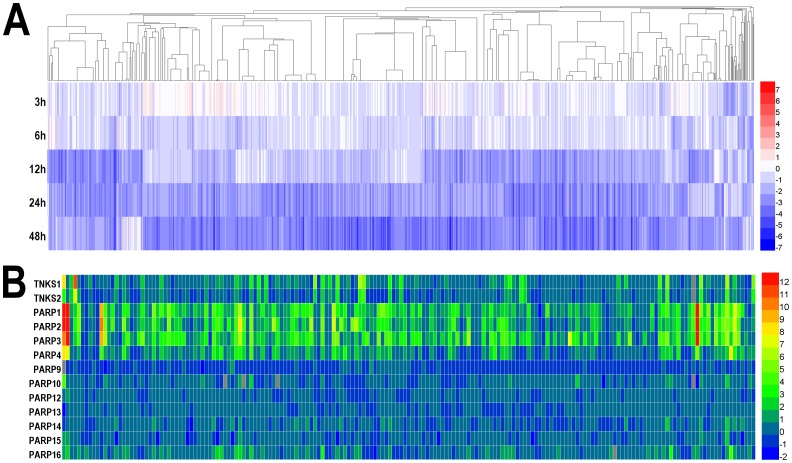
Recent high-throughput techniques have generated a flood of biological data in all aspects. The transformation and visualization of multi-dimensional and numerical gene or protein expression data in a single heatmap can provide a concise but comprehensive presentation of molecular dynamics under different conditions. In this work, we developed an easy-to-use tool named HemI (Heat map Illustrator), which can visualize either gene or protein expression data in heatmaps. Additionally, the heatmaps can be recolored, rescaled or rotated in a customized manner. In addition, HemI provides multiple clustering strategies for analyzing the data. Publication-quality figures can be exported directly. We propose that HemI can be a useful toolkit for conveniently visualizing and manipulating heatmaps. The stand-alone packages of HemI were implemented in Java and can be accessed at http://hemi.biocuckoo.org/down.php.
Conflict of interest statement
Figures
References
-
- Koschmieder A, Zimmermann K, Trissl S, Stoltmann T, Leser U (2012) Tools for managing and analyzing microarray data. Brief Bioinform 13: 46–60. - PubMed
-
- Collison M, Hirt RP, Wipat A, Nakjang S, Sanseau P, et al. (2012) Data mining the human gut microbiota for therapeutic targets. Brief Bioinform 13: 751–768. - PubMed
-
- Saldanha AJ (2004) Java Treeview–extensible visualization of microarray data. Bioinformatics 20: 3246–3248. - PubMed
-
- Seo J, Gordish-Dressman H, Hoffman EP (2006) An interactive power analysis tool for microarray hypothesis testing and generation. Bioinformatics 22: 808–814. - PubMed
Publication types
MeSH terms
LinkOut - more resources
Full Text Sources
Other Literature Sources
