. 2014 Nov 5;9(11):e112364.
doi: 10.1371/journal.pone.0112364. eCollection 2014.

A novel gain-of-function mutation of the proneural IRX1 and IRX2 genes disrupts axis elongation in the Araucana rumpless chicken

Affiliations

A novel gain-of-function mutation of the proneural IRX1 and IRX2 genes disrupts axis elongation in the Araucana rumpless chicken

Nowlan H Freese et al. PLoS One. .

Abstract

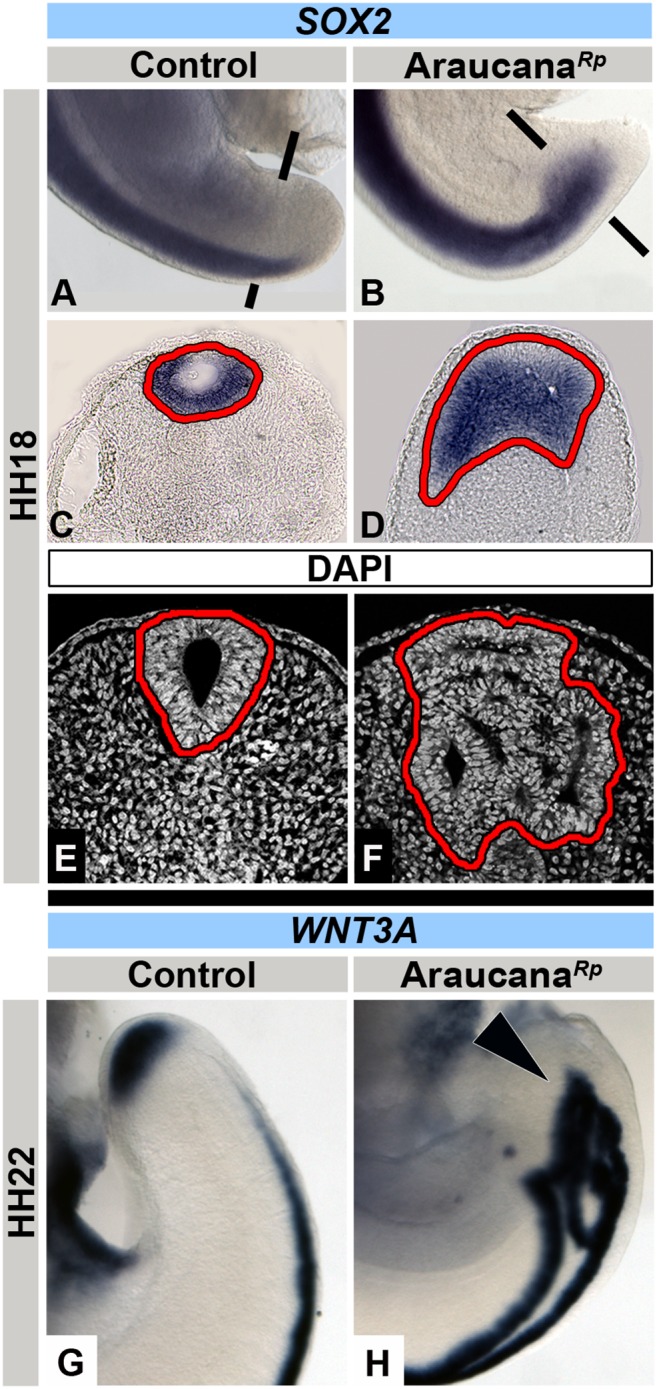
Axis elongation of the vertebrate embryo involves the generation of cell lineages from posterior progenitor populations. We investigated the molecular mechanism governing axis elongation in vertebrates using the Araucana rumpless chicken. Araucana embryos exhibit a defect in axis elongation, failing to form the terminal somites and concomitant free caudal vertebrae, pygostyle, and associated tissues of the tail. Through whole genome sequencing of six Araucana we have identified a critical 130 kb region, containing two candidate causative SNPs. Both SNPs are proximal to the IRX1 and IRX2 genes, which are required for neural specification. We show that IRX1 and IRX2 are both misexpressed within the bipotential chordoneural hinge progenitor population of Araucana embryos. Expression analysis of BRA and TBX6, required for specification of mesoderm, shows that both are downregulated, whereas SOX2, required for neural patterning, is expressed in ectopic epithelial tissue. Finally, we show downregulation of genes required for the protection and maintenance of the tailbud progenitor population from the effects of retinoic acid. Our results support a model where the disruption in balance of mesoderm and neural fate results in early depletion of the progenitor population as excess neural tissue forms at the expense of mesoderm, leading to too few mesoderm cells to form the terminal somites. Together this cascade of events leads to axis truncation.


Conflict of interest statement

Competing Interests: The authors have declared that no competing interests exist.

Figures

Figure 1
Figure 1. Skeletal analysis shows AraucanaRp lack caudal vertebrae.
Adult AraucanaRp male and female birds shown in a composite image (A) (courtesy of Fritz Ludwig). Note the characteristic rounded rump, lacking tail structures. Skeletons of control (B) and AraucanaRp (C) birds (courtesy of the ACA). The free vertebrae and pygostyle are missing in the AraucanaRp skeleton (arrow). E18 embryos stained with Alcian Blue in control (D) and AraucanaRp (E). AraucanaRp embryos lack the free vertebrae and pygostyle. Arrowheads indicate lateral processes. Vertebral elements are numbered from the first free vertebrae (1–5). The more posterior vertebral elements (6–11) fuse to form the mature pygostyle after hatching. FV-free caudal vertebrae, P-pygostyle, S-sacral vertebrae.
Figure 2
Figure 2. AraucanaRp embryo tailbud is truncated and downregulates TBX6 and BRA.
Whole mount tails in lateral view, with posterior at the bottom, dorsal to the left (A–F). At HH16, the angle of tail curvature is narrower in controls (A) compared to AraucanaRp embryos (B-arrowhead). By HH18, the reduced length and pointed shape of the AraucanaRp tail is dramatic (D) compared to controls (C). The control tail has curved ventrally by HH20 (E), whereas the AraucanaRp tail has failed to extend (F). Asterisks denote level of posterior-most somite pair. Somite formation in AraucanaRp is near the tip of the tail (F-asterisk). Expression patterns of TBX6 (G–L) and BRA (M–R) during tailbud development. ISH expression of TBX6 in control (G,I,K) and AraucanaRp (H,J,L) at HH15, 17 and 20. Inset in G and H are transverse sections of respective embryos at level of tailbud, asterisk denotes undifferentiated mesenchyme. Note downregulation of TBX6 expression in AraucanaRp (arrowheads) compared to controls. ISH expression of BRA in control (M,O,Q) and AraucanaRp (N,P,R) at HH16, 17, and 20. Inset in M and N are transverse sections of respective embryos at level of tailbud. Note loss of BRA expression in tailbud mesenchyme in AraucanaRp (arrowheads) versus controls.
Figure 3
Figure 3. AraucanaRp form fewer somites.
MESO1 expression in control (A,C) and AraucanaRp (B,D) embryos at HH18-19. Note downregulation of MESO1 in HH19 AraucanaRp (D-arrowhead) compared to controls (C-arrowhead). DACT2 expression in control (E,G) and AraucanaRp (F,H) from HH19-20. Inset in G and H are sagittal sections through the paraxial mesoderm from respective embryo. Note decrease in somites labeled by DACT2 at HH20 in AraucanaRp (H-arrowhead) compared to control (H-arrowhead). Anterior up in whole mount and section insets. (I) Graph showing number of somites compared to embryonic stage (HH stages 16–25). AraucanaRp have significantly fewer somites beginning at HH20 (T-test, asterisk marks p<0.01) than controls. Control-Black, AraucanaRp-Grey.
Figure 4
Figure 4. IRX1 and IRX2 are misexpressed in AraucanaRp tailbud.
IRX1 expression pattern (A–F,M–P). (A,C,E) Control embryos express IRX1 in the neural tube. IRX1 expression in controls matches AraucanaRp at HH14 (A,B), but is misexpressed in AraucanaRp tailbud at HH15 (D-arrowhead). Normal expression at level of somites is within neural tube (transverse section, M). Misexpression in AraucanaRp can be seen at the level of the chordoneural hinge (transverse section-N and sagittal section-P) compared to expression in HH15 control (sagittal section-O). Misexpression is maintained through HH16 in AraucanaRp (F-arrow) as compared to control (E). IRX2 expression pattern (G–L,Q). (G,I,K) Control embryos do not express IRX2 in the tailbud. No difference in expression between controls and AraucanaRp seen at HH14 (G,H). IRX2 is misexpressed in HH15 (J-arrowhead) and HH16 (L-arrowhead) AraucanaRp. Transverse section of IRX2 (Q) shows expression similar to IRX1 at level of chordoneural hinge. A–L - anterior to top. M,N,Q - dorsal to top. O,P - dorsal to left, anterior to top. Abbreviations: nt-neural tube, s-somite, n-notochord.
Figure 5
Figure 5. Location of small variants associated with rumplessness in the 740 kb critical region.
Top: positional map of the 740 kb critical region located on Gallus gallus chromosome 2 (GGA2). Location of IRX1 and IRX2 is indicated, with numbers of small variants (SV) (SNPs, insertions and deletions) and their general location and frequency indicated. No small variants were found within IRX1 or IRX2 coding sequence. Bottom: relative position of SNPs used to build new critical interval within the established AraucanaRp haplotype block. Rumpless AraucanaRp haplotype in blue, with associated SNPs, haplotype from tailed Araucana in yellow. New critical interval defined by RB1 tailed Araucana highlighted by dashed lines.
Figure 6
Figure 6. Ectopic neural tissue in AraucanaRp embryo tailbud.
Wholemount images and respective transverse sections showing ISH expression of SOX2 in control (A,C) and AraucanaRp (B,D) embryos at HH18. Note the presence of ectopic neural tissue and lumens in AraucanaRp (highlighted in red) (D) compared to single neural tube and lumen in control (C). DAPI stained transverse sections of control (E) and AraucanaRp (F) embryo tailbud, highlighting (in red) differences in number of neural tube lumens. Wholemount images of WNT3A expression in control (G) and AraucanaRp (H). Arrowhead denotes ectopic expression of WNT3A in ectopic neural tubes of Araucana (H). Anterior to top in wholemount images. Dorsal to top in transverse sections. Sections taken at approximate level of black bars.
Figure 7
Figure 7. ISH expression pattern of RALDH2, CYP26A1, WNT3A and FGF8 during tail development.
RALDH2 expression in control (A) and AraucanaRp (B) embryos at HH18. Note in AraucanaRp the truncated tail at HH18 coupled with the close expression of RALDH2 in the formed somites. Posterior-most expression of RALDH2 is marked with arrowhead. CYP26A1 expression in control (C) and AraucanaRp (D) embryos at HH16. Note the lack of expression in AraucanaRp tailbud (arrowhead). WNT3A expression in control (E,G) and AraucanaRp (F, H) embryos from HH17-18. Note lack of expression in tailbud mesenchyme in AraucanaRp (arrowheads). FGF8 expression in control (I,K) and AraucanaRp (J,L) embryos from HH stages 17–18. Note the downregulation of expression in tailbud beginning at HH17 in AraucanaRp (arrowheads). Insets are transverse sections at level of tailbud. Anterior is top in whole mount images. Dorsal is top in transverse section insets. Sections were taken at approximate level of black bars.
Figure 8
Figure 8. Role of proliferation and apoptosis in AraucanaRp tailbud development.
EdU labeled proliferating cells in tailbud sagittal sections at HH15-20 in controls. (A,C,E,G) and AraucanaRp (B,D,F,H) embryo tailbud. Green is EdU labeled proliferating cells, red is TO-PRO-3 Iodide labeled nuclei. Arrows denote decreased regions of proliferation in AraucanaRp compared to controls. (I) Quantification of all TBM cells for control and AraucanaRp labeled with TO-PRO-3 Iodide. (J) Quantification of proliferating TBM cells for control and AraucanaRp labeled with EdU. TUNEL labeled apoptotic cells in tailbud sagittal sections from HH stages 15–20 of controls. (K,M,O,Q) and AraucanaRp (L,N,P,R) embryo tailbud. Red is TUNEL labeled apoptotic cells, blue is Hoechst labeled nuclei. Arrows denote increased areas of apoptosis in AraucanaRp compared to controls. (S) Quantification of apoptotic TUNEL labeled cells in control and AraucanaRp TBM. AraucanaRp have significantly more TUNEL positive cells beginning at HH17 than controls. T-test, asterisk marks p<0.05. Control-Black, AraucanaRp-Grey. Same embryo (two different sections) was used for both TUNEL and EdU labeling. Anterior is towards the top, dorsal is towards the left in all sections.
Figure 9
Figure 9. Timeline of changes in proliferation, apoptosis, and gene expression in AraucanaRp.
Visual timeline summarizing changes in proliferation, apoptosis, and gene expression within AraucanaRp embryo tail compared to control embryos. Yellow is increased expression/prevalence, and blue is decreased expression/prevalence. The WNT3A summary represents change in expression observed in posterior tailbud, not neural tube.

Similar articles

Cited by

References

    1. Schoenwolf GC (1979) Histological and ultrastructural observations of tail bud formation in the chick embryo. The Anatomical record 193: 131–148. - PubMed
    1. Schoenwolf GC (1981) Morphogenetic processes involved in the remodeling of the tail region of the chick embryo. Anatomy and Embryology 162: 183–197. - PubMed
    1. Catala M, Teillet M-A, Le Douarin NM (1995) Organization and development of the tail bud analyzed with the quail-chick chimaera system. Mechanisms of Development 51: 51–65. - PubMed
    1. Cambray N, Wilson V (2002) Axial progenitors with extensive potency are localised to the mouse chordoneural hinge. Development 129: 4855–4866. - PubMed
    1. Cambray N, Wilson V (2007) Two distinct sources for a population of maturing axial progenitors. Development 134: 2829–2840. - PubMed

Publication types

LinkOut - more resources