Review
. 2014 Nov;70(Pt 11):1445-67.
doi: 10.1107/S2053230X14019670. Epub 2014 Oct 31.

Optimization of crystallization conditions for biological macromolecules

Affiliations
Review

Optimization of crystallization conditions for biological macromolecules

Alexander McPherson et al. Acta Crystallogr F Struct Biol Commun. 2014 Nov.

Abstract

For the successful X-ray structure determination of macromolecules, it is first necessary to identify, usually by matrix screening, conditions that yield some sort of crystals. Initial crystals are frequently microcrystals or clusters, and often have unfavorable morphologies or yield poor diffraction intensities. It is therefore generally necessary to improve upon these initial conditions in order to obtain better crystals of sufficient quality for X-ray data collection. Even when the initial samples are suitable, often marginally, refinement of conditions is recommended in order to obtain the highest quality crystals that can be grown. The quality of an X-ray structure determination is directly correlated with the size and the perfection of the crystalline samples; thus, refinement of conditions should always be a primary component of crystal growth. The improvement process is referred to as optimization, and it entails sequential, incremental changes in the chemical parameters that influence crystallization, such as pH, ionic strength and precipitant concentration, as well as physical parameters such as temperature, sample volume and overall methodology. It also includes the application of some unique procedures and approaches, and the addition of novel components such as detergents, ligands or other small molecules that may enhance nucleation or crystal development. Here, an attempt is made to provide guidance on how optimization might best be applied to crystal-growth problems, and what parameters and factors might most profitably be explored to accelerate and achieve success.

Keywords: X-ray diffraction; additives; crystal growth; nucleation; pH; precipitants; proteins; strategy.


Figures

Figure 1
Figure 1
Crystals obtained from an initial screening matrix are usually unsuitable for X-ray data collection because of insufficient size, thin plate or needle morphologies, because they grow as multi-crystals and inseparable clusters or because they display obvious defects such as cracks and fissures. Although data of marginal quality may occasionally be obtained even from crystals such as these using, for example, synchrotron microbeams, they cannot provide the high-quality data that assure an accurate and precisely determined structure. The macromolecular crystals shown here are from (a, b) pig heart citrate synthase, (c, d) bovine superoxide dismutase, (e) apotransferrin, (f) cow milk α-lactalbumin, (g, h) proteinase K, (i, j) rabbit muscle creatine kinase, (k) yeast hexokinase, (l) Bence–Jones protein KWR, (m) xylanase and (n) bovine RNase A.
Figure 2
Figure 2
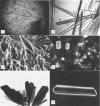
Additional examples of protein, nucleic acid and virus crystals that demand optimization once initial conditions have been identified from screening matrixes. The protein crystals are of (a) yeast phenylalanine tRNA, (b) human hemoglobin, (c) pig pancreas α-amylase, (d) papain, (e) rabbit serum albumin, (f) orthorhombic thaumatin, (g) tetragonal thaumatin, (h) Brome mosaic virus, (i) Escherichia coli leucine tRNA, (j) soybean trypsin inhibitor, (k) bacterial α-amylase, (l) Candida lipase, (m, n) cow milk β-lactoglobulin and (o) sweet potato β-amylase.
Figure 3
Figure 3
Schematic illustration of the successive grid search strategy for protein crystallization redrawn from Cox & Weber (1988 ▶). On the left, components of the grid search are displayed separately. The bottom square shows the variation in pH across the columns. The square above it shows the variation in precipitant concentration in the rows. The combination of these two layers produces the pH versus precipitant grid that serves as the basis for the two-dimensional crystallization approach. Fixed concentrations of other reagents can be added onto this grid as indicated by the upper squares labeled 1 and 2. The diagram on the right illustrates how solution parameters are chosen using this strategy. Broad screen experiments (shown at the bottom) are set up using three different precipitating agents. Tight ranges of pH and precipitant concentration are centered about the conditions in the droplet yielding crystals.
Figure 4
Figure 4
Twinned crystals are observed for (a) cubic canavalin, (b) porcine α-amylase, (c) Abrus precatorius protein toxin and (d) porcine trypsin. These are all obvious cases of twinning, where re-entry angles are evident in (a), spiral arrangements in (c) and (d) and overlapping scales in (b).
Figure 5
Figure 5
Crystals of (a) hexagonal canavalin, (b) hexagonal Turnip yellow mosaic virus, (c) prismatic hexagonal concanavalin B and (d) rhombohedral canavalin. The crystals in (a) and (c) exhibit severe hollows at their growth ends and the crystal in (b) exhibits apparent re-entry angles. These are, however, all perfect untwinned single crystals; the abnormalities are owing to transport processes of molecules in their mother liquors. The otherwise perfect appearing crystal of canavalin in (d) is, however, merohedrally twinned with a near 50%:50% ratio so that its true R3 space group produces R32 symmetry in diffraction patterns.
Figure 6
Figure 6
Exploring drop ratios. These different drop ratios are plotted to show the different initial and final protein and precipitant concentrations, as well as the unique equilibration path.
Figure 7
Figure 7
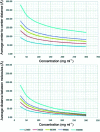
Above is a plot of the average center-to-center distances of five proteins of molecular masses as displayed at the bottom as a function of protein concentration in mg ml−1. The proteins are as follows: 12.4 kDa, ribonuclease A; 34.6 kDa, pepsin; 66.4 kDa, bovine serum albumin; 99.9 kDa, DNA ligase; 330 kDa, fibrinogen. Below is a plot of the average surface-to-surface distance for the same set of proteins as a function of protein concentration.
Figure 8
Figure 8
Each curve in the diagram describes the solubility (as its log) of a typical protein, here enolase, as a function of the concentration of a specific salt (from Cohn & Ferry, 1943 ▶). Even though equivalent concentrations of salts having the same valences produce the same ionic strength, the curves differ markedly, illustrating the specific ion effects that a salt imposes on a protein. It is therefore necessary to evaluate the effects of at least several salts on the crystallization of a protein.
Figure 9
Figure 9
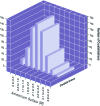
Histogram showing the number of successful protein crystallizations as a function of ammonium sulfate concentration.
Figure 10
Figure 10
Histogram showing the number of successful protein crystallizations as a function of methyl pentanediol (MPD) concentration.
Figure 11
Figure 11
Histogram showing the number of successful protein crystallizations as a function of polyethylene glycol 6000 concentration.
Figure 12
Figure 12
This figure shows the pH intervals and associated buffers over which crystals were obtained for eight proteins. The crystallization was buffer-specific for several of the samples even though several buffers were used with overlapping pH ranges. Furthermore, as is evident here, one protein, papain, exhibited more than one pH interval for crystallization, reflecting its multiple pH-dependent solubility minima.
Figure 13
Figure 13
Shown here are the electrostatic surfaces of the complementarity-defining regions of two different Fabs having the same antigen (Larson et al., 2005 ▶). Blue denotes positive field, red negative field and white neutral. As the pH is changed to more acidic or more basic values, the entire electrostatic surface would change as well. Because protein molecules interact and associate through their electrostatic fields, the formation of crystals may be extremely sensitive to pH changes
Figure 14
Figure 14
Distribution of the crystallization pH and corresponding distribution of the isoelectric point of proteins. The blue curve shows that the peak of the pH distribution around 7.4 falls directly into the gap between the modes of the bimodal pI distribution (right panel). Detailed pairwise analysis has shown that acidic proteins prefer to crystallize above their pI and basic proteins below their pI. The sum of the binned pH distribution produces the resulting overall distribution shown in the left panel.
Figure 15
Figure 15
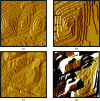
A series of four successive atomic force microscopy images of the surface of a growing phenylalanine tRNA crystal showing the transformation of growth mechanisms (Malkin et al., 1995 ▶) as the supersaturation is increased. The temperature was incrementally decreased to produce an increase in the supersaturation of the mother liquor. The initial temperature in (a) was 17°C, with increments of −2°C in (b)–(d). In (a), at the lowest supersaturation, the growth is dominated by screw dislocations of considerable variety and which produces regular, ordered growth. As the supersaturation is increased in (b) the screw dislocations begin to degrade and in (c) growth is now dominated by two-dimensional nucleation on the surface. At the highest supersaturation in (d), three-dimensional nuclei and roughened two-dimensional nuclei are present along with macrosteps. The growth in (d) is far less orderly and contains more defects then in (a). The scan areas are (a) and (b) 23 × 23 nm, (c) 20 × 20 nm and (d) 34 × 34 nm.
Figure 16
Figure 16
Lattice contacts between protein molecules in a crystal may sometimes be increased or enhanced by the inclusion of conventional small molecules, the so-called ‘silver bullets’, that bridge between the macromolecules. In this illustration a molecule of trimesic acid is seen in the interface between two molecules of protein (green and pink) and links them by forming hydrogen bonds to each through its three carboxyl groups. (a) shows the superposition of the trimesic acid molecule on the difference electron density, while (b) indicates the hydrogen bonds formed to protein molecules in the lattice.
Figure 17
Figure 17
Illustrations of the heterogeneous nucleation of macromolecule crystals on various surfaces: (a) shows rhombohedral canavalin crystals growing on a fiber from a paper tissue, (b) shows hexagonal crystals of a gene 5 protein–DNA complex growing on a fiber of unknown provenance, (c) shows a cubic crystal of Satellite tobacco mosaic virus that nucleated on a sintered glass surface and (d) shows a crystal of tetragonal lysozyme that has nucleated and grown from a mineral particle.
Figure 18
Figure 18
An array of protein crystals obtained from an initial screen of crystallization conditions showing the variation in quality and size that is commonly obtained. Some of the crystals are sufficient for immediate data collection, such as the lysozyme, porcine trypsin and lactalbumin crystals. They require little if any optimization. Others are too small, such as those of Satellite tobacco mosaic virus and Turnip yellow mosaic virus, and others still have morphologies as well as sizes that make them unsuitable for X-ray data collection. The latter may require committed optimization efforts.
Figure 19
Figure 19
Illustration of the strategy by which crystals of greater size or improved habit were obtained through fine-slicing the pH limits at which crystals do/do not grow. The fine slicing should be in intervals of 0.1 pH units and should be carried out with several different buffers.
Figure 20
Figure 20
Crystals of improved size and morphology were obtained by fine-slicing the pH limits in contrast to those obtained at the center of their pH range. Crystals are shown of concanavalin B at (a) pH 7.5 and (b) pH 6.2, of a cytochrome c at (c) pH 7.0 and (d) pH 8.7 and of a fungal lipase at (e) pH 7.2 and (f) pH 8.6.
Figure 21
Figure 21
If a macromolecular crystal such as the Satellite tobacco mosaic virus crystal shown here is etched by exposing it for some time to an undersaturated solution so that it experiences some limited dissolution, then many interior faults and defects appear. These include not only planar defects and domain boundaries, but also include microcrystals and other large impurities such as dust particles.

References

    1. Abergel, C. (2004). Spectacular improvement of X-ray diffraction through fast desiccation of protein crystals. Acta Cryst. D60, 1413–1416. - PubMed
    1. Adams, M. J., Haas, D. J., Jeffery, B. A., McPherson, A., Mermall, H. L., Rossmann, M. G., Schevitz, R. W. & Wonacott, A. J. (1969). Low resolution study of crystalline l-lactate dehydrogenase. J. Mol. Biol. 41, 159–188. - PubMed
    1. Adawy, A., Rebuffet, E., Törnroth-Horsefield, S., de Grip, W. J., van Enckevort, W. J. P. & Vlieg, E. (2012). High resolution protein crystals using an efficient convection-free geometry. Cryst. Growth Des. 13, 775–781.
    1. Arakawa, T. & Timasheff, S. N. (1985). Calculation of the partial specific volume of proteins in concentrated salt and amino acid solutions. Methods Enzymol. 117, 60–65. - PubMed
    1. Astier, J.-P. & Veesler, S. (2008). Using temperature to crystallize proteins: a mini-review. Cryst. Growth Des. 8, 4215–4219.

MeSH terms

Substances