

Genome-wide association mapping for kernel and malting quality traits using historical European barley records
- PMID: 25372869
- PMCID: PMC4221631
- DOI: 10.1371/journal.pone.0110046
Genome-wide association mapping for kernel and malting quality traits using historical European barley records
Abstract
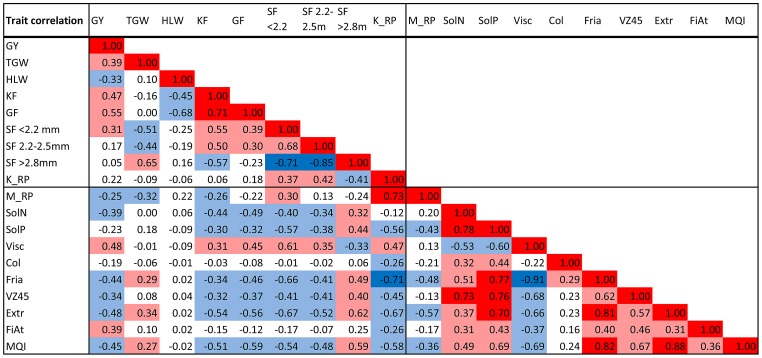
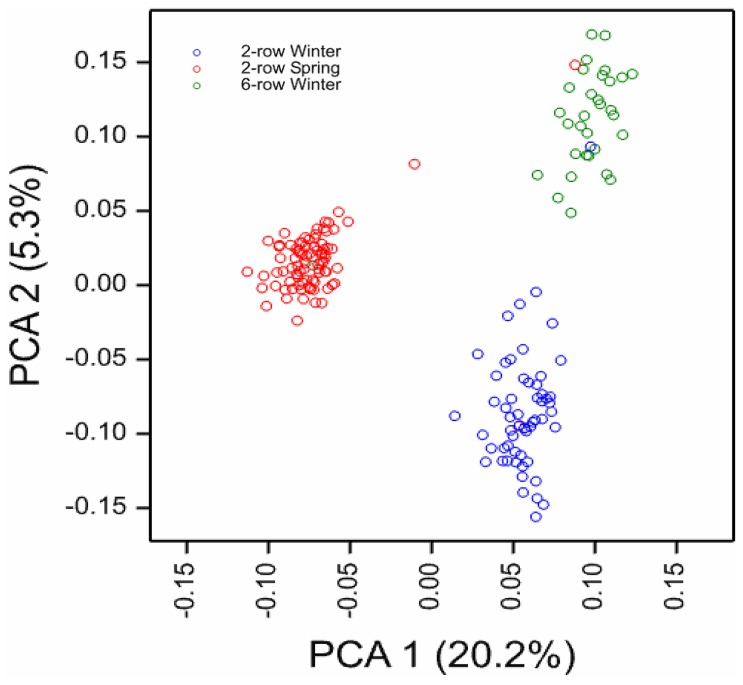
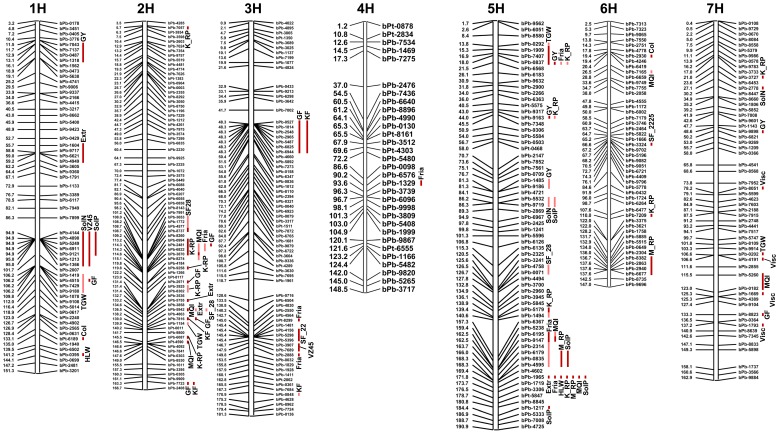
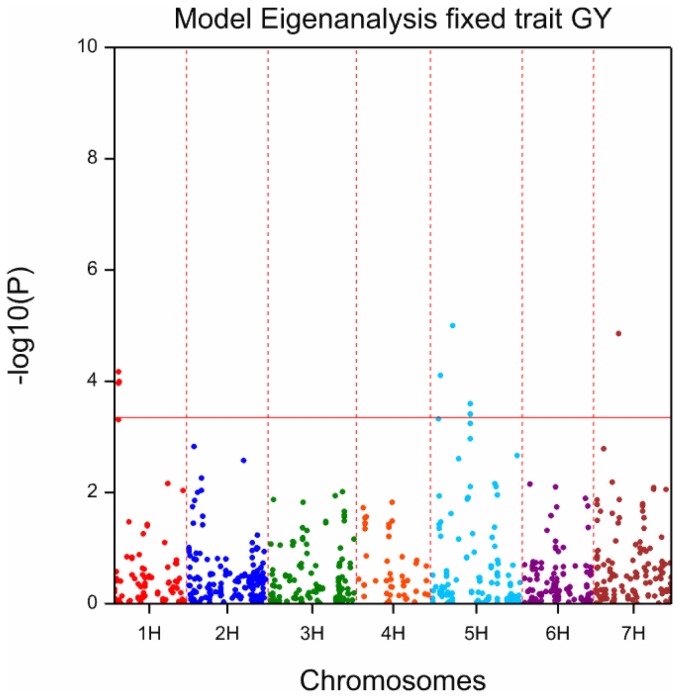
Malting quality is an important trait in breeding barley (Hordeum vulgare L.). It requires elaborate, expensive phenotyping, which involves micro-malting experiments. Although there is abundant historical information available for different cultivars in different years and trials, that historical information is not often used in genetic analyses. This study aimed to exploit historical records to assist in identifying genomic regions that affect malting and kernel quality traits in barley. This genome-wide association study utilized information on grain yield and 18 quality traits accumulated over 25 years on 174 European spring and winter barley cultivars combined with diversity array technology markers. Marker-trait associations were tested with a mixed linear model. This model took into account the genetic relatedness between cultivars based on principal components scores obtained from marker information. We detected 140 marker-trait associations. Some of these associations confirmed previously known quantitative trait loci for malting quality (on chromosomes 1H, 2H, and 5H). Other associations were reported for the first time in this study. The genetic correlations between traits are discussed in relation to the chromosomal regions associated with the different traits. This approach is expected to be particularly useful when designing strategies for multiple trait improvements.
Conflict of interest statement
Figures

References
-
- Fischbeck G (1992) Barley cultivar development in Europe. Success in the past and possible changes in the future. Barley Genetics VI Munksgaard, Copenhagen. 887–901.
-
- Han F, Romagosa I, Ullrich SE, Jones BL, Hayes PM, et al. (1997) Molecular marker-assisted selection for malting quality traits in barley. Mol Breed 3: 427–437.
-
- Romagosa I, Han F, Ullrich SE, Hayes PM, Wesenberg DM (1999) Verification of yield QTL through realized molecular marker-assisted selection responses in barley cross Mol Breed. 5: 143–152.
-
- Dreher K, Khairallah M, Ribaut JM, Morris M (2003) Money matters (I): costs of field and laboratory procedures associated with conventional and marker-assisted maize breeding at CIMMYT. Mol Breed 11: 221–234.
-
- Morris M, Dreher K, Ribaut JM, Khairallah M (2003) Money matters (II) costs of maize inbred line conversion schemes at CIMMYT using conventional and marker-assisted selection.
Publication types
MeSH terms
LinkOut - more resources
Full Text Sources
Other Literature Sources
