. 2015 Feb;25(2):189-200.
doi: 10.1101/gr.177121.114. Epub 2014 Nov 4.

Large transcription units unify copy number variants and common fragile sites arising under replication stress

Affiliations

Large transcription units unify copy number variants and common fragile sites arising under replication stress

Thomas E Wilson et al. Genome Res. 2015 Feb.

Abstract

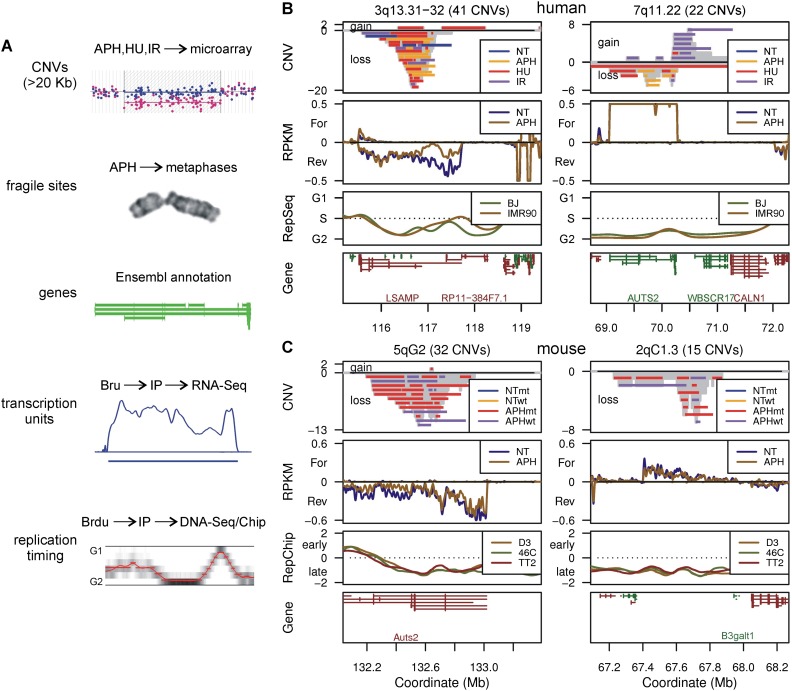
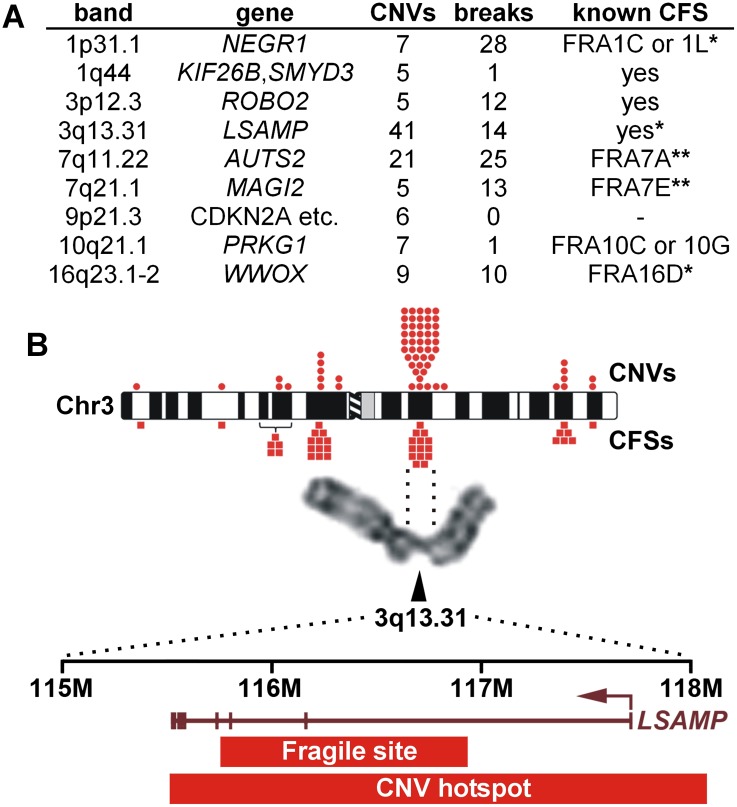
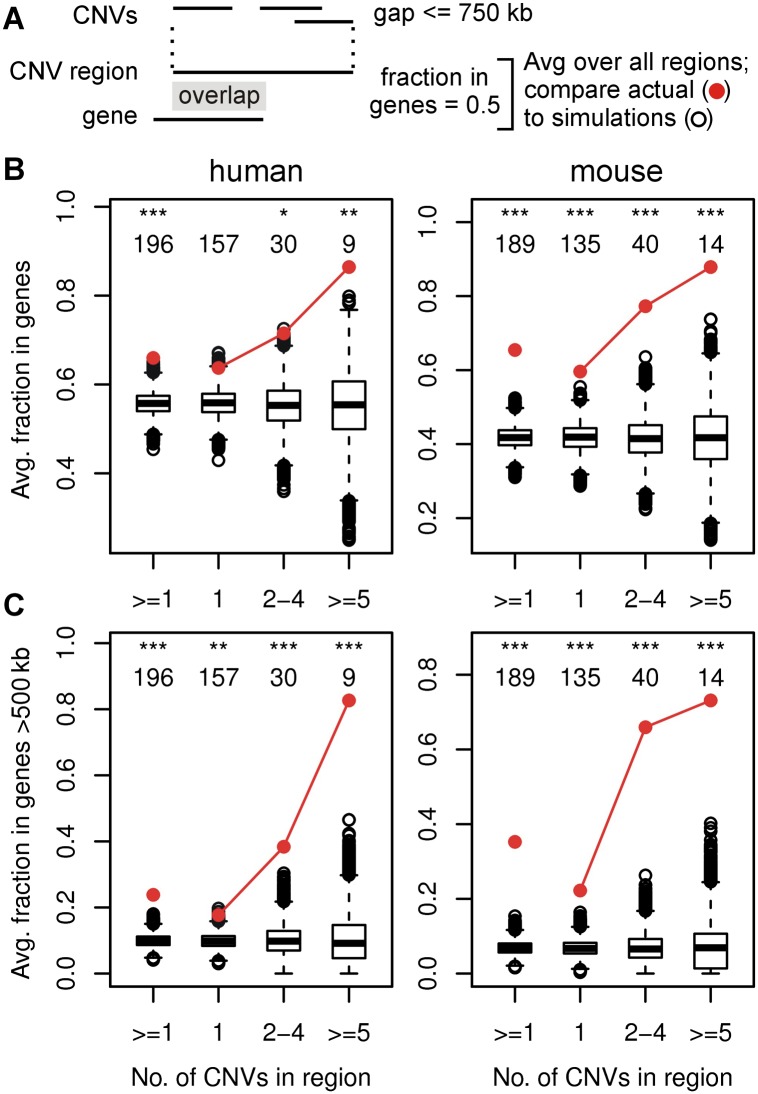
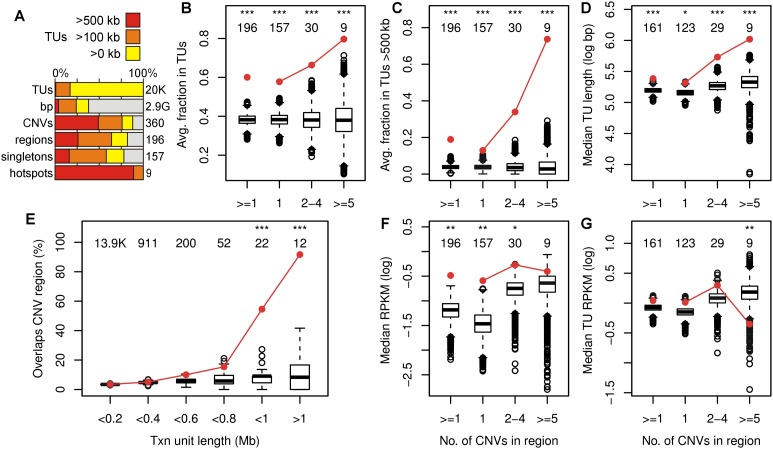
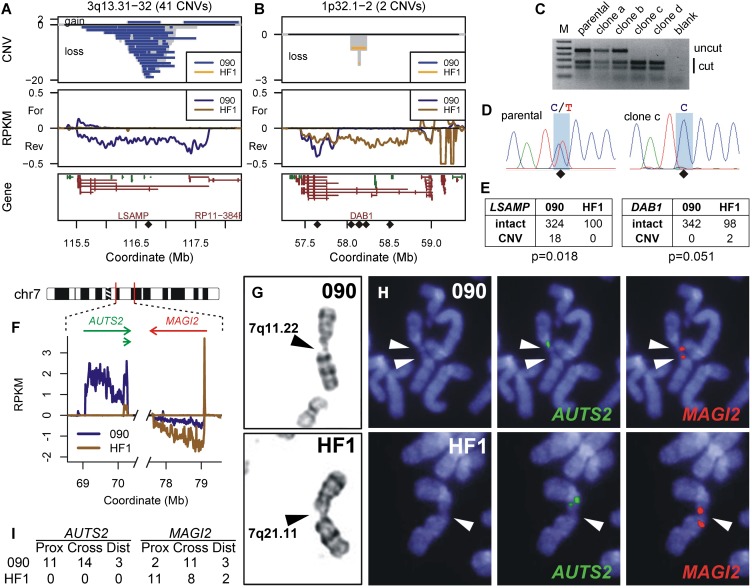
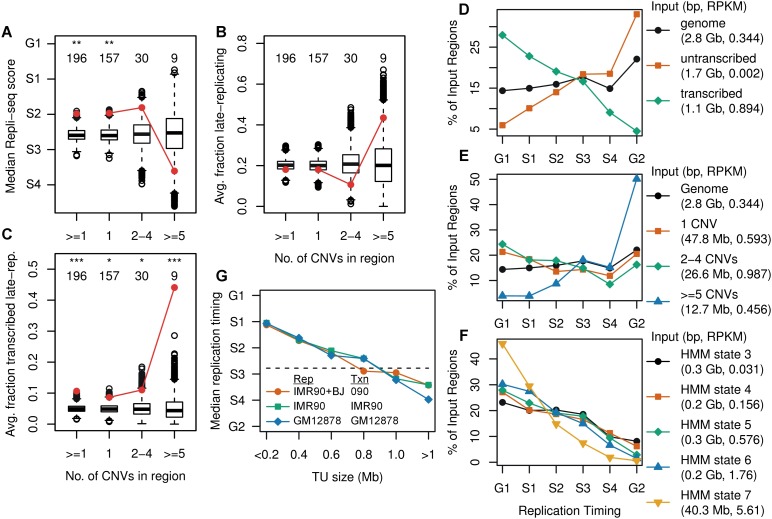
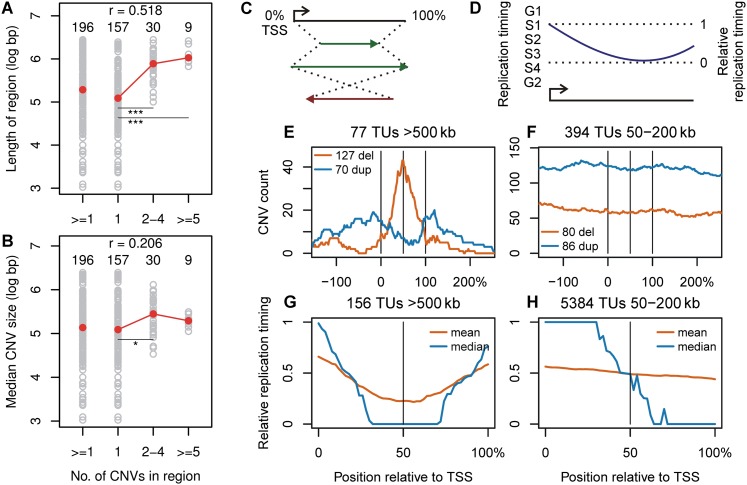
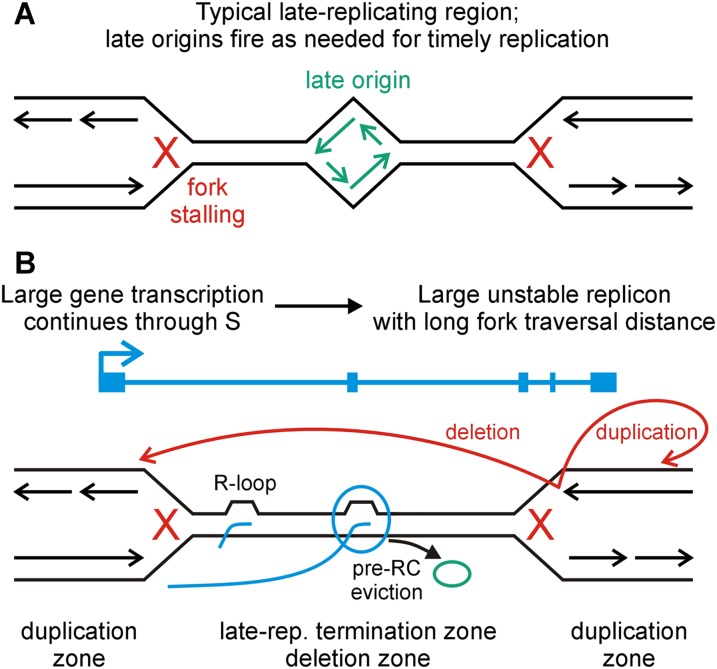
Copy number variants (CNVs) resulting from genomic deletions and duplications and common fragile sites (CFSs) seen as breaks on metaphase chromosomes are distinct forms of structural chromosome instability precipitated by replication inhibition. Although they share a common induction mechanism, it is not known how CNVs and CFSs are related or why some genomic loci are much more prone to their occurrence. Here we compare large sets of de novo CNVs and CFSs in several experimental cell systems to each other and to overlapping genomic features. We first show that CNV hotpots and CFSs occurred at the same human loci within a given cultured cell line. Bru-seq nascent RNA sequencing further demonstrated that although genomic regions with low CNV frequencies were enriched in transcribed genes, the CNV hotpots that matched CFSs specifically corresponded to the largest active transcription units in both human and mouse cells. Consistently, active transcription units >1 Mb were robust cell-type-specific predictors of induced CNV hotspots and CFS loci. Unlike most transcribed genes, these very large transcription units replicated late and organized deletion and duplication CNVs into their transcribed and flanking regions, respectively, supporting a role for transcription in replication-dependent lesion formation. These results indicate that active large transcription units drive extreme locus- and cell-type-specific genomic instability under replication stress, resulting in both CNVs and CFSs as different manifestations of perturbed replication dynamics.


Figures

Figure 1.
Figure 1.
Human and mouse CNV hotspot examples. (A) Summary of the genome features compared in this study and their acquisition methods. (B,C) Profiles of the two most highly clustered de novo CNV regions in human 090 fibroblasts and mES cells, respectively. CNVs are drawn as horizontal bars. The number of CNVs overlapping each genome bin is plotted as a gray histogram: positive CNV counts, duplications/gains; negative counts, deletions/losses. Bru-seq transcription data are plotted as follows: positive RPKM, forward transcription; negative RPKM, reverse transcription. ENCODE Repli-seq data (RepSeq) are plotted as the calculated replication timing, Repli-chip (RepChip) as the log2 of the replication timing ratio. Genes are shown as Ensembl transcripts: green lines, forward gene orientations; red lines, reverse orientations. Except for mouse B3galt1, labels are suppressed under 500-kb gene lengths. (NT) Untreated; (APH) aphidicolin; (HU) hydroxyurea; (IR) ionizing radiation; (wt) Xrcc4+/+; (mt) Xrcc4−/−. See Supplemental Figure S1 for additional profile plots.
Figure 2.
Figure 2.
CNV hotspots correspond to CFSs. (A) Counts of 090 CNVs from 223 cell clones and CFS breaks from 100 metaphases at the nine 090 CNV hotspots. Correspondence to known CFSs is indicated: (*) CFS location previously characterized by FISH; (**) CFS location characterized by FISH in Figure 5; (–) no known CFS. (B) Chr 3 and the 3q13.31/LSAMP hotspot/CFS. Symbols above and below the ideogram denote 090 CNVs and CFS breaks, respectively. CFSs are marked in the middle of the corresponding band, or with a bracket indicating multiple possible source bands. 3q13.31 fragile site boundaries are from Le Tallec et al. (2011). See Supplemental Figure S2 and Supplemental Table S4 for complete CFS-CNV data.
Figure 3.
Figure 3.
CNV hotspots are enriched in large genes. (A) Methods used to merge CNVs into CNV regions and assess overlap with genome features. (B,C) Enrichment plots for the fraction of CNV regions in genes and genes >500 kb, respectively, for human 090 fibroblasts (left panels) and mES cells (right panels). Red circles show the actual average values for the indicated CNV region groups. Box and whisker plots show the distribution of averages over all simulation iterations. The number of CNV regions in each group and significant differences between the actual value and iteration distributions are indicated: (*) P < 0.01; (**) P < 0.001; (***) P < 0.0001. See Supplemental Figure S3 for additional enrichment plots.
Figure 4.
Figure 4.
CNV hotspots correspond to active large transcription units. (A) Rows represent the total number of TUs, bp, CNVs, CNV regions, singleton CNVs, and hotspots in the mappable genome for human 090 fibroblasts. Colors indicate the percentage that overlapped TUs > 500 kb, > 100 kb, or any length. (BD) 090 CNV region enrichment plots for the fraction in Bru-seq TUs, fraction in TUs > 500 kb, and length of the longest overlapped TU, respectively, similar to Figure 3B. (E) 090 TU enrichment plot for the percentage of TUs that overlapped one or more CNVs. (F,G) 090 CNV region enrichment plots for the region’s Bru-seq RPKM and RPKM of the most highly expressed and overlapping TU, respectively. See Supplemental Figures S5 and S6 for mES cell and additional enrichment plots.
Figure 5.
Figure 5.
Cell-type-specific prediction of unstable loci at active large transcription units. (A,B) Chromosome region profiles, similar to Figure 1, B and C, for genes LSAMP and DAB1, respectively, with CNVs colored by their detection in either 090 or HF1 fibroblasts. Diamonds mark the positions of SNP RFLPs interrogated in HF1. (C) BccI digestion of SNP rs79114629 PCR products for HF1 parental cells and two APH-treated clones lacking (a and b) and containing (c and d) a deletion CNV. (D) Sequence analysis of clone c demonstrating LOH at SNP rs79114629. (E) Allele counts for LSAMP and DAB1, where 090 counts only include CNVs from treated clones detectable by the HF1 RFLP analysis. (F) Portions of 090 and HF1 Bru-seq transcription data relevant to CFS analysis at 7q11.22–q21.11, showing differential transcription of AUTS2. (G) Examples of G-banded chromosomes demonstrating breaks at 7q11.22 in 090 (top) and 7q21.11 in HF1 (bottom). (H) Representative FISH on DAPI stained chromosomes using probes to AUTS2 (green, middle) and MAGI2 (red, right). 090 shows breaks at both loci in a single chromosome (top), while HF1 shows a break at MAGI2 (bottom). (I) Summary of 090 and HF1 CFS breaks with respect to AUTS2 and MAGI2 FISH probes.
Figure 6.
Figure 6.
CNV clustering extent stratifies by replication timing. (AC) Human 090 fibroblast CNV region enrichment plots for the average replication timing in IMR-90 + BJ Repli-seq data, fraction in late-replicating segments, and fraction in the transcribed portions of late-replicating segments, respectively. (D) Distribution of replication timing for the entire genome as well as the transcribed and untranscribed portions of the genome, based on 090 Bru-seq and IMR-90 + BJ Repli-seq data. The legend indicates the aggregate size and Bru-seq RPKM of all input genome regions contributing to each trace. Each trace sums to 100% of its input regions. (E,F) Replication timing plots for CNV region groups and the transcribed portion of the genome stratified by transcription intensity, respectively. (G) Median replication timing for all TUs stratified into 200-kb size bins for different paired Repli-seq (Rep) and Bru-seq/GRO-seq (Txn) samples. A horizontal line indicates the IMR-90 + BJ genome median. See Supplemental Figures S7 and S8 for mES cell and additional enrichment plots.
Figure 7.
Figure 7.
Transcription unit replication dynamics shape CNV size, location, and type. (A,B) Correlation plots of the number of 090 fibroblast CNVs contained in CNV regions vs. the length of the regions and median size of CNVs in the regions, respectively. Individual regions are plotted as gray circles. Red circles are the group medians. The number of regions in each group, Spearman correlation coefficients (r), and significant differences between groups are indicated: (*) P < 0.01; (**) P < 0.001; (***) P < 0.0001. (C) Coordinate transformation used to align TUs according to their endpoints. (D) Transformation of replication timing data from absolute values to ones relative to the minimum and maximum within a TU. (E,F) Sum of 090 CNV counts within and flanking TUs > 500 kb and between 50 and 200 kb, respectively. The y-axis represents the number of CNVs crossing each plotted position. (G,H) Mean and median IMR-90 + BJ relative replication timing by position within 090 TUs > 500 kb and between 50 and 200 kb, respectively. See Supplemental Figures S10 and S11 for mES cell and additional alignment plots.
Figure 8.
Figure 8.
Model for CFS and CNV formation at active large transcription units. (A) Replication fork failures, even double-fork failures, occurring in most genomic loci can be rescued by the firing of late “dormant” origins. (B) The Transcription-dependent Double-Fork Failure (TrDoFF) model for extreme locus instability under replication stress proposes two mutagenic properties of active large TUs: (1) that they promote simultaneous failure of two converging forks, e.g., through the formation of R-loops; and (2) that they create large late-replicating domains where pre-RC eviction by prolonged transcription into S-phase prevents late origin firing. CFS breaks and deletion CNVs arise in the resulting unreplicated DNA, within the span of the TU, while duplications arise on the flanks, likely by template switching (red arrows).

References

    1. Aguilera A, Garcia-Muse T. 2012. R loops: from transcription byproducts to threats to genome stability. Mol Cell 46: 115–124. - PubMed
    1. Arlt MF, Durkin SG, Ragland RL, Glover TW. 2006. Common fragile sites as targets for chromosome rearrangements. DNA Repair (Amst) 5: 1126–1135. - PubMed
    1. Arlt MF, Mulle JG, Schaibley VM, Ragland RL, Durkin SG, Warren ST, Glover TW. 2009. Replication stress induces genome-wide copy number changes in human cells that resemble polymorphic and pathogenic variants. Am J Hum Genet 84: 339–350. - PMC - PubMed
    1. Arlt MF, Ozdemir AC, Birkeland SR, Wilson TE, Glover TW. 2011. Hydroxyurea induces de novo copy number variants in human cells. Proc Natl Acad Sci 108: 17360–17365. - PMC - PubMed
    1. Arlt MF, Rajendran S, Birkeland SR, Wilson TE, Glover TW. 2012. De novo CNV formation in mouse embryonic stem cells occurs in the absence of Xrcc4-dependent nonhomologous end joining. PLoS Genet 8: e1002981. - PMC - PubMed

Publication types